

Comment
doi: 10.1038/mp.2017.181.
Overestimation of the classification accuracy of a biomarker for assessing heavy alcohol use
Affiliations
- PMID: 28894303
- PMCID: PMC5847393
- DOI: 10.1038/mp.2017.181
Item in Clipboard
Comment
Overestimation of the classification accuracy of a biomarker for assessing heavy alcohol use
Mol Psychiatry.
2018 Nov.
No abstract available
Conflict of interest statement
The authors declare no conflict of interest.
Figures
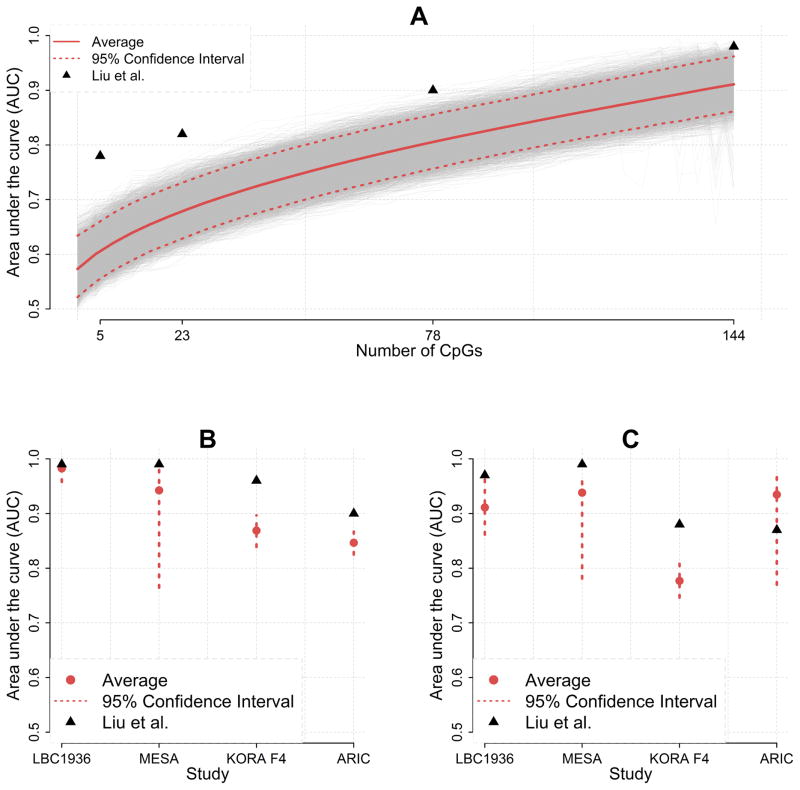
A) We simulated 10,000 data-sets with parameters mimicking the Lothian Birth Cohort 1936 (LBC1936) that has 574
individuals who are light drinkers and 61 heavy drinkers (Table 1 in Liu et al.). We first simulated age, sex, and BMI so that
logistic regression produced an average AUC of 0.57, which is approximately the value of the “Null” model (right
panel of Figure 2 in Liu et al.). Next, we added simulated CpG data to the model that was independent of the outcome. To
illustrate the effect of the number of predictors\variables on the AUC, we increased the number of CpGs included from 0 to
144 in steps of 4 (i.e., 0, 4, 8,…,144). To maximize compatibility with Figure 2 in Liu et al., the x-axis displays only
the sets of 5, 23, 78, and 144 CpGs. In the figure we plotted the average AUC (red solid curve) with the 95% confidence
intervals (red dashed lines). The black triangles indicate the values reported by Liu at al. B) The above simulation
was repeated for all other replication cohorts comparing non- vs Heavy drinkers. Sample sizes were: LBC 1936:181 vs. 61, MESA: 691
vs. 51, KORA F4: 534 vs. 230, ARIC: 1519 vs. 348. Only the results for the full model with 144 CpGs are reported. We did not
include the FHS cohort because, as mentioned by Liu et al., this cohort was also used in the discovery stage to find the 144 CpGs.
In the figure we plotted the average AUC (red solid point) with the 95% confidence intervals (red dashed lines). The black
triangles indicate the values reported by Liu at al. C) We also performed simulations using the sample sizes for the
analysis comparing light vs heavy drinkers are: LBC 1936: 574 vs. 61, MESA: 444 vs. 51, KORA F4: 751 vs. 230, ARIC: 67 vs. 348.
See panel B for explanation of legend etc.
Comment on
-
A DNA methylation biomarker of alcohol consumption.Mol Psychiatry. 2018 Feb;23(2):422-433. doi: 10.1038/mp.2016.192. Epub 2016 Nov 15. Mol Psychiatry. 2018. PMID: 27843151 Free PMC article.
References
-
- Hastie T, Tibshirani R, Friedman J. The Elements of Statistical Learning: Data Mining, Inference, and Prediction. Springer Verlag; New York: 2001.
Publication types
MeSH terms
Substances
Grants and funding
LinkOut - more resources
Full Text Sources
Other Literature Sources
Medical
