

Temporal Profile of Microtubule-Associated Protein 2: A Novel Indicator of Diffuse Brain Injury Severity and Early Mortality after Brain Trauma
- PMID: 28895474
- PMCID: PMC5757083
- DOI: 10.1089/neu.2017.4994
Temporal Profile of Microtubule-Associated Protein 2: A Novel Indicator of Diffuse Brain Injury Severity and Early Mortality after Brain Trauma
Abstract
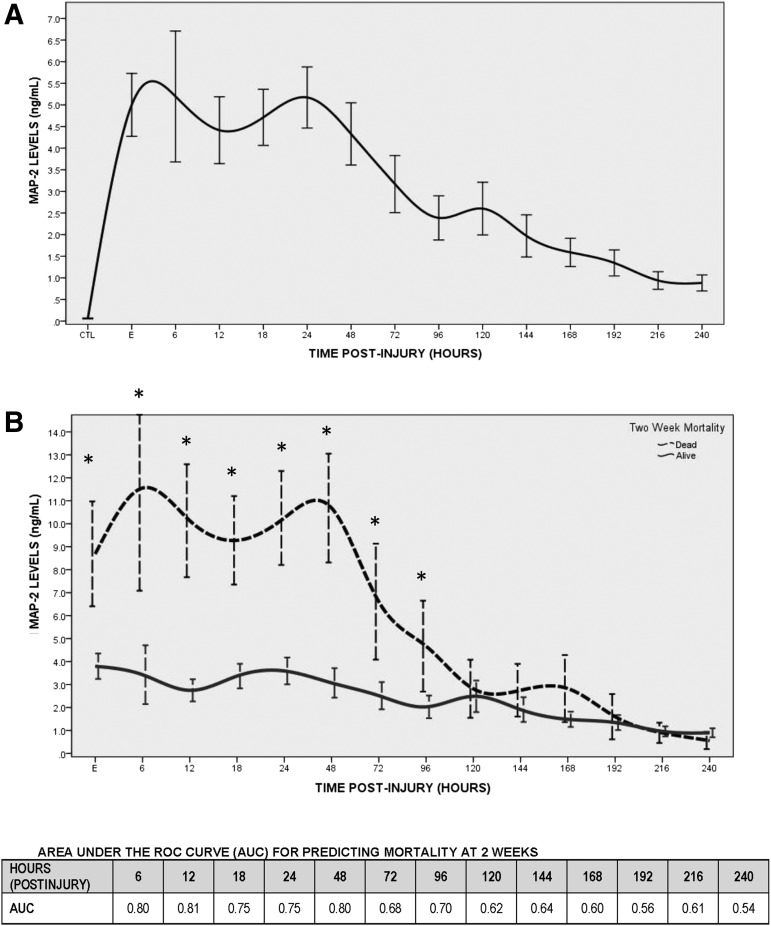
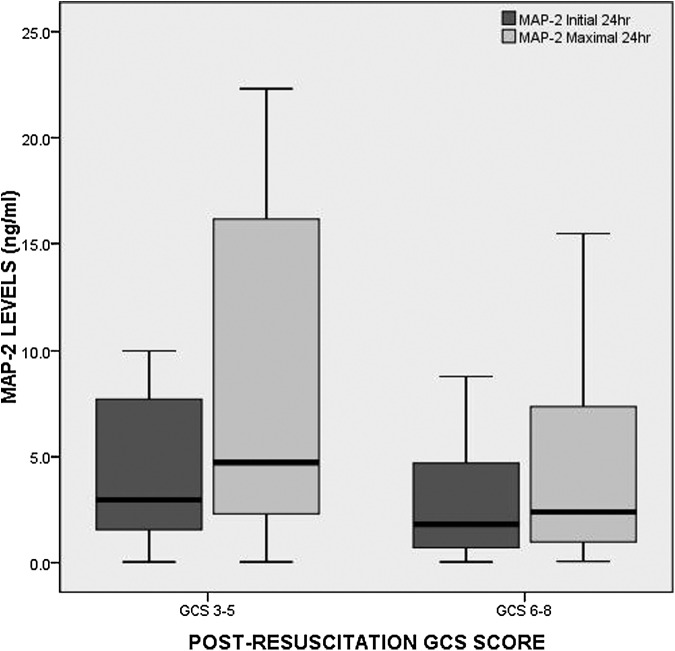
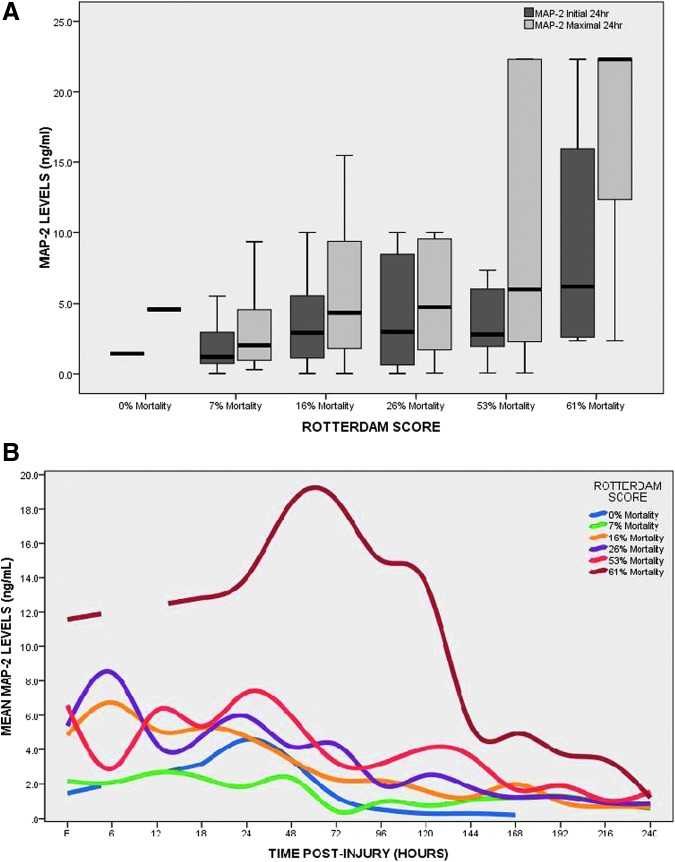
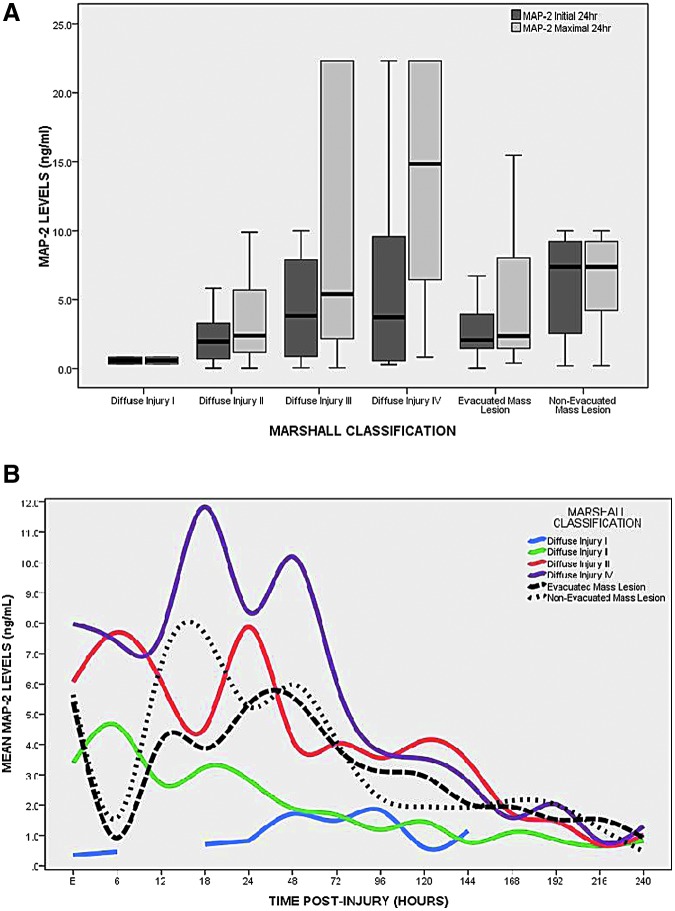
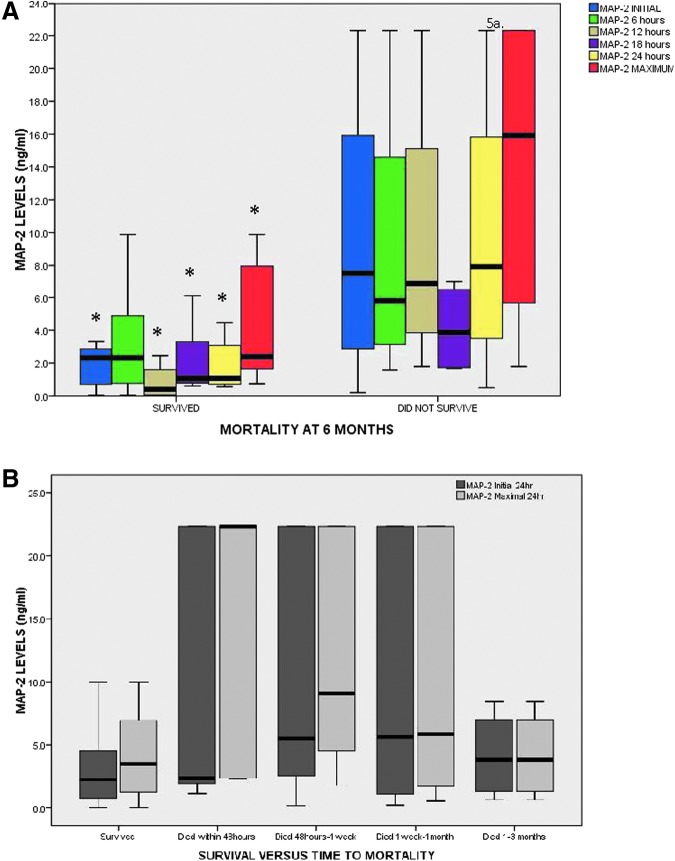
This study compared cerebrospinal fluid (CSF) levels of microtubule-associated protein 2 (MAP-2) from adult patients with severe traumatic brain injury (TBI) with uninjured controls over 10 days, and examined the relationship between MAP-2 concentrations and acute clinical and radiologic measures of injury severity along with mortality at 2 weeks and over 6 months. This prospective study, conducted at two Level 1 trauma centers, enrolled adults with severe TBI (Glasgow Coma Scale [GCS] score ≤8) requiring a ventriculostomy, as well as controls. Ventricular CSF was sampled from each patient at 6, 12, 24, 48, 72, 96, 120, 144, 168, 192, 216, and 240 h following TBI and analyzed via enzyme-linked immunosorbent assay for MAP-2 (ng/mL). Injury severity was assessed by the GCS score, Marshall Classification on computed tomography (CT), Rotterdam CT score, and mortality. There were 151 patients enrolled-130 TBI and 21 control patients. MAP-2 was detectable within 6 h of injury and was significantly elevated compared with controls (p < 0.001) at each time-point. MAP-2 was highest within 72 h of injury and decreased gradually over 10 days. The area under the receiver operating characteristic curve for deciphering TBI versus controls at the earliest time-point CSF was obtained was 0.96 (95% CI 0.93-0.99) and for the maximal 24-h level was 0.98 (95% CI 0.97-1.00). The area under the curve for initial MAP-2 levels predicting 2-week mortality was 0.80 at 6 h, 0.81 at 12 h, 0.75 at 18 h, 0.75 at 24 h, and 0.80 at 48 h. Those with Diffuse Injury III-IV had much higher initial (p = 0.033) and maximal (p = 0.003) MAP-2 levels than those with Diffuse Injury I-II. There was a graded increase in the overall levels and peaks of MAP-2 as the degree of diffuse injury increased within the first 120 h post-injury. These data suggest that early levels of MAP-2 reflect severity of diffuse brain injury and predict 2-week mortality in TBI patients. These findings have implications for counseling families and improving clinical decision making early after injury and guiding multidisciplinary care. Further studies are needed to validate these findings in a larger sample.
Keywords: biomarkers; diffuse axonal injury; microtubule-associated protein; mortality; neuronal injury; outcome; severe traumatic brain injury; traumatic brain injury.
Conflict of interest statement
This study was funded by NIH RO1 NS052831, “Biochemical Markers of Severe Traumatic Brain Injury.”
Drs. Gabrielli, Hannay, Heaton, Robertson, Robicsek, and Schmalfuss have no competing financial interests.
Drs. Brophy and Papa are consultants of Banyan Biomarkers, Inc., but receive no stocks or royalties from the company and will not benefit financially from this publication.
Dr. Hayes and Wang own stock in and receive royalties from Banyan Biomarkers Inc., and as such may benefit financially as a result of the outcomes of this research or work reported in this publication.
Figures
References
-
- Faul M., Xu L., Wald M.M., and Coronado V.G. (2010). Traumatic Brain Injury in the United States. Emergency Department Visits, Hospitalizations and Deaths 2002–2006. U.S. Department of Health and Human Services, Centers for Disease Control and Prevention: Atlanta, GA
-
- Papa L. (2012) Exploring the role of biomarkers for the diagnosis and management of traumatic brain injury patients, in: Proteomics—Human Diseases and Protein Functions. Man T.K. and Flores R.J. (eds). InTech Open Access Publisher: Rijeka, Croatia
-
- Papa L., Robinson G., Oli M., Pineda J., Demery J., Brophy G., Robicsek S.A., Gabrielli A., Robertson C.S., Wang K.W., and Hayes R.L. (2008) Use of biomarkers for diagnosis and management of traumatic brain injury patients. Expert Opin. Med. Diagn. 2, 937–945 - PubMed
-
- Pineda J.A., Lewis S.B., Valadka A.B., Papa L., Hannay H.J., Heaton S.C., Demery J.A., Liu M.C., Aikman J.M., Akle V., Brophy G.M., Tepas J.J., Wang K.K., Robertson C.S., and Hayes R.L. (2007) Clinical significance of alphaII-spectrin breakdown products in cerebrospinal fluid after severe traumatic brain injury. J. Neurotrauma 24, 354–366 - PubMed
-
- Brophy G.M., Pineda J.A., Papa L., Lewis S.B., Valadka A.B., Hanna H.J., Heaton S.C., Demery J.A., Liu M.C., Tepas J.J., 3rd, Gabrielli A., Robicsek S., Wang K.K., Robertson C.S., Hayes R.L. (2009) alphaII-Spectrin breakdown product cerebrospinal fluid exposure metrics suggest differences in cellular injury mechanisms after severe traumatic brain injury. J. Neurotrauma 26, 471–479 - PMC - PubMed
Publication types
MeSH terms
Substances
Grants and funding
LinkOut - more resources
Full Text Sources
Other Literature Sources
