. 2017 Sep 12;6(3):29.
doi: 10.3390/cells6030029.

Delayed Activation Kinetics of Th2- and Th17 Cells Compared to Th1 Cells

Affiliations

Delayed Activation Kinetics of Th2- and Th17 Cells Compared to Th1 Cells

Andrea Duechting et al. Cells. .

Abstract

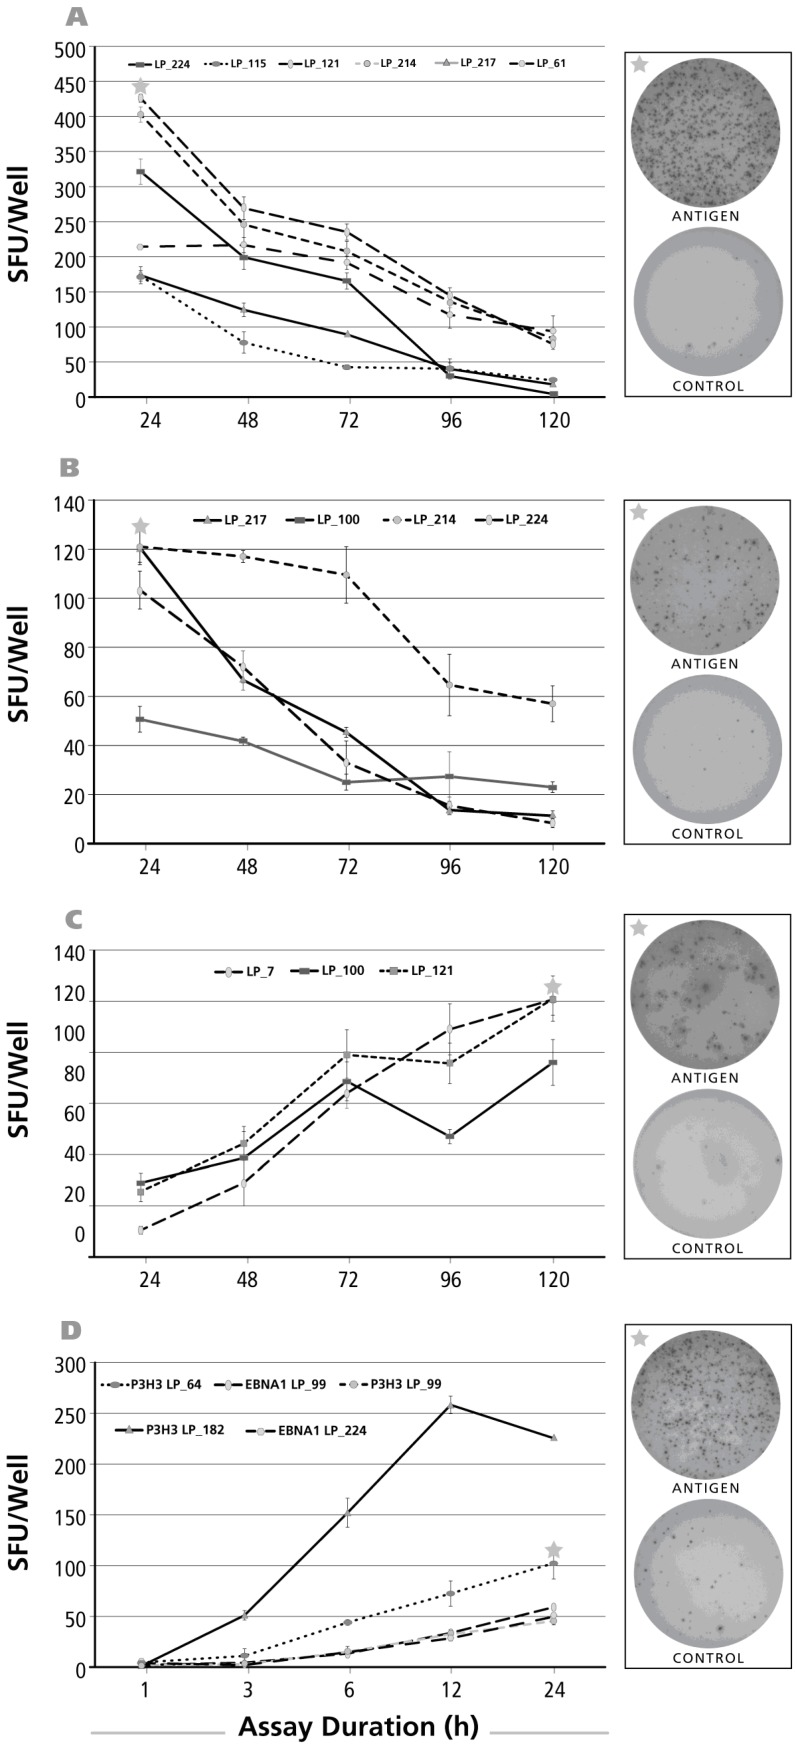
During immune responses, different classes of T cells arise: Th1, Th2, and Th17. Mobilizing the right class plays a critical role in successful host defense and therefore defining the ratios of Th1/Th2/Th17 cells within the antigen-specific T cell repertoire is critical for immune monitoring purposes. Antigen-specific Th1, Th2, and Th17 cells can be detected by challenging peripheral blood mononuclear cells (PBMC) with antigen, and establishing the numbers of T cells producing the respective lead cytokine, IFN-γ and IL-2 for Th1 cells, IL-4 and IL-5 for Th2, and IL-17 for Th-17 cells, respectively. Traditionally, these cytokines are measured within 6 h in flow cytometry. We show here that 6 h of stimulation is sufficient to detect peptide-induced production of IFN-γ, but 24 h are required to reveal the full frequency of protein antigen-specific Th1 cells. Also the detection of IL-2 producing Th1 cells requires 24 h stimulation cultures. Measurements of IL-4 producing Th2 cells requires 48-h cultures and 96 h are required for frequency measurements of IL-5 and IL-17 secreting T cells. Therefore, accounting for the differential secretion kinetics of these cytokines is critical for the accurate determination of the frequencies and ratios of antigen-specific Th1, Th2, and Th17 cells.

Keywords: CD4 cells; ELISPOT; T cells; cytokine kinetics; immune monitoring; multiplexing.


Conflict of interest statement

P.V.L. is Founder, President and CEO of CTL, a company that specializes in immune monitoring by ELISPOT. A.D and A.P. are visiting scholars at CTL. The authors declare no conflicts of interest pertaining to this study.

Figures

Figure 1
Figure 1
Gradation of magnitudes for antigen-specific recall responses. Peripheral blood mononuclear cells (PBMC) of healthy human donors were tested for recall responses to the antigens specified on the X axis—the numbers of PBMC donors tested is specified on the Y axis. In panel (A) the results for IFN-γ are shown; in (BE) for IL-2, IL-4, IL-5 and IL-17, respectively. Response magnitudes are indicated by different shades, as specified, and are defined as follows: negative, off-white: no statistically significant difference between three medium control wells and the three antigen wells tested, as defined by the Student’s t-test, and a cut-off value of p > 0.05. Weak response, in light grey: spot counts reaching statistical difference, but less than 20 SFU per 400/000 PBMC. Intermediate response, in dark grey: Spot Forming Unit (SFU) counts for antigen-induced response between 20 and 100. Strong response, in black: more than 100 antigen-induced SFU/400,000 cells.
Figure 2
Figure 2
Kinetics of the antigen-induced IL-17 recall response. Donors and antigens were selected that scored IL-17 positive in the screening experiments (Figure 1). Panel (A) shows the test results for CMV gr.2 antigen-induced IL-17 production; in Panel (B) Purified Protein Derivative of PPD-triggered IL-17 was tested; in Panel (C) Dust mite was used as the recall antigen to activate IL-17-producing T cells. The donors tested are specified by symbols within each panel. The PBMC (400,000 cells per well) were cultured with the antigen for the time periods specified on the X axis (“Assay Duration”), and after the IL-17 spots were counted as SFU/well, Y axis. Each data point represents the mean and SD for the SFU counts in the three replicate wells tested. Of note, the time course was established testing the same cells in a single experiment: thus, for the different assay durations shown, only the length of the antigen stimulation period varied. On the right of each panel, on the top, the image of the respective antigen containing well is shown, with an asterisk marking the corresponding data point in the graph. The well image on the bottom shows the matching medium control well.
Figure 2
Figure 2
Kinetics of the antigen-induced IL-17 recall response. Donors and antigens were selected that scored IL-17 positive in the screening experiments (Figure 1). Panel (A) shows the test results for CMV gr.2 antigen-induced IL-17 production; in Panel (B) Purified Protein Derivative of PPD-triggered IL-17 was tested; in Panel (C) Dust mite was used as the recall antigen to activate IL-17-producing T cells. The donors tested are specified by symbols within each panel. The PBMC (400,000 cells per well) were cultured with the antigen for the time periods specified on the X axis (“Assay Duration”), and after the IL-17 spots were counted as SFU/well, Y axis. Each data point represents the mean and SD for the SFU counts in the three replicate wells tested. Of note, the time course was established testing the same cells in a single experiment: thus, for the different assay durations shown, only the length of the antigen stimulation period varied. On the right of each panel, on the top, the image of the respective antigen containing well is shown, with an asterisk marking the corresponding data point in the graph. The well image on the bottom shows the matching medium control well.
Figure 3
Figure 3
Kinetics of the IL-5 recall response by Th2 cells. The legend to Figure 2 applies, except that an IL-5 ELISPOT assay was done with donors and antigens that scored positive for IL-5. In Panel (A) CMV gr.2 was used as the recall antigen to activate IL-5 producing T cells; in Panel (B), PPD-triggered IL-5 production is shown; and in Panel (C) dust mite was used to stimulate T cells.
Figure 4
Figure 4
Kinetics of the IL-4 recall response by Th2 cells. The legend to Figure 2 applies, except that an IL-4 ELISPOT assay was done with donors and antigens that scored positive for IL-4. In Panel (A) CMV gr.2 was the recall antigen used to elicit IL-4 production in memory T cells; in Panel (B) the dust mite antigen stimulated IL-4 recall response is shown.
Figure 5
Figure 5
Kinetics of the IL-2 recall response by Th1 cells. The legend to Figure 2 applies, except that an IL-2 ELISPOT assay was done with donors and antigens that scored positive for IL-2. The antigens used to elicit IL-2 production were, in Panel (A); CMV gr.2; in Panel (B) PPD; and in Panel (C) dust mite; In Panel (D), the IL-2 assay duration was 1, 3, 6, 12 and 24 h with the insert specifying the donor/antigen combinations tested.
Figure 6
Figure 6
Kinetics of the IFN-γ recall response by Th1 cells. The legend to Figure 2 applies, except that an IFN-γ ELISPOT assay was performed with donors and antigens that scored positive for IFN-γ. Panel (A) shows CMV gr.2 antigen-triggered IFN-γ production that requires antigen processing; in Panel (B) the results for testing a pool of 15-mer peptides is shown—these peptides cover the sequence of CMV protein pp65—such peptides can bind directly to HLA-Class II molecules and do not need processing; Panel (C) shows the kinetics of IFN-γ production after stimulation with a nine amino acid long peptide of CMV that covers amino acid positions 495–503 of pp65 protein. This CMV pp65 (495–503) peptide is a well-defined HLA-A2-restricted CMV determinant and all donors tested in C were HLA-A2 positive; Panel (D) shows the kinetics of the CEF peptide pool induced IFN-γ recall response.
Figure 6
Figure 6
Kinetics of the IFN-γ recall response by Th1 cells. The legend to Figure 2 applies, except that an IFN-γ ELISPOT assay was performed with donors and antigens that scored positive for IFN-γ. Panel (A) shows CMV gr.2 antigen-triggered IFN-γ production that requires antigen processing; in Panel (B) the results for testing a pool of 15-mer peptides is shown—these peptides cover the sequence of CMV protein pp65—such peptides can bind directly to HLA-Class II molecules and do not need processing; Panel (C) shows the kinetics of IFN-γ production after stimulation with a nine amino acid long peptide of CMV that covers amino acid positions 495–503 of pp65 protein. This CMV pp65 (495–503) peptide is a well-defined HLA-A2-restricted CMV determinant and all donors tested in C were HLA-A2 positive; Panel (D) shows the kinetics of the CEF peptide pool induced IFN-γ recall response.

References

    1. Steinman L. A brief history of t(h)17, the first major revision in the t(h)1/t(h)2 hypothesis of t cell-mediated tissue damage. Nat. Med. 2007;13:139–145. doi: 10.1038/nm1551. - DOI - PubMed
    1. Tigno-Aranjuez J.T., Lehmann P.V., Tary-Lehmann M. Dissociated induction of cytotoxicity and dth by cfa and cpg. J. Immunother. 2009;32:389–398. doi: 10.1097/CJI.0b013e31819d79a7. - DOI - PubMed
    1. Goldrath A.W., Bogatzki L.Y., Bevan M.J. Naive t cells transiently acquire a memory-like phenotype during homeostasis-driven proliferation. J. Exp. Med. 2000;192:557–564. doi: 10.1084/jem.192.4.557. - DOI - PMC - PubMed
    1. Hsieh C.S., Macatonia S.E., Tripp C.S., Wolf S.F., O’Garra A., Murphy K.M. Development of th1 cd4+ t cells through il-12 produced by listeria-induced macrophages. Science. 1993;260:547–549. doi: 10.1126/science.8097338. - DOI - PubMed
    1. Macatonia S.E., Hosken N.A., Litton M., Vieira P., Hsieh C.S., Culpepper J.A., Wysocka M., Trinchieri G., Murphy K.M., O’Garra A. Dendritic cells produce il-12 and direct the development of th1 cells from naive cd4+ t cells. J. Immunol. 1995;154:5071–5079. - PubMed

LinkOut - more resources