

Simulation of Reversible Protein-Protein Binding and Calculation of Binding Free Energies Using Perturbed Distance Restraints
- PMID: 28898077
- PMCID: PMC5688412
- DOI: 10.1021/acs.jctc.7b00706
Simulation of Reversible Protein-Protein Binding and Calculation of Binding Free Energies Using Perturbed Distance Restraints
Abstract
Virtually all biological processes depend on the interaction between proteins at some point. The correct prediction of biomolecular binding free-energies has many interesting applications in both basic and applied pharmaceutical research. While recent advances in the field of molecular dynamics (MD) simulations have proven the feasibility of the calculation of protein-protein binding free energies, the large conformational freedom of proteins and complex free energy landscapes of binding processes make such calculations a difficult task. Moreover, convergence and reversibility of resulting free-energy values remain poorly described. In this work, an easy-to-use, yet robust approach for the calculation of standard-state protein-protein binding free energies using perturbed distance restraints is described. In the binding process the conformations of the proteins were restrained, as suggested earlier. Two approaches to avoid end-state problems upon release of the conformational restraints were compared. The method was evaluated by practical application to a small model complex of ubiquitin and the very flexible ubiquitin-binding domain of human DNA polymerase ι (UBM2). All computed free energy differences were closely monitored for convergence, and the calculated binding free energies had a mean unsigned deviation of only 1.4 or 2.5 kJ·mol-1 from experimental values. Statistical error estimates were in the order of thermal noise. We conclude that the presented method has promising potential for broad applicability to quantitatively describe protein-protein and various other kinds of complex formation.
Conflict of interest statement
The authors declare no competing financial interest.
Figures
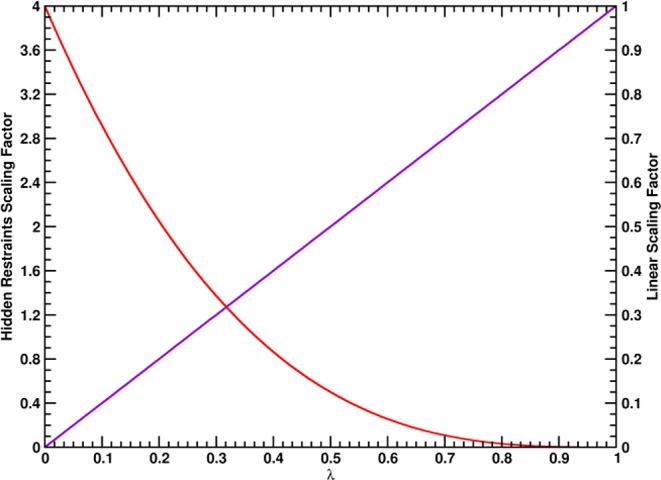
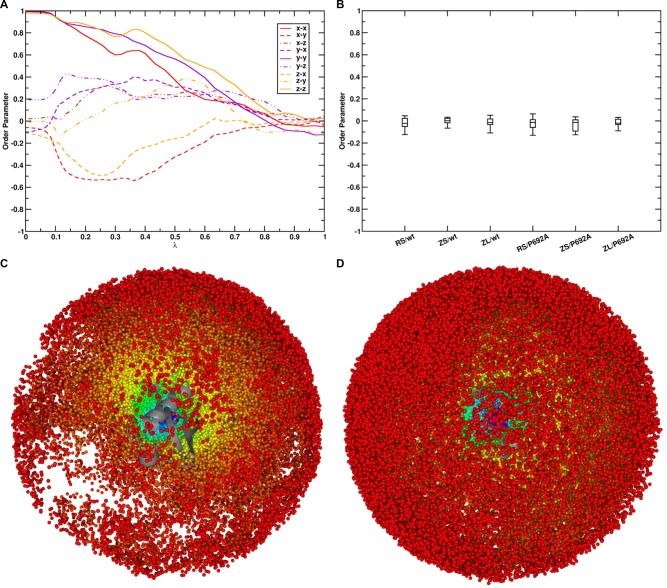
 . The scaling factor for the intermolecular
Cα–Cα distance restraints are indicated with a
red line (HR, f(λ) = 4(1 – λ)3) and the linear scaling factor for the radial COM–COM
distance restraint or linear COM–COM distance restraint in
the z-component is indicated with a violet line (f(λ) = λ).
. The scaling factor for the intermolecular
Cα–Cα distance restraints are indicated with a
red line (HR, f(λ) = 4(1 – λ)3) and the linear scaling factor for the radial COM–COM
distance restraint or linear COM–COM distance restraint in
the z-component is indicated with a violet line (f(λ) = λ).
Similar articles
-
Comparison of Receptor-Ligand Restraint Schemes for Alchemical Absolute Binding Free Energy Calculations.J Chem Theory Comput. 2023 Jun 27;19(12):3686-3704. doi: 10.1021/acs.jctc.3c00139. Epub 2023 Jun 7. J Chem Theory Comput. 2023. PMID: 37285579 Free PMC article.
-
Evaluation of Predicted Protein-Protein Complexes by Binding Free Energy Simulations.J Chem Theory Comput. 2019 Mar 12;15(3):2071-2086. doi: 10.1021/acs.jctc.8b01022. Epub 2019 Feb 15. J Chem Theory Comput. 2019. PMID: 30698954
-
Quantum mechanical binding free energy calculation for phosphopeptide inhibitors of the Lck SH2 domain.J Comput Chem. 2011 Jul 30;32(10):2254-63. doi: 10.1002/jcc.21808. Epub 2011 Apr 11. J Comput Chem. 2011. PMID: 21484840
-
Taming Rugged Free Energy Landscapes Using an Average Force.Acc Chem Res. 2019 Nov 19;52(11):3254-3264. doi: 10.1021/acs.accounts.9b00473. Epub 2019 Nov 4. Acc Chem Res. 2019. PMID: 31680510 Review.
-
Hazardous Shortcuts in Standard Binding Free Energy Calculations.J Phys Chem Lett. 2022 Jul 14;13(27):6250-6258. doi: 10.1021/acs.jpclett.2c01490. Epub 2022 Jun 30. J Phys Chem Lett. 2022. PMID: 35771686 Review.
Cited by
-
How does the same ligand activate signaling of different receptors in TNFR superfamily: a computational study.J Cell Commun Signal. 2023 Sep;17(3):657-671. doi: 10.1007/s12079-022-00701-2. Epub 2022 Sep 28. J Cell Commun Signal. 2023. PMID: 36167956 Free PMC article.
-
Computational Tools for Accurate Binding Free-Energy Prediction.Methods Mol Biol. 2022;2385:255-292. doi: 10.1007/978-1-0716-1767-0_12. Methods Mol Biol. 2022. PMID: 34888724
-
Thermodynamics and Free Energy Landscape of BAR-Domain Dimerization from Molecular Simulations.J Phys Chem B. 2021 Apr 22;125(15):3739-3751. doi: 10.1021/acs.jpcb.0c10992. Epub 2021 Apr 7. J Phys Chem B. 2021. PMID: 33826319 Free PMC article.
-
On Restraints in End-Point Protein-Ligand Binding Free Energy Calculations.J Comput Chem. 2020 Mar 5;41(6):573-586. doi: 10.1002/jcc.26119. Epub 2019 Dec 10. J Comput Chem. 2020. PMID: 31821590 Free PMC article.
-
Computer aided drug design in the development of proteolysis targeting chimeras.Comput Struct Biotechnol J. 2023 Feb 24;21:2058-2067. doi: 10.1016/j.csbj.2023.02.042. eCollection 2023. Comput Struct Biotechnol J. 2023. PMID: 36968015 Free PMC article. Review.
References
-
- van Gunsteren W. F.; Bakowies D.; Baron R.; Chandrasekhar I.; Christen M.; Daura X.; Gee P.; Geerke D. P.; Glattli A.; Hunenberger P. H.; Kastenholz M. A.; Oostenbrink C.; Schenk M.; Trzesniak D.; van der Vegt N. F.; Yu H. B. Biomolecular Modeling: Goals, Problems, Perspectives. Angew. Chem., Int. Ed. 2006, 45 (25), 4064–92. 10.1002/anie.200502655. - DOI - PubMed
MeSH terms
Substances
Grants and funding
LinkOut - more resources
Full Text Sources
Other Literature Sources