. 2017 Sep 11;32(3):295-309.e12.
doi: 10.1016/j.ccell.2017.08.003.

Identification of GPC2 as an Oncoprotein and Candidate Immunotherapeutic Target in High-Risk Neuroblastoma

Affiliations

Identification of GPC2 as an Oncoprotein and Candidate Immunotherapeutic Target in High-Risk Neuroblastoma

Kristopher R Bosse et al. Cancer Cell. .

Abstract

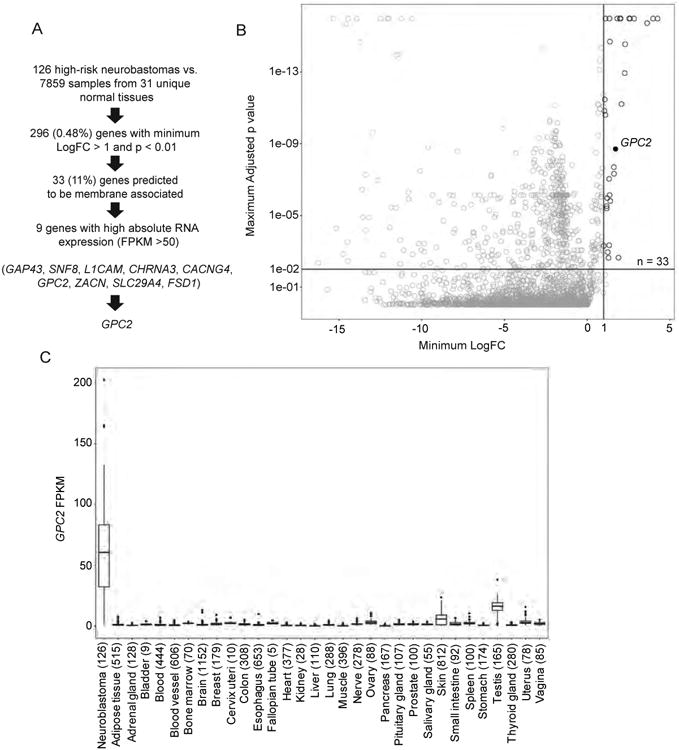
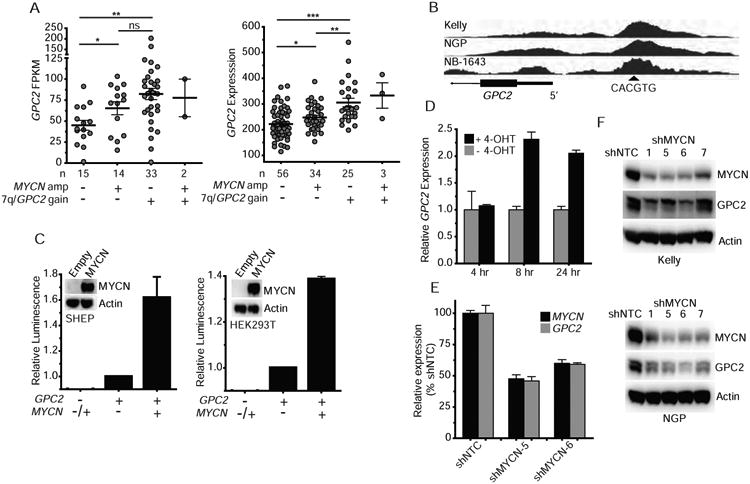
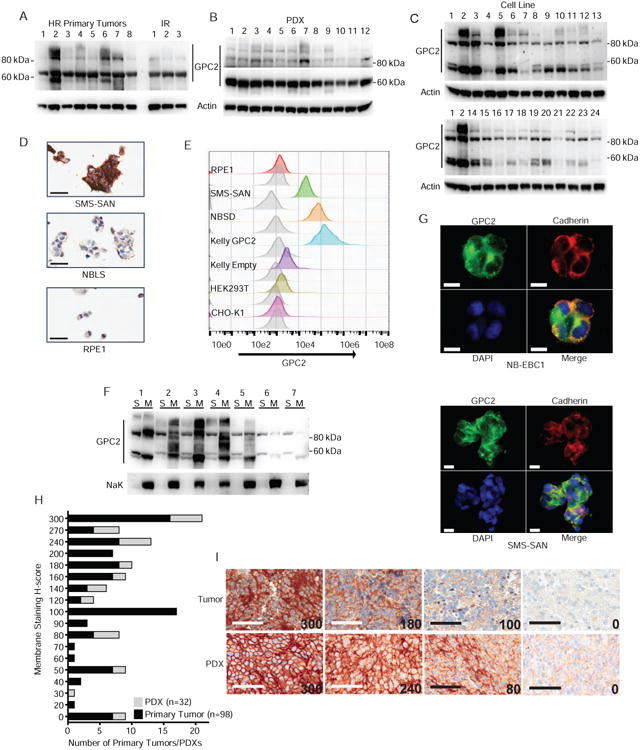
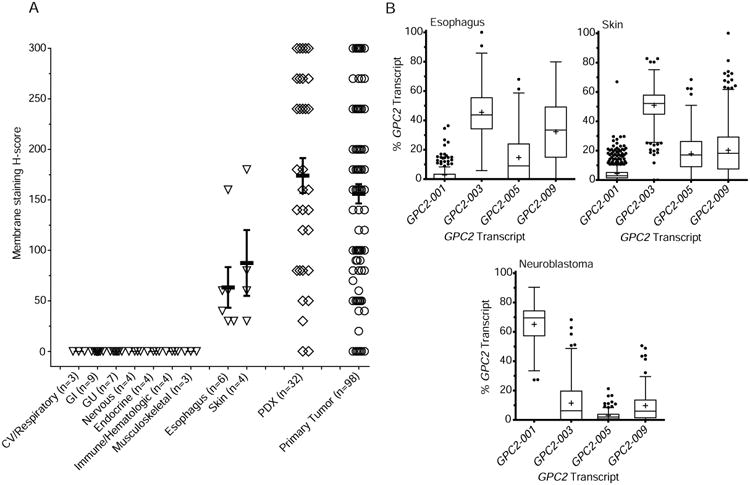
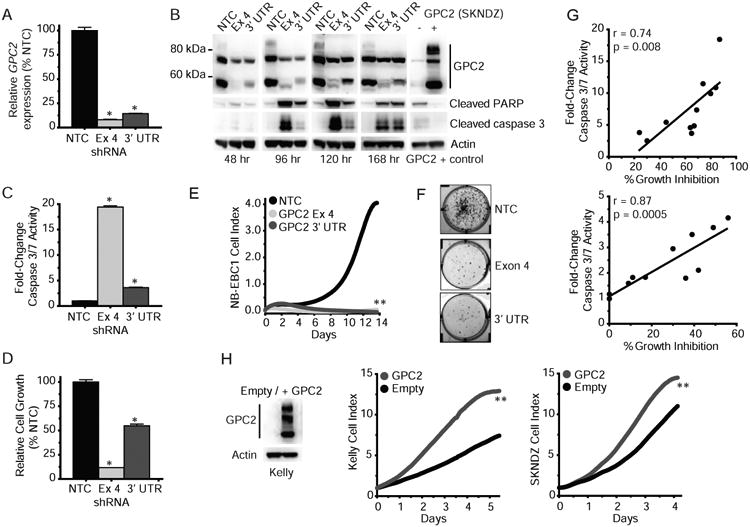
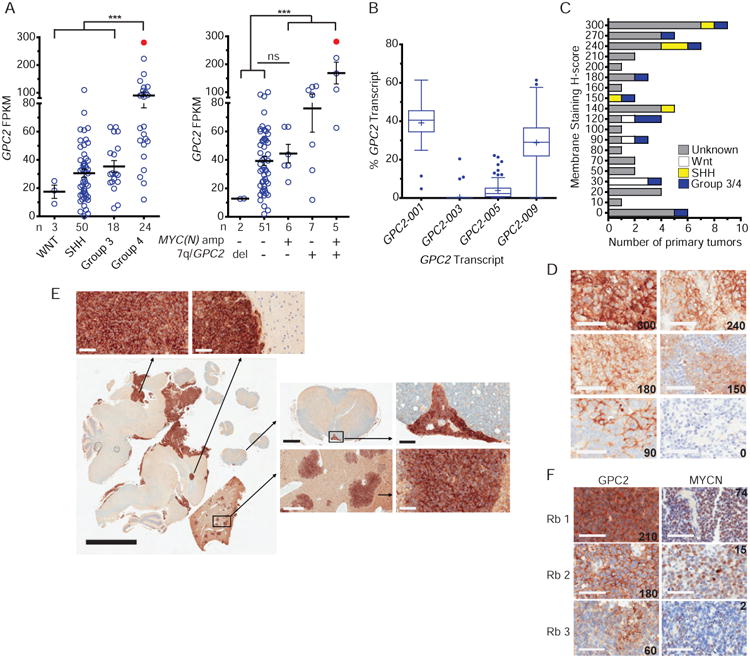
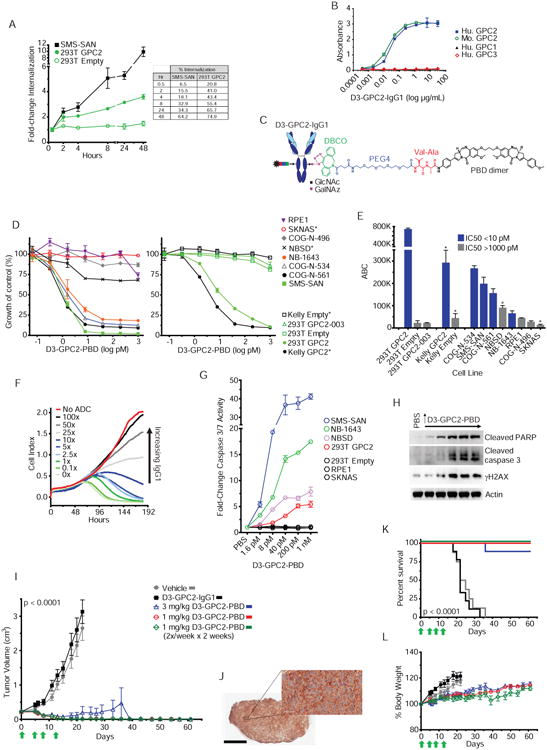
We developed an RNA-sequencing-based pipeline to discover differentially expressed cell-surface molecules in neuroblastoma that meet criteria for optimal immunotherapeutic target safety and efficacy. Here, we show that GPC2 is a strong candidate immunotherapeutic target in this childhood cancer. We demonstrate high GPC2 expression in neuroblastoma due to MYCN transcriptional activation and/or somatic gain of the GPC2 locus. We confirm GPC2 to be highly expressed on most neuroblastomas, but not detectable at appreciable levels in normal childhood tissues. In addition, we demonstrate that GPC2 is required for neuroblastoma proliferation. Finally, we develop a GPC2-directed antibody-drug conjugate that is potently cytotoxic to GPC2-expressing neuroblastoma cells. Collectively, these findings validate GPC2 as a non-mutated neuroblastoma oncoprotein and candidate immunotherapeutic target.

Keywords: MYCN; antibody-drug conjugate; glypican; immunotherapy; medulloblastoma; neuroblastoma.


Figures

Figure 1
Figure 1. Identification of GPC2 as a differentially expressed cell surface molecule in high-risk neuroblastoma
(A) Prioritization pipeline for identification of differentially expressed cell surface proteins in high-risk neuroblastoma. (B) Plot displaying identification of 33 differentially expressed genes encoding cell surface proteins in high-risk neuroblastoma. GPC2 indicated with black circle. (C) Plot displaying GPC2 expression in high-risk neuroblastoma (n = 126) compared to normal tissue RNA sequencing data profiled via the GTEx consortium (n = 7,859 samples across 31 unique normal tissues, n = 5 - 1,152 samples per tissue). Box plots extend from the first to the third-quartile, the horizontal line is the median, and the error bars represent the 1.5 interquartile range from the first-and third-quartile. n for each tissue indicated in parentheses. LogFC, log fold-change. See also Figures S1 and S2.
Figure 2
Figure 2. Mechanisms of increased GPC2 expression in neuroblastoma
(A) GPC2 expression in two neuroblastoma tumor data sets stratified by chromosome 7q/GPC2 locus gain and MYCN amplification status (left, RNA sequencing, n = 64; right, mRNA microarray, n = 118; TARGET). (B) MYCN ChIP plot showing MYCN binds an Ebox motif upstream of the GPC2 promoter in the MYCN amplified neuroblastoma cell lines Kelly, NGP, and NB-1643. Arrow head indicates location of Ebox motif (CACGTG). (C) GPC2 reporter assay with and without forced overexpression of MYCN in SHEPneuroblastoma and HEK293T cells. Inset with Western blot displaying MYCN overexpression incorresponding cells. (D) GPC2 quantitative PCR in 4-oHT MYCN inducible SKNAS neuroblastoma cells (SKNAS-NmycER) ± 4-OHT. (E) MYCN/GPC2 quantitative PCR in the MYCN amplified neuroblastoma cell line Kelly after MYCN depletion with 2 unique shRNAs, shMYCN-5 and 6. (F) Western blot of MYCN and GPC2 in the MYCN amplified neuroblastoma cell lines Kelly and NGP after MYCN depletion with an expanded set of 4 unique shRNAs, shMYCN-1, 5, 6 and 7. Horizontal lines in A indicate mean ± SEM. Data in C are represented as mean ± SEM of at least 3 biological replicates. Data in D and E are represented as mean ± SEM of one experiment. Each experiment was repeated 2-4 times with similar results. *p < 0.05; **p < 0.01; ***p < 0.0001; ns, not significant were derived via unpaired t tests. Amp, amplification; Empty, pLenti CMV Puro empty vector; MYCN, MYCN pLenti CMV Puro vector; hr, hour. shNTC, non-targeting control shRNA.
Figure 3
Figure 3. GPC2 is expressed in most neuroblastomas and is plasma membrane localized
(A-C) Western blots of GPC2 in a panel of neuroblastoma primary tumors (n = 11; A), PDXs (n = 12; B) and cell lines (n = 24; C). (D) GPC2 IHC staining of neuroblastoma cell lines (high GPC2 expression - SMS-SAN,moderate - NBLS, and very low - RPE1). (E) GPC2 flow cytometry analysis of a panel of cell lines (high GPC2 expression - SMS-SAN,NBSD, Kelly GPC2, low – Kelly Empty, and very low - RPE1, HEK293T, and CHo-K1). Greyplot represents secondary only staining and colored plots represent staining with D3-GPC2-scFv-FLAG. (F) Western blot of GPC2 following differential membrane extraction experiments in a panel of neuroblastoma cell lines (n = 7). Western blot of Na, K-ATPase protein also shown as a positive plasma membrane control. (G) GPC2 immunofluorescence staining in the neuroblastoma cell lines NB-EBC1 and SMS-SAN. Green, GPC2; Red, pan cadherin membrane staining control; Blue, DAPI; Bottom right, merged figure. (H) Summary of membrane staining H-score of GPC2 IHC of neuroblastoma PDX and primary tumor TMAs. (I) Representative membrane staining H-score examples (H-score displayed in lower right corner). Scale bars represent 30 μM (D), 10 μM (G), 60 μM (I) HR, high-risk; IR, intermediate risk; S, soluble (non-membrane) protein extract; M, membrane protein extract. See also Figure S3; Table S1.
Figure 4
Figure 4. Restricted normal tissue expression of GPC2 and alternative GPC2 transcript expression
(A) Summary of GPC2 membrane staining H-scores from a pediatric normal tissue array (total n = 36 unique normal tissues, n of each organ system or individual tissue indicated on X-axis). Summary of GPC2 membrane H-scores from neuroblastoma primary tumors/PDXs shown for comparison. (B) RNA transcript specific analysis of GPC2 expression in primary neuroblastomas and the low-level GPC2 expressing normal tissues skin and esophagus (n = 126 high-risk neuroblastomas, TARGET; n = 201 esophagus samples and 684 skin samples, GTEx). Data in A represent means ± SEM. Box plots in B extend from the first to the third-quartile, the horizontal line is the median, “+” represents the mean and the error bars represent the 1.5 interquartile range from the first-and third-quartile. CV, cardiovascular; GI, gastrointestinal; GU, genitourinary. See also Figure S4; Table S2.
Figure 5
Figure 5. GPC2 is required for neuroblastoma cell growth
(A) GPC2 quantitative PCR following lentiviral transduction of 2 unique shRNA constructs targeting GPC2 exon 4 and the GPC2 3′ UTR in the neuroblastoma cell line NB-EBC1. (B) Top, GPC2 Western blot analysis of samples in (A). Bottom, Western blot of cleaved PARP and caspase 3 after GPC2 depletion in NB-EBC1. Positive GPC2 Western blot control (SKNDZ) was run on the same blot as 120/168 hour NB-EBC1 time points. (C) Caspase 3/7 activity measured after GPC2 depletion in NB-EBC1. (D-F) NB-EBC1 cell growth following GPC2 depletion shown by CellTiter-Glo® assay (D), RT-CES (E), and colony formation assay (F). (G) Plot of cell growth measured by CellTiter-Glo® assay and caspase 3/7 activity following GPC2 depletion with 2 unique shRNA constructs targeting GPC2 exon 4 (top) and the GPC2 3′ UTR (bottom) across an extended panel of neuroblastoma cell lines (n = 10 + NB-EBC1). r, Pearson correlation coefficient and p values shown for each GPC2 shRNA. (H) Neuroblastoma cell growth after forced GPC2 overexpression in Kelly and SKNDZ. Western blot of GPC2 overexpression in Kelly is shown on left and for SKNDZ cells is shown in B. Data in A, C, D are represented as mean ± SEM. Data in E and H are represented as means of at least a triplicate plating. Data in G are means of 2 separate biological replicates plated in triplicate. Each experiment was done 2-3 independent times with similar results. *p < 0.0001; **p < 0.001 derived via unpaired t tests. NTC, non-targeting shRNA control; Ex 4, GPC2 Exon 4 targeting shRNA; 3′ UTR, GPC2 3′ UTR targeting shRNA; Empty, empty pLenti CMV Puro vector; GPC2, GPC2 pLenti CMV Puro vector; hr, hours. See also Figure S5.
Figure 6
Figure 6. GPC2 is expressed in other high-risk neural-derived embryonal cancers
(A) GPC2 RNA sequencing data of medulloblastomas stratified by clinical grouping (n = 95; left) and amplification status at chromosome 7q/GPC2, MYC and MYCN loci (n = 71; right). n indicates number of tumors in each group. Tumor with focal GPC2 locus gain colored in red. (B) mRNA transcript specific analysis of GPC2 in primary medulloblastomas (n = 96). (C) Summary of GPC2 membrane staining H-scores of medulloblastoma TMA (n = 63). (D) Representative membrane staining H-score examples from medulloblastoma TMA (H-score displayed in lower right). (E) GPC2 IHC staining in a human metastatic medulloblastoma xenograft murine model, withhigher power images of GPC2 staining central nervous system (left), spinal (top right), and livermetastases (bottom right). (F) GPC2 and MYCN IHC staining of three retinoblastomas. GPC2 membrane staining H-scoreshown in lower right and MYCN copy number shown in upper right corners. Mean in A indicated by horizontal line ± SEM. Box plots in B extend from the first to the third-quartile, the horizontal line is the median, “+” represents the mean and the error bars represent the 1.5 interquartile range from the first-and third-quartile. Scale bars in D, E (top and right), and F represent 60 μM, E (left) represents 5 μM, E (top middle; spinal cord) represents 500 μM and D (bottom middle; liver) represents 300 μM. ***p < 0.0001 derived via unpaired t test. ns, not significant; Del, deletion; Rb, retinoblastoma. See also Figure S6; Table S3.
Figure 7
Figure 7. A GPC2 targeting ADC is cytotoxic to GPC2 expressing neuroblastoma cells
(A) Internalization of D3-GPC2-IgG1 in SMS-SAN and HEK293T GPC2 cells shown as fold-change from baseline (left; 30 minutes) and percent of D3-GPC2-IgG1 internalized (right). (B) Plot showing D3-GPC2-IgG1 binding to human and mouse GPC2 but not to human GPC1 and GPC3 via ELISA. (C) Schematic of D3-GPC2-PBD ADC. (D) Growth plots of endogenous GPC2 expressing neuroblastoma cells (left) and GPC2 isogenic Kelly and HEK293T cells (right) treated with different concentrations of D3-GPC2-PBD. (E) Summary of IC50 values and semi-quantitative flow cytometry analysis (ABC) with D3-GPC2-IgG1 of the cell lines treated with D3-GPC2-PBD in D. (F) RT-CES growth plot of GPC2 expressing SMS-SAN cells treated with 200 pM of D3-GPC2-PBD and increasing amounts of D3-GPC2-IgG1 (0× to 100×). (G) Fold-change caspase 3/7 activity 96 hours after treatment with D3-GPC2-PBD in 7 cell lines with differential GPC2 expression. (H) Western blot of SMS-SAN cells 72 hours after treatment with D3-GPC2-PBD (1.6, 8, 40, and 200 pm and 1 nm). (I) NB-1643 patient-derived xenograft (PDX) tumor volumes after treatment with D3-GPC2-IgG1 or D3-GPC2-PBD (n = 8-9 mice per treatment arm). (J) GPC2 IHC of NB-1643 PDX. (K) Kaplan-Meier survival analysis of NB-1643 treatment arms in I. (L) Mean percent body weights from baseline of mice in the NB-1643 PDX treatment arms shown in I. *, indicates parental cell lines with a TP53 mutation. Scale bars in J represents 2 μM (left) and 60 μM (right). Data in A, B, D, E, and G are represented as mean ± SEM and data in F is represented as a mean. Each experiment was done 2-3 independent times with similar results. Data in I and L represent mean ± SEM for each treatment arm (n = 8-9 mice). RT-CES, Real-time cell electronic sensing; ABC, Antibody Binding Capacity; GlcNAc, N-Acetylglucosamine; GalNAz, N-azidoacetylgalactosamine tetraacylated; DBCO, dibenzocyclooctyne; PEG4, polyethylene glycol 4; Val-Ala, valine-alanine; PBD, pyrrolobenzodiazepine, Ab, antibody; Hu, human; Mo, mouse; 293T, HEK293T cells. See also Figures S7, S8; Table S4.

Comment in

References

    1. Bosse KR, Maris JM. Advances in the translational genomics of neuroblastoma: From improving risk stratification and revealing novel biology to identifying actionable genomic alterations. Cancer. 2016;122:20–33. - PMC - PubMed
    1. Campeau E, Ruhl VE, Rodier F, Smith CL, Rahmberg BL, Fuss JO, Campisi J, Yaswen P, Cooper PK, Kaufman PD. A versatile viral system for expression and depletion of proteins in mammalian cells. PLoS one. 2009;4:e6529. - PMC - PubMed
    1. Carpenter EL, Haglund EA, Mace EM, Deng D, Martinez D, Wood AC, Chow AK, Weiser DA, Belcastro LT, Winter C, et al. Antibody targeting of anaplastic lymphoma kinase induces cytotoxicity of human neuroblastoma. Oncogene. 2012;31:4859–4867. - PMC - PubMed
    1. Casucci M, Nicolis di Robilant B, Falcone L, Camisa B, Norelli M, Genovese P, Gentner B, Gullotta F, Ponzoni M, Bernardi M, et al. CD44v6-targeted T cells mediate potent antitumor effects against acute myeloid leukemia and multiple myeloma. Blood. 2013;122:3461–3472. - PubMed
    1. Dobin A, Davis CA, Schlesinger F, Drenkow J, Zaleski C, Jha S, Batut P, Chaisson M, Gingeras TR. STAR: ultrafast universal RNA-seq aligner. Bioinformatics. 2013;29:15–21. - PMC - PubMed

Publication types

MeSH terms