. 2017 Sep 11;32(3):342-359.e10.
doi: 10.1016/j.ccell.2017.08.010.

A Dual Role of Caspase-8 in Triggering and Sensing Proliferation-Associated DNA Damage, a Key Determinant of Liver Cancer Development

Affiliations

A Dual Role of Caspase-8 in Triggering and Sensing Proliferation-Associated DNA Damage, a Key Determinant of Liver Cancer Development

Yannick Boege et al. Cancer Cell. .

Abstract

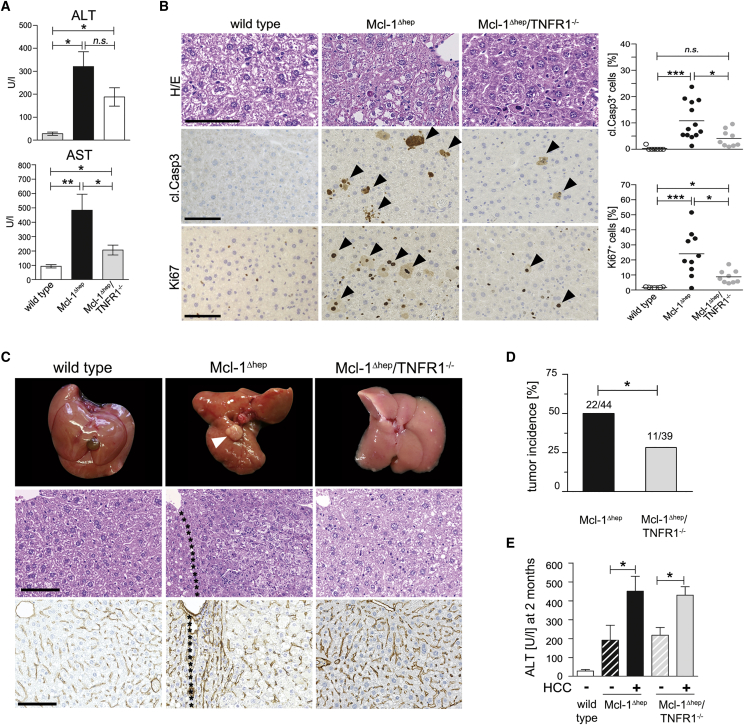
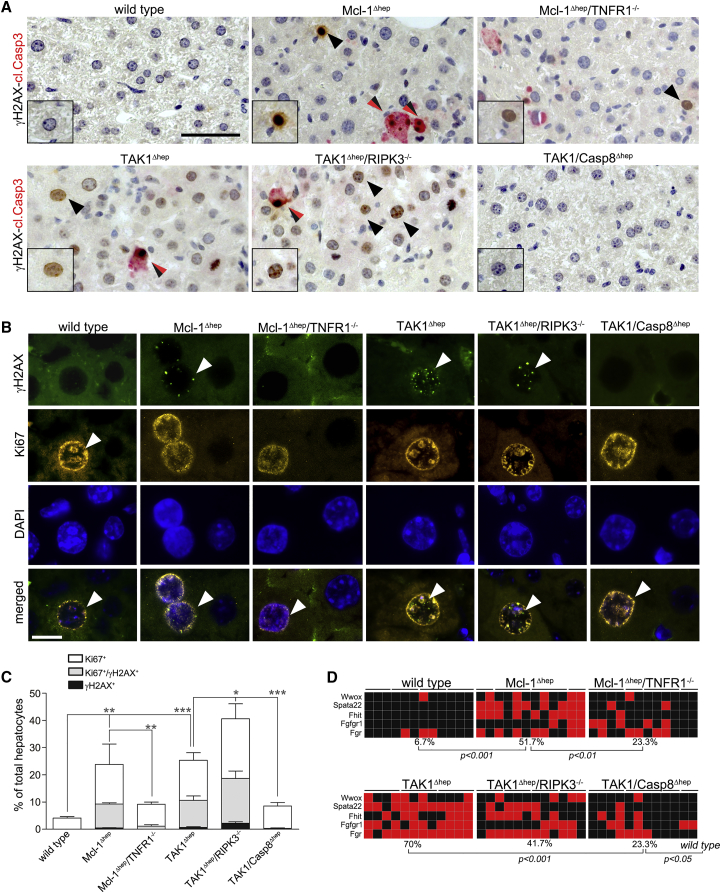
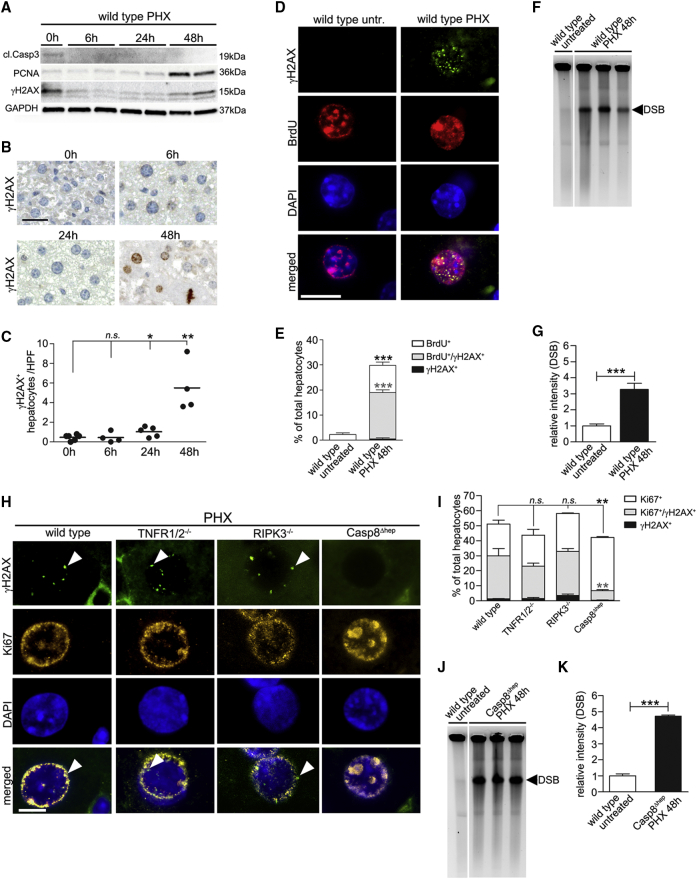
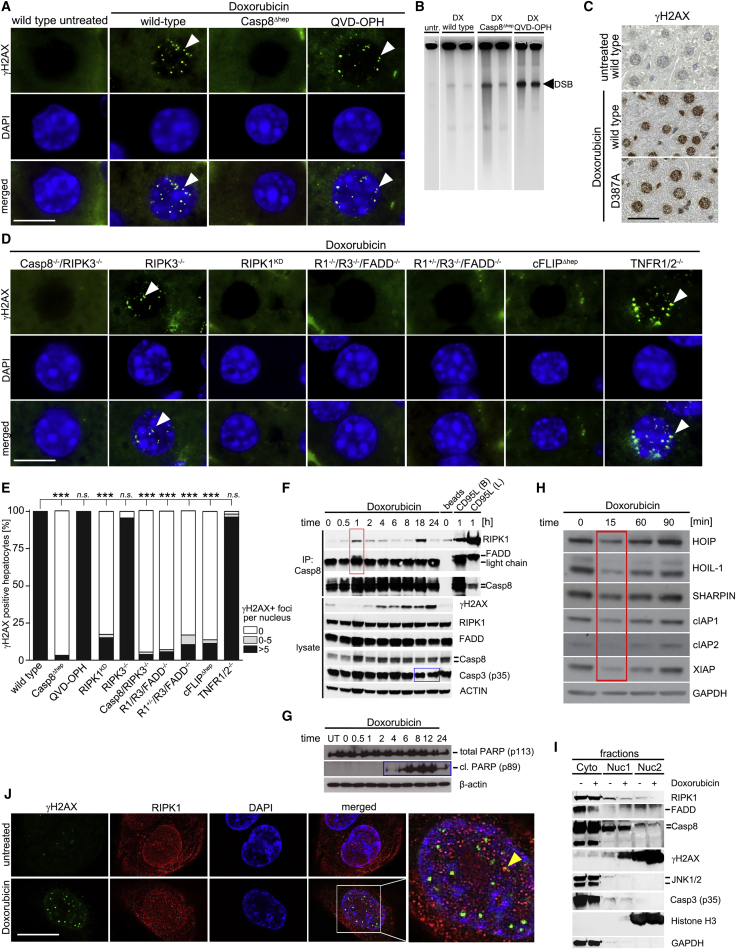
Concomitant hepatocyte apoptosis and regeneration is a hallmark of chronic liver diseases (CLDs) predisposing to hepatocellular carcinoma (HCC). Here, we mechanistically link caspase-8-dependent apoptosis to HCC development via proliferation- and replication-associated DNA damage. Proliferation-associated replication stress, DNA damage, and genetic instability are detectable in CLDs before any neoplastic changes occur. Accumulated levels of hepatocyte apoptosis determine and predict subsequent hepatocarcinogenesis. Proliferation-associated DNA damage is sensed by a complex comprising caspase-8, FADD, c-FLIP, and a kinase-dependent function of RIPK1. This platform requires a non-apoptotic function of caspase-8, but no caspase-3 or caspase-8 cleavage. It may represent a DNA damage-sensing mechanism in hepatocytes that can act via JNK and subsequent phosphorylation of the histone variant H2AX.

Keywords: DNA damage response; apoptosis; hepatocellular carcinoma; liver; replication stress.


Figures

Figure 1
Figure 1
DNA Damage and Genetic Instability CLDs Preceding Neoplastic Lesions and HCC (A) Apoptosis (cl.Casp3), proliferation (Ki67), and DNA damage (γH2AX) in human CLDs of different etiology (viral hepatitis: hepatitis B virus [HBV] and [HCV], metabolic [NASH], and autoimmune [AIH] diseases). Arrowheads indicate cells with positive IHC staining. Scale bars, 100 μm. (B) TaqMan copy number assay for allelic imbalances (AI). Each square represents one area of microdissected tissue, lines indicate different areas of the same liver (red, AI; black, no AI; NT, non-tumor CLD tissue). (C) Fragment length analysis (loci DS31263 and DS31289) in CLD tissues. Arrowheads indicate changes in fragment length distribution. (D) Serum ALT levels in CLDs (n = 4 HBV, n = 8 HCV, n = 4 NASH, and n = 4 AIH). (E and F) Serum ALT levels in patients with HCC versus without HCC of the same cohort (n = 13 in both groups). (E) Time course 6 years prior to diagnosis and (F) mean of ALT values over time. In (D), (E), and (F), data are presented as mean ± SEM. Statistical significance was calculated using Fisher's exact test (B), ANOVA with Bonferroni correction (D), or Student's t test (E and F). p < 0.05; ∗∗p < 0.01; ∗∗∗p < 0.001. See also Figure S1.
Figure 2
Figure 2
Risk of HCC Development Correlates with Apoptosis and DNA Damage in Mcl-1Δhep Mice (A) Livers from 12-month-old mice. Arrowheads indicate a tumor. Scale bar, 1 cm. (B) Serum ALT levels throughout life time of wild-type mice, Mcl-1Δhep mice that developed HCC at 12 months (n = 12), and Mcl-1Δhep mice that did not. (C) Serum ALT levels at 2 months (n = 8 animals per group). (D) Hepatocyte death rates (n = 20). (E) Correlation of ALT levels with hepatocytes apoptosis (n = 15). (F) Hepatocyte mitosis (upper square and insert), apoptosis (lower square and insert), and signs of DNA damage (γH2AX, black arrow) in livers of Mcl-1Δhep mice. Scale bars, 50 μm. (G) γH2AX+ hepatocytes per high-power field (HPF) in wild-type (n = 7) and Mcl-1Δhep mice (n = 12). (H) Correlation of ALT levels with the number of γH2AX+ hepatocytes (n = 11). (I) Pie chart displaying the percentage of genes at least 2-fold upregulated in Mcl-1Δhep mice and clustered according to KEGG pathway database analysis. (J) Gene set enrichment analysis comparing all differentially regulated genes from Mcl-1Δhep mice with various gene sets. NES, normalized enrichment score. In (B) and (C), data are presented as mean ± SEM. In (G), the bar indicates the mean. Statistical significance was calculated using Student's t test (B and G), ANOVA with Bonferroni correction (C). p < 0.05. See also Figure S2.
Figure 3
Figure 3
Reduced Apoptosis, Proliferation, and Tumor Development in Mcl-1Δhep/TNFR1−/− Mice (A) AST and ALT levels from 2-month-old Mcl-1Δhep (n = 16), Mcl-1/TNFR1−/− (n = 10), and wild-type (n = 8) mice. (B) Staining and quantification for H&E, cl.Casp3, and Ki67 in 2-month-old wild-type, Mcl-1Δhep/TNFR1−/−, and Mcl-1Δhep mice. Arrowheads indicate cells with positive IHC staining. Scale bars, 100 μm. (C) Macroscopy, H&E, and collagen IV staining of livers at 12 months of age. The arrowhead indicates a tumor. Scale bars, 100 μm. (D) Tumor development after 12 months in Mcl-1Δhep mice (n = 44) compared with Mcl-1Δhep/TNFR1−/− mice (n = 39). (E) Retrospective analysis of tumor development and correlation to ALT levels in the serum of 2-month-old mice (n = 11 Mcl-1Δhep/TNFR1−/− mice without HCC, n = 5 with HCC). In (A), (B), (D), and (E), data are presented as mean ± SEM. Statistical significance was calculated using Student's t test (A and B), ANOVA with Bonferroni correction (E), or Fisher's exact test (D). p < 0.05; ∗∗p < 0.01; ∗∗∗p < 0.001; n.s., not significant. See also Figures S3 and S4.
Figure 4
Figure 4
Reduced DNA Damage And Genetic Instability in Mcl-1Δhep/TNFR1−/− and TAK1/Casp8Δhep Mice and Intercrossings (A) Staining for γH2AX (black) and cleaved Casp3 (red), double-positive hepatocytes (black/red arrows). Scale bar, 50 μm. (B) IF staining for γH2AX and Ki67 in wild-type, Mcl-1Δhep, and Mcl-1Δhep/TNFR1−/− mice, as well as TAK1Δhep, TAK1/Casp8Δhep, and TAK1Δhep/RIPK3−/− mice. Arrowheads indicate cells with positive IF staining. Scale bar, 10 μm. (C) Quantification of Ki67+ and Ki67+/γH2AX+ hepatocytes (n = 4 mice per group, n = 5 for Mcl-1Δhep mice). (D) Rate of AI in wild-type, Mcl-1Δhep, and Mcl-1Δhep/TNFR1−/− mice, TAK1Δhep, TAK1Δhep/RIPK3−/−, and TAK1/Casp8Δhep mice (TaqMan copy number assay, each square represents one area of microdissected liver tissue, lines indicate different areas of the same liver; red, AI; black, no AI). Mcl-1Δhep mice and intercrossings at 2 months; TAK1Δhep mice and intercrossings at 6 weeks of age. In (C), data are presented as mean ± SEM. Statistical significance was calculated using ANOVA with Bonferroni correction (C), or Fisher's exact test (D). p < 0.05; ∗∗p < 0.01; ∗∗∗p < 0.001. See also Figure S5.
Figure 5
Figure 5
Detection of Proliferation-Associated DNA Damage after PHX Is Impaired in Casp8Δhep Mice (A–C) Western blot analysis of whole-liver lysates (A), immunostainings (B), and quantification of γH2AX+ hepatocytes 0, 6, 24, and 48 hr post-PHX (C). Scale bar, 50 μm. (D and E) BrdU incorporation combined with γH2AX staining (n = 4). Scale bar, 10 μm. (F and G) PFGE with densitometric quantification to visualize DNA DSB in livers of wild-type mice after PHX (n = 3). (H and I) IF staining (H) and quantification of Ki67+/γH2AX+ hepatocytes in wild-type, TNFR1/2−/−, RIPK3−/−, and Casp8Δhep mice (I). Arrowheads indicate cells with positive IF staining. Scale bar, 10 μm. (J and K) PFGE with densitometric quantification to visualize DNA DSB in livers of Casp8Δhep mice after PHX. In (C), bar represents mean. In (E), (G), (I), and (K) data are presented as mean ± SEM. In (G), bar indicates the mean. Statistical significance was calculated using ANOVA with Bonferroni correction (C and I) or Student's t test (E, G, and K). p < 0.05; ∗∗p < 0.01; ∗∗∗p < 0.001; n.s., not significant. Irrelevant bands were omitted from gels (F and J). Areas in which lanes were omitted are indicated by white space between lanes. See also Figure S6.
Figure 6
Figure 6
Caspase-8, RIPK1, FADD, and c-FLIP Are Crucial for Phosphorylation of H2AX in Hepatocytes upon Doxorubicin Treatment (A) IF for γH2AX in untreated wild-type mice and wild-type, Casp8Δhep, and QVD-OPH-treated wild-type mice following doxorubicin treatment. Arrow heads illustrate γH2AX+ foci in nuclei. Scale bar, 10 μm. (B) PFGE on livers of doxorubicin-treated mice. (C) γH2AX staining of doxorubicin-treated wild-type and caspase-8 D387-mutant mice. Scale bar, 50 μm. (D) γH2AX IF staining 12 hr post-doxorubicin-induced DNA damage in hepatocytes of Casp8−/−/RIPK3−/− mice (n = 5), RIPK3−/− mice (n = 4), RIPK1KD mice (n = 9), RIPK1−/−RIPK3−/−FADD−/− (labeled as R1−/−R3−/−FADD−/−, n = 2), RIPK1+/−RIPK3−/−FADD−/− (labeled as R1+/−R3−/−FADD−/−, n = 2), c-FLIPΔhep (n = 6), and TNFR1/2−/− mice (n = 6). Arrowheads illustrate γH2AX+ foci in nuclei. Scale bar, 10 μm. (E) Quantification of IF stainings (A and D). (F) Immunoprecipitation with anti-caspase-8 antibody (upper panel) and immunoblotting of lysates (lower panel), 0–24 hr after doxorubicin (5 μM) treatment. Red box: RIPK1, FADD, and caspase-8 interaction at 1 hr; blue boxes: low-level activation of apoptosis starting at 4 hr post-treatment. (The signal visible in the t = 0 column, cl.PARP lane, does not originate from cl.PARP, but from a lower unspecific band.) Control cells treated for 1 hr with CD95L/FasL (B, beads; L, lysates). (G) Immunoblotting of lysates, 0–24 hr after doxorubicin (5 μM) treatment looking at levels of total and cl.PARP, blue boxes (F and G): low-level activation of apoptosis starting at 4 hr post-treatment. (H) Levels of LUBAC (HOIP, HOIL-1, and SHARPIN), cIAP1, cIAP2, and XIAP in U2OS cells at 15 min (red box) post-doxorubicin stimulation (5 μM). (I) Subcellular fractionation of U2OS cells. (J) RIPK1 and γH2AX IF staining in U2OS cells after doxorubicin treatment. The arrowhead indicates colocalizing signals. Scale bar, 10 μm. Statistical significance was calculated using ANOVA with Bonferroni correction (E). ∗∗∗p < 0.001. Irrelevant bands were omitted from gels (B). Areas in which lanes were omitted are indicated by white space between lanes. See also Figure S7.
Figure 7
Figure 7
JNK Is a Downstream Mediator of Caspase-8-, c-FLIP-, and RIPK1-Dependent Phosphorylation of H2AX In Vivo and In Vitro (A) Immunohistochemistry for pCHK1, pCHK2, and pcJUN in livers after doxorubicin treatment. Arrowheads indicate pcJUN-positive nuclei. Scale bar, 50 μm. (B) γH2AX and pJNK co-stainings of livers 12 hr post-doxorubicin treatment. Merged: overlay of DAPI, γH2AX, and pJNK staining. Arrowheads indicate IF signals for γH2AX (green), pJNK (red), or overlapping signals of both (yellow). Scale bar, 10 μm. (C and D) IF stainings (C) and quantification for γH2AX in wild-type and JNK1/2-deficient hepatocytes 12 hr post-doxorubicin treatment (D). Arrowheads indicate IF signals for γH2AX. Scale bar, 10 μm. (E) Analysis of DDR signaling by western blotting of lysates from doxorubicin-treated caspase-8 knockdown cells, JNK inhibitor (SP600125) and ATM inhibitor (KU-55933) pre-treated control cells (U2OS). Red boxes: differences in γH2AX and pJNK activation post-doxorubicin treatment between control cells and lentiviral caspase-8 knockdown and JNK inhibitor treated cells. Statistical analysis was corrected for three tests using the Bonferroni method. See also Figure S8.
Figure 8
Figure 8
Evidence for JNK-Dependent DDR in Human Regenerating Livers and Caspase-8 in Human HCC (A) γH2AX and pJNK co-stainings demonstrating JNK-dependent phosphorylation of H2AX in liver tissue of CLD patients or the left lobe of patients after (right) portal vein ligation and liver transection (PVL/LT). Arrowheads indicate IF signals for γH2AX (green), pJNK (red), or overlapping signals of both (yellow). Scale bar, 10 μm. (B) Overall survival of HCC patients depending on HCC caspase-8 expression level (mean+1SD; n = 51 patients, log rank test, statistical analysis was corrected for three tests using the Bonferroni method. The Cancer Genome Atlas [TCGA] cohort). (C) Overall survival of HCC patients depending on HCC caspase-8 methylation status (n = 358 patients, TCGA cohort, log rank test).

References

    1. Affo S., Dominguez M., Lozano J.J., Sancho-Bru P., Rodrigo-Torres D., Morales-Ibanez O., Moreno M., Millan C., Loaeza-del-Castillo A., Altamirano J. Transcriptome analysis identifies TNF superfamily receptors as potential therapeutic targets in alcoholic hepatitis. Gut. 2013;62:452–460. - PMC - PubMed
    1. Alexiades M.R., Cepko C. Quantitative analysis of proliferation and cell cycle length during development of the rat retina. Dev. Dyn. 1996;205:293–307. - PubMed
    1. Ando K., Kernan J.L., Liu P.H., Sanda T., Logette E., Tschopp J., Look A.T., Wang J., Bouchier-Hayes L., Sidi S. PIDD death-domain phosphorylation by ATM controls prodeath versus prosurvival PIDDosome signaling. Mol. Cell. 2012;47:681–693. - PMC - PubMed
    1. Batts K.P., Ludwig J. Chronic hepatitis. An update on terminology and reporting. Am. J. Surg. Pathol. 1995;19:1409–1417. - PubMed
    1. Bettermann K., Vucur M., Haybaeck J., Koppe C., Janssen J., Heymann F., Weber A., Weiskirchen R., Liedtke C., Gassler N. TAK1 suppresses a NEMO-dependent but NF-kappaB-independent pathway to liver cancer. Cancer Cell. 2010;17:481–496. - PubMed

Publication types

MeSH terms

Substances