. 2017 Sep 11;32(3):377-391.e9.
doi: 10.1016/j.ccell.2017.08.004.

Enhancing CD8+ T Cell Fatty Acid Catabolism within a Metabolically Challenging Tumor Microenvironment Increases the Efficacy of Melanoma Immunotherapy

Affiliations

Enhancing CD8+ T Cell Fatty Acid Catabolism within a Metabolically Challenging Tumor Microenvironment Increases the Efficacy of Melanoma Immunotherapy

Ying Zhang et al. Cancer Cell. .

Abstract

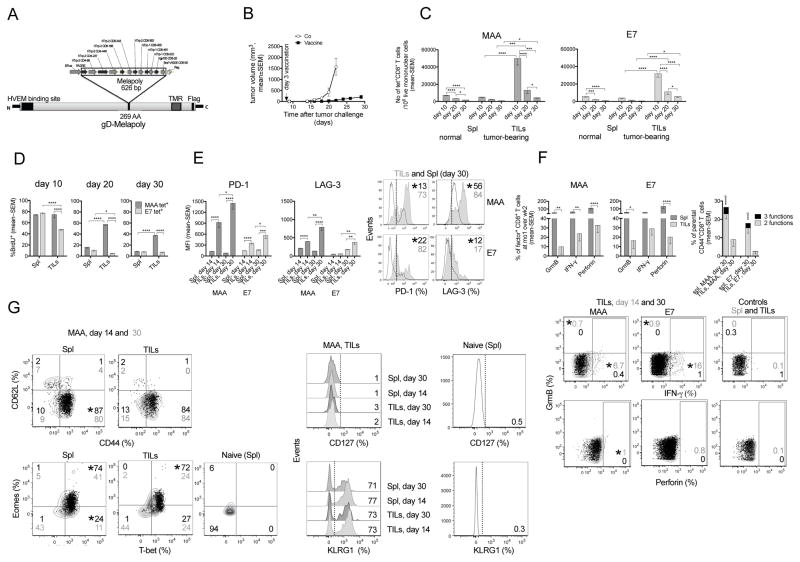
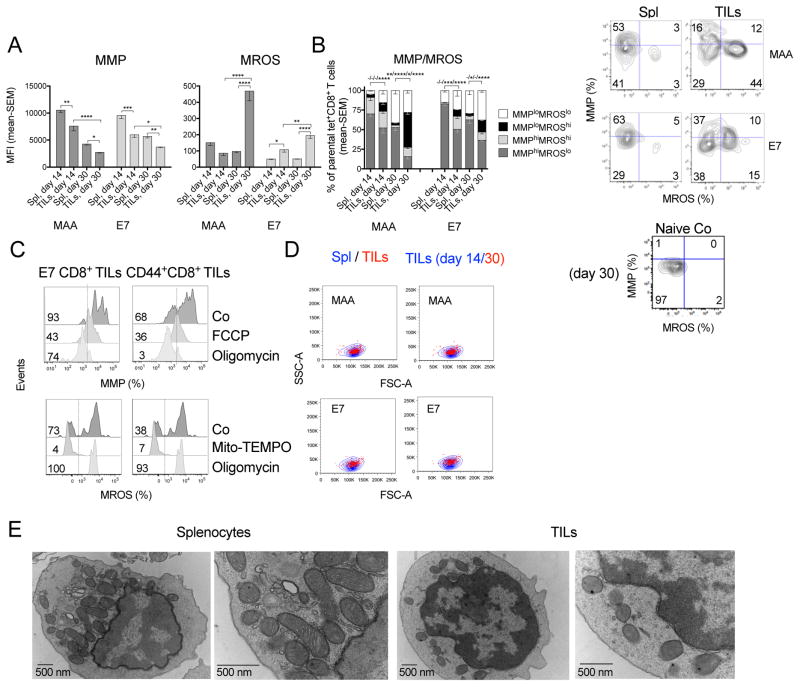
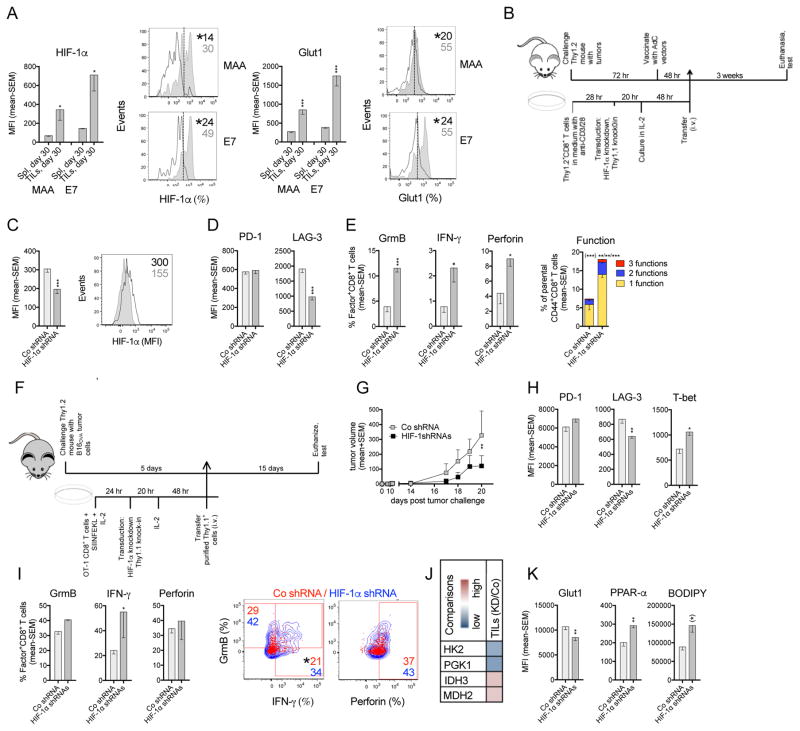
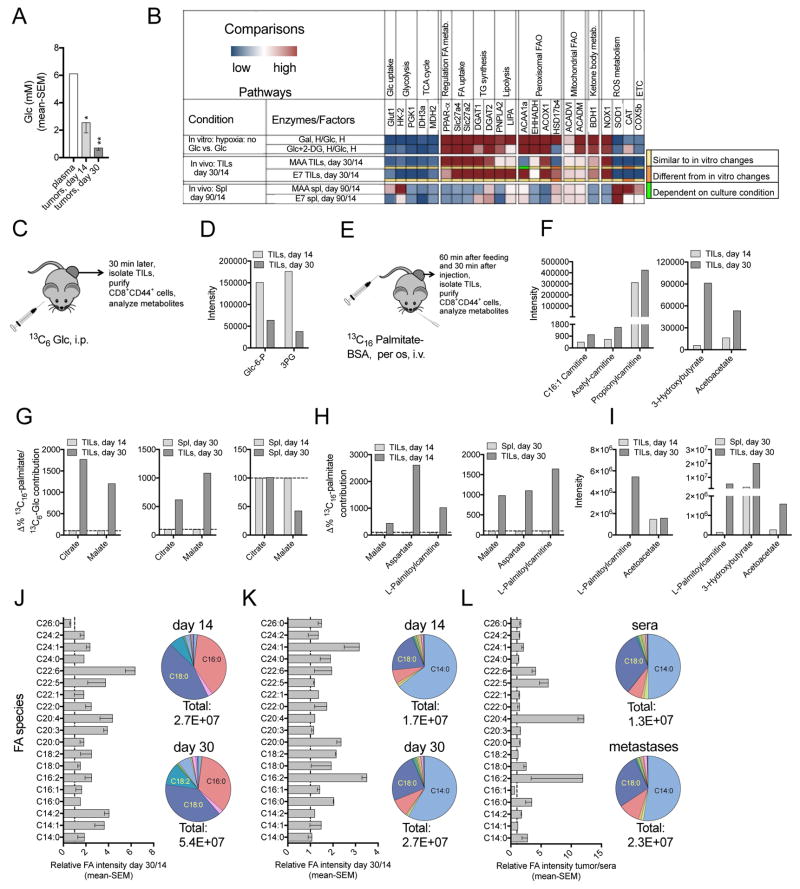
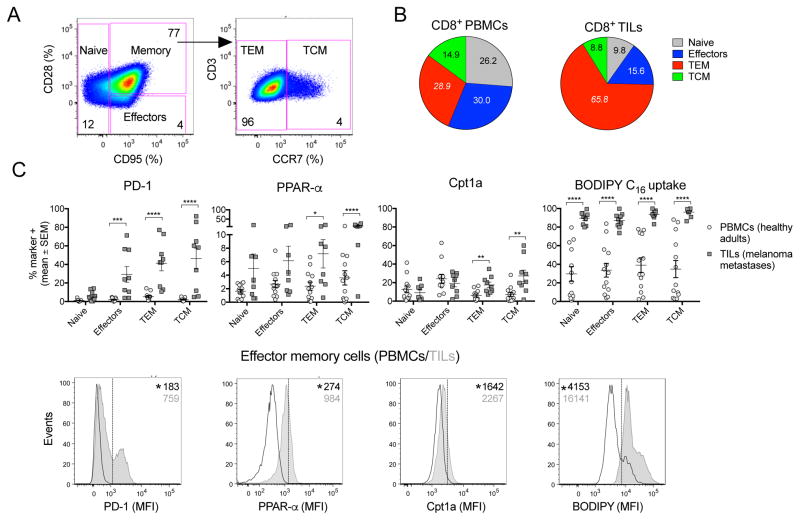
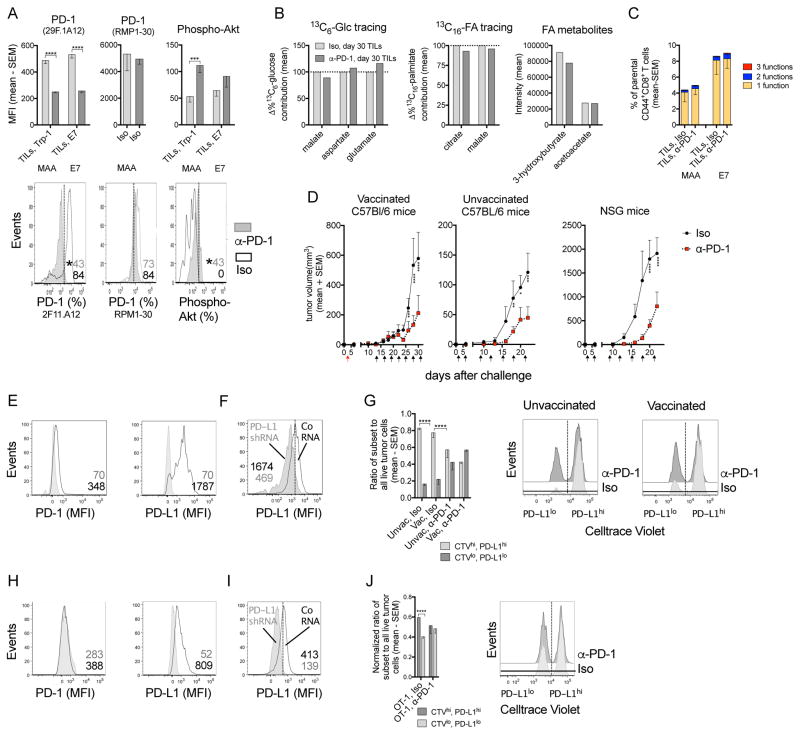
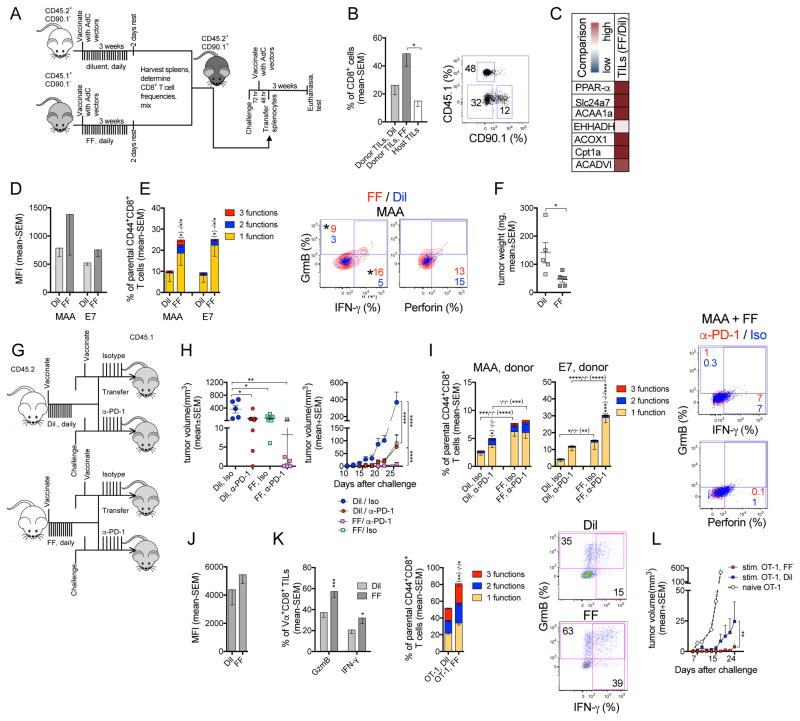
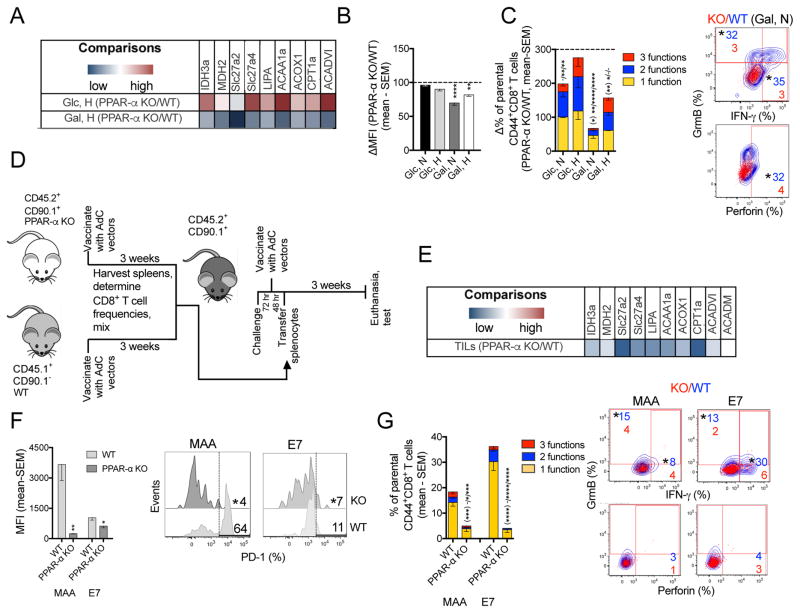
How tumor-infiltrating T lymphocytes (TILs) adapt to the metabolic constrains within the tumor microenvironment (TME) and to what degree this affects their ability to combat tumor progression remain poorly understood. Using mouse melanoma models, we report that CD8+ TILs enhance peroxisome proliferator-activated receptor (PPAR)-α signaling and catabolism of fatty acids (FAs) when simultaneously subjected to hypoglycemia and hypoxia. This metabolic switch partially preserves CD8+ TILs' effector functions, although co-inhibitor expression increases during tumor progression regardless of CD8+ TILs' antigen specificity. Further promoting FA catabolism improves the CD8+ TILs' ability to slow tumor progression. PD-1 blockade delays tumor growth without changing TIL metabolism or functions. It synergizes with metabolic reprogramming of T cells to achieve superior antitumor efficacy and even complete cures.

Keywords: CD8(+) T cells; HIF-1α; TILs; co-inhibitors; fatty acid catabolism; fenofibrate; hypoglycemia; hypoxia; melanoma; tumor microenvironment.


Figures

Fig 1
Fig 1. CD8+ TILs become functionally impaired
(A) AdC68-gDMelapoly transgene. (B) B16BrafV600E tumor growth curves (Co [AdC68-gD], n=6; Vaccine, n=18). (C) Numbers of Trp-1 (MAA)- and E7-tetramer (tet)+CD8+ T cells/106 live mononuclear cells in spleens (Spl) and tumors of mice that had or had not been received tumor cells before vaccination (n=10/group). (D) % BrdU incorporation into antigen-specific CD8+ T cells from Spl and tumors. (E) Mean fluorescent intensity (MFI) and histograms for PD-1 and LAG-3 on CD8+ T cells from Spl (open histogram) and tumors (grey histogram) at 14 or 30 days after tumor challenge. (F) Left: Relative % antigen-specific CD8+ T cells from Spl and tumors producing GrmB, perforin or IFN-γ comparing day 30 to 14 samples. Right: % specific CD8+ T cells at day 30 from Spl or tumors producing 3 or 2 of the tested functions. The same functions are displayed throughout the manuscript unless indicated otherwise. * bottom to top: significant differences in 2 and 3 functions. Bottom: flow plot showing TIL functions: day 14 (grey) vs. 30 (black) overlays; control: Spl and TILs stimulated with irrelevant peptide. (G) Differentiation markers on MAA-specific T cells from Spl and tumors: as day 14 (black) vs. 30 (grey) overlays (left) or histograms (right). Gating control: Naive CD8+ T cells. (E–G) Numbers in plots: average % marker+ cells for the entire group; stars next to top number indicate significant differences between groups. This applies to all flow plots in the manuscript. (D–G) n=5/group. Data show mean with SEM. Data represent 2 (B, D, F, G) or 3 assays (C, E). For all figures, *p ≤0.05 – 0.01, ** p≤0.01–0.001, *** p ≤0.001–0.0001, **** p≤0.0001. See also Figure S1.
Figure 2
Figure 2. CD8+ TILs increasingly experience metabolic stress
(A) MFI of MMP and MROS in specific CD8+ T cells from Spl and tumors. (B) Left: MMP over MROS of CD8+ T cells from Spl and tumors. (−) not significant or (*) significant differences left to right are for populations from top to bottom in legend. Right: flow plots of specific T cells from day 30 tissues and naive T cells (Co). (C) Controls for DioC6 and Mitosox Red stains on CD8+ TILs. CD44+CD8+ TILs and E7-specific CD8+ TILs were treated with FCCP or oligomycin to collapse the MMP; with Mito-TEMPO to reduce MROS, or with oligomycin to induce MROS. (D) MAA- or E7-specific CD8+ T cell size comparison between those from Spl and tumors isolated from mice bearing day 14 or 30 tumors. Representative flow plots show cell subsets overlay upon gating on FSC over SSC. (E) Transmission electron micrographs of CD44+CD8+ T cells from day 30 Spl and tumors. Samples pooled from 15 mice. Data show mean - SEM; representative of 3 (A–C) or 2 assays (D).
Figure 3
Figure 3. Effect of HIF-1α knockdown on TA-specific CD8+ TILs
(A) MFI and representative histograms of HIF-1α and Glut1 in/on specific CD8+ T cells from day 30 Spl (open) and tumors (grey) (n=5 mice/group). (B) Experimental set-up: vaccine model. (C) MFI and flow plot of HIF-1α in MAA-specific CD8+ TILs transduced with scrambled (Co, open histogram) or HIF-1α shRNA lentivector (grey histogram). (D) MFI of PD-1 and LAG-3. (E) Left: % transduced MAA-specific CD8+ TILs producing individual functions. Right: Polyfunctionality. % transduced cells producing 3, 2 or 1 of the 3 tested functions. For all figures: * within (): significant difference in sum of responses. * without () left to right: significant difference in 3, 2, and 1 functions. (C–E) n=5–7 mice/group. (F) Experimental set up: OT-1 transfer model. (G) Tumor growth in mice that received transduced OT-1 T cells. (H) MFI of PD-1, LAG-3 and T-bet on/in donor transduced OT-1 CD8+ TILs. (I) Left: % transduced donor OT-1 CD8+ TILs producing individual factors. Right: flow plots show overlays of HIF-1α shRNA (blue) and Co (red) transduced factor-producing OT-1 CD8+ TILs. (J) Heatmap of transcript levels comparing HIF-1α shRNA over Co transduced OT-1 CD8+ TILs. (K) MFI of Glut1, PPAR-α and BODIPY C16 uptake. (*): p=0.05. (G–K) n=5–8 mice/group. Experiments were repeated twice. Data show mean - SEM. See also Figures S2, S3.
Figure 4
Figure 4. Limited access to Glc and O2 forces CD8+ TILs to enhance FA catabolism
(A–G) Vaccine model. (A) Glc concentrations in plasma, early and late stage B16BrafV600E tumors (n=3). (B) Relative transcript levels: Upper: CD8+ T cells in Gal- or Glc+2-DG- vs. Glc-medium under hypoxia. Middle: specific CD8+ TILs from day 30 vs. 14 tumors. Lower: specific CD8+ T harvested from day 90 vs. 14 Spl (n=3). Color code below 3rd and 4th row: comparisons between in vitro and in vivo samples. (C) Experimental set-up: 13C6-Glc in vivo tracing. (D) Intensity of glycolysis metabolites in CD44+CD8+ TILs. (E) Experimental set-up: 13C16-palmitate in vivo tracing. (F) Intensity of FA metabolites in CD44+CD8+ TILs. (G) Relative contribution of 13C6-Glc- and 13C16- palmitate-derived carbons to citrate and malate, calculated by dividing labeling carbon numbers from 13C16-palmitate by the numbers from 13C6-Glc. Data of CD44+CD8+ T cells from day 30 tumors are normalized to those from day 14 tumors (left) or day 30 Spl (middle); Spl data: day 30 normalized to 14 (right). (D, F, G) n=2–3, pooled from ~30 mice/sample. (H–I) OT-1 transfer model. (H) Normalized contribution of 13C16-palmitate to TCA cycle metabolites and L-palmitoylcarnitine in CD44+CD8+ TILs from day 30 vs. 14 tumors or day 30 Spl. (I) Intensities of FA metabolites. (H–I) n=2, pooled from ~20 mice/sample. (D, F, G–I) Data show as mean values. (J–L) Bar graphs: Relative intensity of free FA species in tumor interstitial fluid, dashed lines show ratio of 1. Pie charts: Abundance of different FA species. Total numbers: combined FA intensity. (J–K) day 30 over 14 B16BrafV600E tumors (J, n=3) or PDX melanomas (K, n = 5). (L) Human melanoma metastases vs. human sera (n = 4). (D, F, G–L) Representative of two assays. (A, J–L) mean - SEM. See also Figures S4, S5.
Figure 5
Figure 5. Metabolism of T cells in human samples
(A) Gating strategy for human CD8+ T cells subsets. Numbers show % of cells in each subset. (B) Pie charts show distribution of CD8+ T cell subsets within CD8+ T cells isolated from blood of healthy donors (n=14) or metastatic tumors of melanoma patients (n=9). p<0.0001 for differences in numbers of TEM cells normalized to 106 live CD8+ T cells. Numbers within pie charts show mean percentages. (C) Upper: % of cells positive for PD-1, Cpt1a, PPAR-α and FA uptake (BODIPY C16). Data show comparison for CD8+ T cell subsets isolated from blood vs. tumors. Lower: Representative histograms comparing markers of CD8+ TEM from blood vs. tumors. Data show mean - SEM.
Figure 6
Figure 6. Metabolism and effector functions of CD8+ TILs are independent of PD-1
(A) MFI of PD-1 tested with PD-1 Ab clone 29F.1A12 (same clone as α-PD-1 treatment Ab) or RMP1-30 and Phospho-Akt on/in specific CD8+ TILs from day 30 tumors (n=5–7). Iso: isotype control mAb. Lower: Flow plots for MAA-specific TILs. (B) Normalized 13C6-Glc or 13C16-palmitate contribution to TCA cycle metabolites and the intensity of ketone bodies in CD44+CD8+ T cells from day 30 tumors comparing α-PD-1- to Iso-treated mice. n=2 or 3, pooled from 25 mice/sample, shown as mean values. (C) % specific CD8+ TILs from day 30 tumors producing 3, 2 or 1 of the 3 tested functions (Iso: n=11; α-PD-1: n=15; data pooled from two assays). (D) B16BrafV600E tumor growth in mice that received Iso or α-PD-1 (unvaccinated: n=5; vaccinated: n=13; NSG: n=4). Arrows: red (vaccine); black (Ab treatment). (E) PD-1 and PD-L1 on B16BrafV600E tumor cells grown in vivo. Iso (grey), specific Ab (open). (F) PD-L1 KD in B16BrafV600E cells. (G) In vivo assay comparing survival of PD-L1hiCTVhi vs. PD-L1loCTVlo tumor cells in vaccinated or unvaccinated mice treated with Iso or α-PD-1 mAb. Bar graph: ratio of recovered live PD-L1hi over PD-L1lo B16BrafV600E cells (n=5). Right: histograms. (H) PD-1 and PD-L1 on B16OVA tumor cells grown in vivo. (I) PD-L1 KD in B16OVA cells. (J) Normalized survival of PD-L1hiCTVhi vs. PD-L1loCTVlo B16OVA cells in Iso or α-PD-1-treated mice that were transferred with activated OT-1 cells and representative histograms (n=5). (A, C, D, G, J) Data show mean with SEM (representative of 2 experiments). See also Figures S6.
Figure 7
Figure 7. Promoting FA catabolism improves CD8+ TIL functions and works in synergy with PD-1 blockade to delay tumor growth
(A–F) Vaccine model. (A) Experimental design. (B) % donor and host CD8+ T cells from tumors of recipients as bar graphs (left) or flow plot (right). (C) Transcript levels in donor-derived FF-vs. Dil-treated CD44+CD8+ TILs (n=3–4/group). (D) MFIs of PD-1 on specific donor CD8+ TILs. (E) Left: % specific donor CD8+ TILs producing 3, 2, or 1 of the 3 tested functions; * from bottom to top: differences in 3-1 factors; Right: Representative plots overlays of FF- (red) and Dil- (blue) treated MAA-specific donor TILs. (F) B16BrafV600E tumor weight at necropsy. (D–F, n=5). (G–I) PD-1 blockade combined with FF treatment. (G) Experimental design. (H) Left: tumor volume at day 30; Right: tumor growth curves. (I) Functions of donor CD8+ TILs. * bottom to top or right to left: differences cells producing 3, 2, or 1 of the 3 tested functions. Flow plots: factor-producing MAA-specific TILs from mice that received FF-treated cells, α-PD-1 (red) overlaid with Iso (blue)-treated cells. (H, I) Iso: n=6; α-PD-1: n=7. Studies were repeated twice. (J–L) OT-1 transfer model. (J) MFI of PD-1 on FF- or Dil-treated donor-derived activated OT-1 TILs. (K) Left: % donor-derived OT-1 TILs producing GrmB or IFN-γ. Middle: % cells producing 3, 2, or 1 of the 3 tested functions. Right: flow plots. (J, K) n=8 mice/group; data represent 2 experiments. (L) B16OVA tumor growth in mice received naive (n=24), Dil- or FF-treated activated OT-1 T cells (n=8/group). Data show mean - SEM. See also Figure S7.
Figure 8
Figure 8. Inhibiting FA catabolism impairs CD8+ T functions while decreasing PD-1 expression
(A) Transcript levels comparing CD8+ T cells from PPAR-α KO and WT mice stimulated in Glc- or Gal-medium under hypoxia (n=4). (B) Normalized MFIs for PD-1 on PPAR-α KO vs. WT activated CD8+ T cells cultured under different conditions (n=4–5). (C) Left: Normalized % PPAR-α KO vs. WT CD8+ T cells producing 3, 2, or 1 of the 3 tested functions (n=5). Right: Overlays of WT (blue) vs. PPAR-α KO (red) CD8+ T cells cultured in Gal-medium under normoxia. (D) Experimental design. (E) Comparison of transcript levels in CD44+CD8+ TILs from PPAR-α KO vs. WT donors (n=3 mice/group). (F) MFI of PD-1 on WT and PPAR-α KO donor CD8+ TILs with histograms. (G) Left: % donor-derived specific CD8+ TILs from the two groups producing 3, 2, or 1 of the 3 tested functions; Right: Overlays of factor-producing WT (blue) vs. PPAR-α (red) donor-derived TILs. (F, G) n=6/group. Data represent 2 assays, shown as mean - SEM. See also Figure S8.

Comment in

References

    1. Azuma T, Yao S, Zhu G, Flies AS, Flies SJ, Chen L. B7-H1 is a ubiquitous antiapoptotic receptor on cancer cells. Blood. 2008;111:3635–3643. doi: 10.1182/blood-2007-11-123141. - DOI - PMC - PubMed
    1. Balmer ML, Ma EH, Bantug GR, Grählert J, Pfister S, Glatter T, Jauch A, Dimeloe S, Slack E, Dehio P, Krzyzaniak MA, King CG, Burgener AV, Fischer M, Develioglu L, Belle R, Recher M, Bonilla WV, Macpherson AJ, Hapfelmeier S, Jones RG, Hess C. Memory CD8+ T Cells Require Increased Concentrations of Acetate Induced by Stress for Optimal Function. Immunity. 2016;44:1312–1324. doi: 10.1016/j.immuni.2016.03.016. - DOI - PubMed
    1. Bucks CM, Norton JA, Boesteanu AC, Mueller YM, Katsikis PD. Chronic antigen stimulation alone is sufficient to drive CD8+ T cell exhaustion. J Immunol. 2009;182:6697–6708. doi: 10.4049/jimmunol.0800997. - DOI - PMC - PubMed
    1. Chamoto K, Chowdhury PS, Kumar A, Sonomura K, Matsuda F, Fagarasan S, Honjo T. Mitochondrial activation chemicals synergize with surface receptor PD-1 blockade for T cell-dependent antitumor activity. Proceedings of the National Academy of Sciences. 2017;114:E761–E770. doi: 10.1073/pnas.1620433114. - DOI - PMC - PubMed
    1. Chang C-H, Qiu J, O’Sullivan D, Buck MD, Noguchi T, Curtis JD, Chen Q, Gindin M, Gubin MM, van der Windt GJW, Tonc E, Schreiber RD, Pearce EJ, Pearce EL. Metabolic Competition in the Tumor Microenvironment Is a Driver of Cancer Progression. Cell. 2015:1–14. doi: 10.1016/j.cell.2015.08.016. - DOI - PMC - PubMed

Publication types

MeSH terms