Review
. 2017 Nov:146:97-114.
doi: 10.1016/j.biomaterials.2017.08.013. Epub 2017 Aug 17.

State of diagnosing infectious pathogens using colloidal nanomaterials

Affiliations
Review

State of diagnosing infectious pathogens using colloidal nanomaterials

Jisung Kim et al. Biomaterials. 2017 Nov.

Abstract

Infectious diseases are a major global threat that accounts for one of the leading causes of global mortality and morbidity. Prompt diagnosis is a crucial first step in the management of infectious threats, which aims to quarantine infected patients to avoid contacts with healthy individuals and deliver effective treatments prior to further spread of diseases. This review article discusses current advances of diagnostic systems using colloidal nanomaterials (e.g., gold nanoparticles, quantum dots, magnetic nanoparticles) for identifying and differentiating infectious pathogens. The challenges involved in the clinical translation of these emerging nanotechnology based diagnostic devices will also be discussed.

Keywords: Clinical translation; Diagnostics; Nanomaterials; Nanotechnology; Point of care.


Figures

Fig. 1
Fig. 1
YLL caused by infectious diseases around the world, in low-income countries and in high-income countries .
Fig. 2
Fig. 2
Optical Properties of QDs. (A) Discrete energy levels of QDs compared to continuous energy states (i.e. energy bands) in a macroscopic semiconductor, and the size-dependent bandgap energies of QDs. Figure adapted from source . Copyright (2010) Dimitris Ioannou and Darren K. Griffin. (B) CdSe-ZnS (core-shell) QDs excited with a near-UV lamp showing emission peaks at 443, 473, 481, 500, 518, 543, 565, 587, 610, and 655 nm (from blue to red). Figure adapted from source . Copyright (2001) Nature Publishing Group. (C) Absorption and emission spectra of an organic dye (fluorescein isothiocyanate, i.e. FITC), and QD (CdSe). Figure adapted from source . Copyright (2010) Dimitris Ioannou and Darren K. Griffin.
Fig. 3
Fig. 3
Optical Properties of GNPs. (A) Surface plasmon resonance of spherical GNPs showing the synchronized oscillation of conduction band electrons relative to the electric field of incident light. Figure adapted from source . Copyright (2003) American Chemical Society. (B) Size-dependent optical property of GNPs. As the diameter increases (15–150 nm), the peak absorbance wavelength shifts to a longer wavelength, resulting in a darker solution color. Image courtesy of Abdullah Muhammed Syed. (C) Absorption profile of gold nanorods with two distinct peaks that correspond to transverse and longitudinal plasmons. Figure adapted from source . Copyright (2013) Chinese Laser Press. (D) Coupling of surface plasmons. Aggregation of GNPs shifts the absorption peak to a longer wavelength. (For interpretation of the references to colour in this figure legend, the reader is referred to the web version of this article.)
Fig. 4
Fig. 4
Size-dependent Properties of Iron Oxide MNPs. Figure adapted from source . Copyright (2010) Massachusetts Medical Society.
Fig. 5
Fig. 5
Examples of Fluorescence-based Biosensors using Nanoparticle. Images are adapted from indicated references. (A) QDs can be used as labels in multiplex ELISA . (B) Signal amplifiable reporter labels using self-assembly of QDs. Self-assembly is achieved via streptavidin-biotin interaction . (C) Controlling ratio of green/red QDs encapsulated into polymer beads to make over 100 unique barcodes; QD barcodes can detect analytes in multiplex format , . (D) Fluorescently functionalized ssDNA adsorption onto graphene quenches fluorescence; in the presence of complementary target dsDNA remains resuspended; can be performed in multiplex with different dyes .
Fig. 6
Fig. 6
Examples of SERS using Nanoparticles. Images are adapted from indicated references. (A) Antigen can link MNPs and GNPs. MNPs are used for magnetic separation and GNPs enhance SERS signal of the dye . (B) Hybridization of the dye-labeled DNA to GNP-immobilized strand increases SERS signal . (C) Scanometric assay can be used with SERS readout .
Fig. 7
Fig. 7
Examples of using Magnetic Nanoparticles for Biosensing. Images are adapted from indicated references. (A) QD barcode assay automated by encoding microbeads with MNPs and using a microfluidic device . (B) Highly sensitive scanometric assay developed by Mirkin group ; MNPs are used for magnetic separation. (C) Presence of target DNA links MNPs to a bead surface; this affects their magnetic momentum, which can be detected with a portable μNMR device developed by Weissleder group .
Fig. 8
Fig. 8
Examples of Electrochemical Bionsensors using Nanoparticles. Images are adapted from indicated references. (A) Nanowire electrodes allow detection of singe viral particles . (B) EC signal is an alternative readout for the scanometric assay shown in Fig. 7A . (C) Electrode coating with GNPs enhances electron production due to faster redox process .
Fig. 9
Fig. 9
Colorimetric Assays using Nanoparticles. Images are adapted from indicated references. (A) Antibodies can aggregate GNPs into microassemblies; nanoparticles turn purple due to surface plasmon resonance coupling . (B) Aptasensor detects bacteria. The presence of target bacteria causes desorption of aptamers from GNPs, which also induces aggregation of GNPs in the presence of high salt concentrations . (C) MNAzyme-GNP assay. Intact linker DNA induces aggregation of GNPs. The presence of target DNA activates MNAzyme components, which cleave linker DNA, and re-distribute GNPs to a monodispersed state.
Fig. 10
Fig. 10
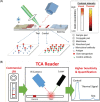
Thermometry-based Biosensors using Nanoparticles. Images are adapted from indicated references. (A) GNPs are irradiated by a laser on a lateral flow immunoassay, and temperature change is recorded with an infrared camera. (B) Temperature Contrast Amplification (TCA) reader developed by Bischof group can thereby improve analytical sensitivity of conventional lateral flow immunoassay , .
Fig. 11
Fig. 11
Comparison of Analytical Sensitivities. Analytical sensitivities of nanodiagnostics in comparison to conventional diagnostic methods for detection of proteins and nucleic acids.
Fig. 12
Fig. 12
Timeline of Nanodiagnostic Development. (A) Nanodiagnostic development is categorized into four stages: I. Material Characterization, II. Pre-clinical Development, III. Clinical Validation, and IV. Field Testing. (B) The intended diagnostic application (i.e. screening, sub-typing, monitoring, quantifying, or profiling drug resistance) can be determined upon the completion of clinical validation.

References

    1. Barreto M.L., Teixeira M.G., Carmo E.H. Infectious diseases epidemiology. J. Epidemiol. Community Health. 2006;60:192–195. - PMC - PubMed
    1. Woolhouse M.E.J., Gowtage-Sequeria S. Host range and emerging and reemerging pathogens. Emerg. Infect. Dis. 2005;11:1842–1847. - PMC - PubMed
    1. Taylor L.H., Latham S.M., Woolhouse M.E.J., Lathamt S.M., Bush E. Risk factors Hum. Dis. Emergence. 2013;356:983–989.
    1. Hay S.I., Battle K.E., Pigott D.M., Smith D.L., Moyes C.L., Bhatt S. Global mapping of infectious disease, philosophical transactions of the royal society of london. Series B. Biol. Sci. 2013;368 - PMC - PubMed
    1. Cleaveland S., Laurenson M.K., Taylor L.H. Diseases of humans and their domestic mammals: pathogen characteristics, host range and the risk of emergence, Philosophical Transactions of the Royal Society of London. Series B. Biol. Sci. 2001;356:991–999. - PMC - PubMed

LinkOut - more resources