. 2017 Sep 12;7(1):19.
doi: 10.1186/s13395-017-0135-9.

Increased plasma lipid levels exacerbate muscle pathology in the mdx mouse model of Duchenne muscular dystrophy

Affiliations

Increased plasma lipid levels exacerbate muscle pathology in the mdx mouse model of Duchenne muscular dystrophy

Nadia Milad et al. Skelet Muscle. .

Abstract

Background: Duchenne muscular dystrophy (DMD) is caused by loss of dystrophin expression and leads to severe ambulatory and cardiac function decline. However, the dystrophin-deficient mdx murine model of DMD only develops a very mild form of the disease. Our group and others have shown vascular abnormalities in animal models of MD, a likely consequence of the fact that blood vessels express the same dystrophin-associated glycoprotein complex (DGC) proteins as skeletal muscles.

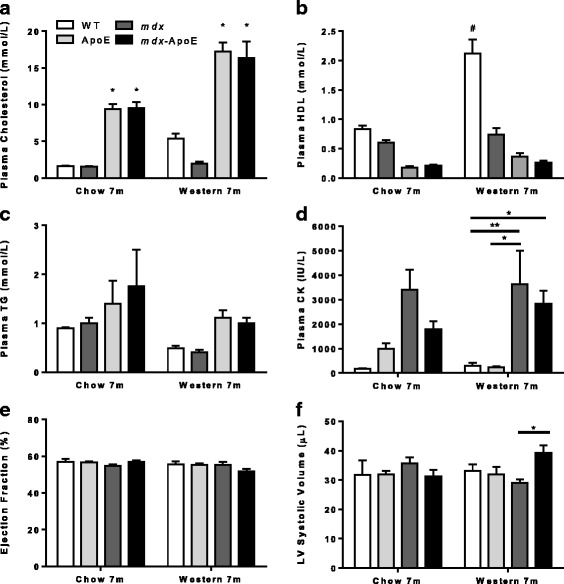
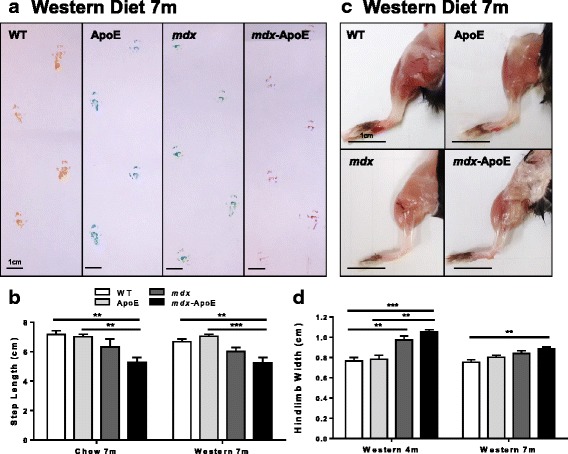
Methods: To test the blood vessel contribution to muscle damage in DMD, mdx 4cv mice were given elevated lipid levels via apolipoprotein E (ApoE) gene knockout combined with normal chow or lipid-rich Western diets. Ambulatory function and heart function (via echocardiogram) were assessed at 4 and 7 months of age. After sacrifice, muscle histology and aortic staining were used to assess muscle pathology and atherosclerosis development, respectively. Plasma levels of total cholesterol, high-density lipoprotein (HDL), triglycerides, and creatine kinase (CK) were also measured.

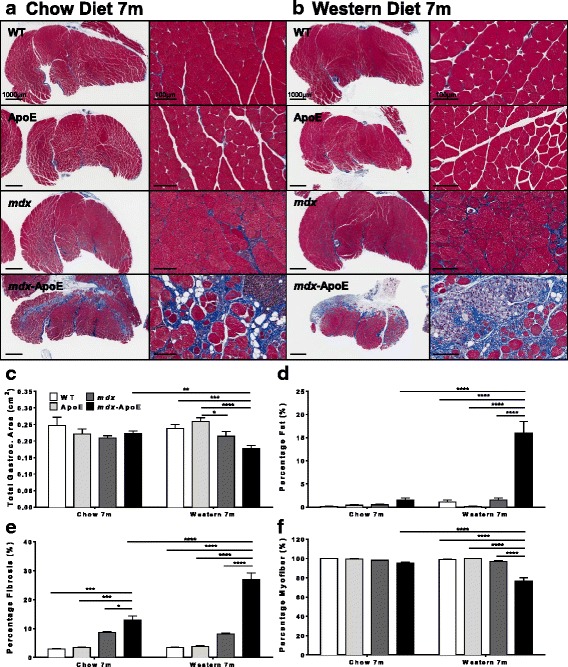
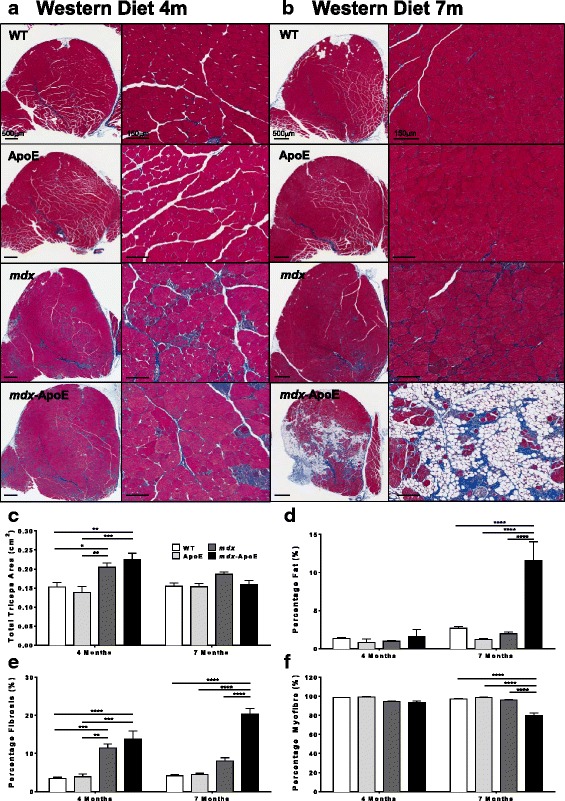
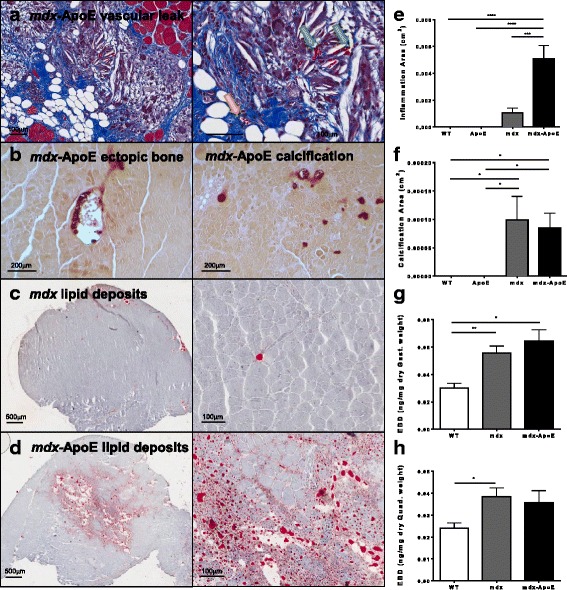
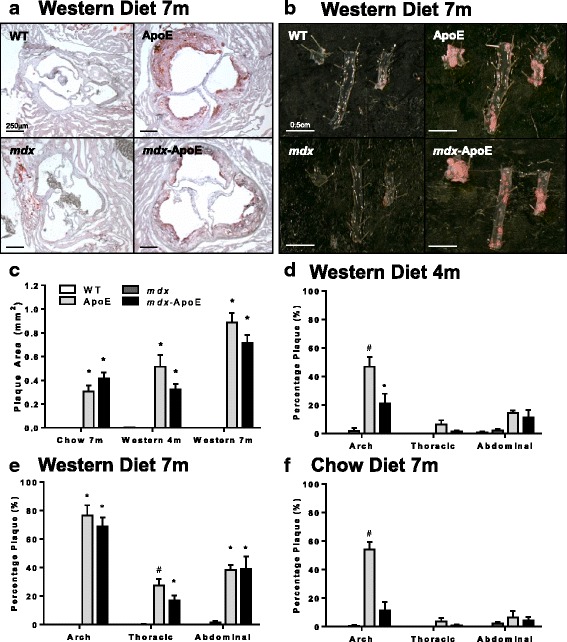
Results: Although there was an increase in left ventricular heart volume in mdx-ApoE mice compared to that in mdx mice, parameters of heart function were not affected. Compared with wild-type and ApoE-null, only mdx-ApoE KO mice showed significant ambulatory dysfunction. Despite no significant difference in plasma CK, histological analyses revealed that elevated plasma lipids in chow- and Western diet-fed mdx-ApoE mice was associated with severe exacerbation of muscle pathology compared to mdx mice: significant increase in myofiber damage and fibrofatty replacement in the gastrocnemius and triceps brachii muscles, more reminiscent of human DMD pathology. Finally, although both ApoE and mdx-ApoE groups displayed increased plasma lipids, mdx-ApoE exhibited atherosclerotic plaque deposition equal to or less than that of ApoE mice.

Conclusions: Since others have shown that lipid abnormalities correlate with DMD severity, our data suggest that plasma lipids could be primary contributors to human DMD severity and that the notoriously mild phenotype of mdx mice might be attributable in part to their endogenously low plasma lipid profiles. Hence, DMD patients may benefit from lipid-lowering and vascular-targeted therapies.

Keywords: Apolipoprotein E; Atherosclerosis; Duchenne muscular dystrophy; Dystrophin; Lipids; Vascular disease.


Conflict of interest statement

Ethics approval and consent to participate

These studies were approved by the Animal Ethics Board of UBC.

Consent for publication

Not applicable.

Competing interests

The authors declare that they have no competing interests.

Publisher’s Note

Springer Nature remains neutral with regard to jurisdictional claims in published maps and institutional affiliations.

Figures

Fig. 1
Fig. 1
Plasma lipid and creatine kinase levels and cardiac parameter on chow and Western diets. Plasma total cholesterol (a), HDL (b), triglycerides (c), and creatine kinase (d) as well as cardiac parameters from echocardiogram at 7 months of age on chow and Western diet: ejection fraction (e) and left ventricular systolic volume (f). Chow: WT (n = 2–3), ApoE (n = 5), mdx (n = 6–7), mdx-ApoE (n = 8–11). Western: WT (n = 6–9), ApoE (n = 4–7), mdx (n = 6), mdx-ApoE (n = 8–11). Mean + SEM. (ac) *P < 0.05 compared to WT and ApoE #P < 0.05 compared to all other groups; (df) **P < 0.01
Fig. 2
Fig. 2
Stride length measurements and hindlimb hypertrophy on chow and Western diets. Representative images of Western diet-fed group gait-tracking at 7 months of age, scale bar 1 cm (a) and quantification of stride length in centimeter on chow and Western diets (b). Representative images of Western diet-fed hindlimbs at 7 months of age, scale bar 1 cm (c) and quantification of hindlimb width at 4 and 7 months on Western diet. Chow: WT (n = 3), ApoE (n = 5), mdx (n = 3), and mdx-ApoE (n = 9). Western: WT 4 m (n = 4), 7 m (n = 6); ApoE 4 m (n = 2), 7 m (n = 7–8); mdx 4 m (n=)7, (n = 5–7); and mdx-ApoE 4 m (n = 5), 7 m (n = 10). Mean + SEM. *P < 0.05 **P < 0.01 ***P < 0.001 ****P < 0.0001
Fig. 3
Fig. 3
Gastrocnemius muscle size and composition at 7 months on chow and Western diets. Representative images of gastrocnemius from 7-month-old mice stained with Masson’s trichrome, scale bars 1000 μm (left) and 100 μm (right), on chow (a) and on Western diet (b). Quantification of total gastrocnemius area in square centimeter (c) and percentage of area composed of fat (d), fibrosis (e), and healthy myofiber (f). Chow: WT (n = 3), ApoE (n = 4), mdx (n = 10); mdx-ApoE (n = 13). Western: WT (n = 9), ApoE (n = 8), mdx (n = 7), and mdx-ApoE (n = 10). Mean + SEM. *P < 0.05 **P < 0.01 ***P < 0.001 ****P < 0.0001
Fig. 4
Fig. 4
Triceps brachii muscle size and composition at 4 and 7 months on Western diet. Representative images of triceps brachii stained with Masson’s trichrome, scale bars 500 μm (left) and 150 μm (right) at 4 (a) and 7 months of age (b) on Western diet. Quantification of total triceps brachii area in square centimeter (c) and percentage of area composed of fat (d), fibrosis (e), and healthy myofiber (f). WT 4 m (n = 4), 7 m (n = 9); ApoE 4 m (n = 3), 7 m (n = 9); mdx 4 m (n = 7), 7 m (n = 7); mdx-ApoE 4 m (n = 6), 7 m (n = 10). Mean + SEM. *P < 0.05 **P < 0.01 ***P < 0.001 ****P < 0.0001
Fig. 5
Fig. 5
Additional skeletal muscle histological features. Example of vascular leak in area of damage within mdx-ApoE Masson’s trichrome stained triceps brachii (yellow arrow indicates blood vessel and green arrows indicate red blood cells in muscle tissue), scale bars 100 μm (a). Ectopic bone (left) and calcification (right) in 4-month-old mdx-ApoE gastrocnemius stained with Alizarin red, scale bars 200 μm (b). Lipid deposits in mdx (c) and mdx-ApoE (d) oil red O stained triceps brachii, scale bars 500 μm (left) and 100 μm (right). Quantification of inflammation area (e) and calcification area (f) at 7 months of age on Western diet. Quantification of Evan’s blue dye extravasation in gastrocnemius (g) and quadriceps femoris (h) muscles of chow-fed wild-type, mdx and mdx-ApoE mice. Chow: WT (n = 5), mdx (n = 8), and mdx-ApoE (n = 9). Western: WT (n = 9), ApoE (n = 8), mdx (n = 5), and mdx-ApoE (n = 9). Mean + SEM *P < 0.05 **P < 0.01 ***P < 0.001 ****P < 0.0001
Fig. 6
Fig. 6
Atherosclerotic plaque accumulation in the root, arch, thoracic, and abdominal aortic segments. Representative images of plaque accumulation in Western diet-fed groups at 7 months of age in the aortic root, scale bar 250 μm (a) and aortic segments: arch, thoracic, and abdominal (left to right), scale bar 0.5 cm (b). Quantification plaque area in the aortic root (c) and plaque percentage in aortic segments of Western diet-fed groups at 4 (d) and 7 months of age (e), as well as chow-fed groups at 7 months (f). Chow: WT (n = 3), ApoE (n = 5), mdx (n = 4), and mdx-ApoE (n = 4–7). Western: WT 4 m (n = 3–4), 7 m (n = 5–7); ApoE 4 m (n = 4), 7 m (n = 5–7); mdx 4 m (n = 2–5), 7 m (n = 3–4); and mdx-ApoE 4 m (n = 5–6), 7 m (n = 5–6). Mean + SEM. *P < 0.05 compared to WT and mdx #P < 0.05 compared to all other groups

References

    1. Ervasti JM, Campbell KP. A role for the dystrophin-glycoprotein complex as a transmembrane linker between laminin and actin. J Cell Biol. 1993;122(4):809–823. doi: 10.1083/jcb.122.4.809. - DOI - PMC - PubMed
    1. Petrof BJ, et al. Dystrophin protects the sarcolemma from stresses developed during muscle contraction. Proc Natl Acad Sci U S A. 1993;90:3710–3714. doi: 10.1073/pnas.90.8.3710. - DOI - PMC - PubMed
    1. Rybakova IN, Patel JR, Ervasti JM. The dystrophin complex forms a mechanically strong link between the sarcolemma and costameric actin. J Cell Biol. 2000;150(5):1209–1214. doi: 10.1083/jcb.150.5.1209. - DOI - PMC - PubMed
    1. Straub V, et al. Animal models for muscular dystrophy show different patterns of sarcolemmal disruption. J Cell Biol. 1997;139(2):375–385. doi: 10.1083/jcb.139.2.375. - DOI - PMC - PubMed
    1. Bushby K, et al. Diagnosis and management of Duchenne muscular dystrophy, part 1: diagnosis and pharmacological and psychosocial management. Lancet Neurol. 2010;9:77–93. doi: 10.1016/S1474-4422(09)70271-6. - DOI - PubMed

Publication types

Grants and funding