. 2018 Jan;176(1):326-339.
doi: 10.1104/pp.17.00720. Epub 2017 Sep 12.

Pollen Aperture Factor INP1 Acts Late in Aperture Formation by Excluding Specific Membrane Domains from Exine Deposition

Affiliations

Pollen Aperture Factor INP1 Acts Late in Aperture Formation by Excluding Specific Membrane Domains from Exine Deposition

Anna A Dobritsa et al. Plant Physiol. 2018 Jan.

Abstract

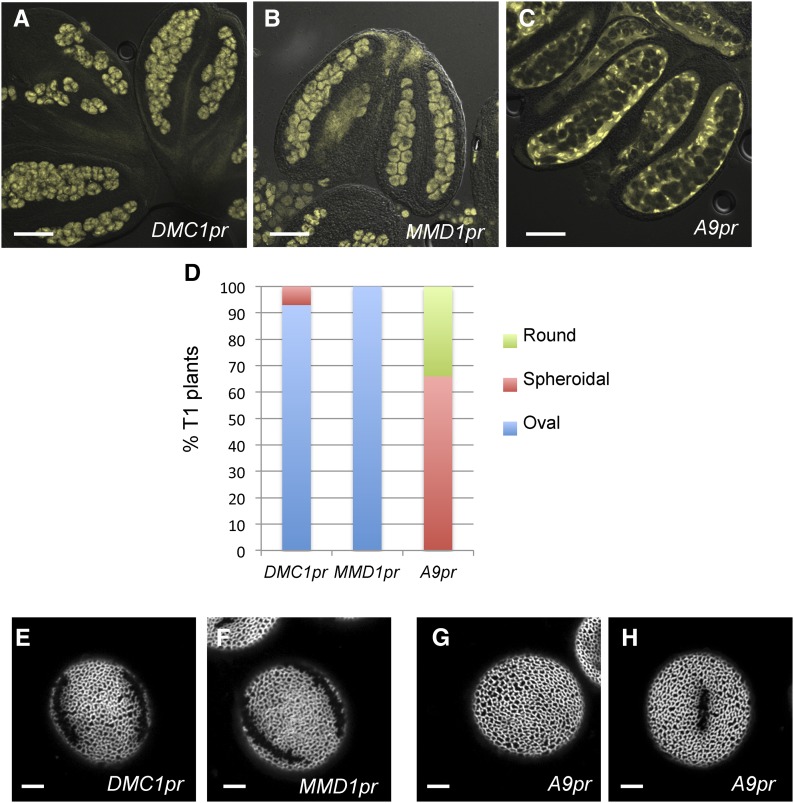
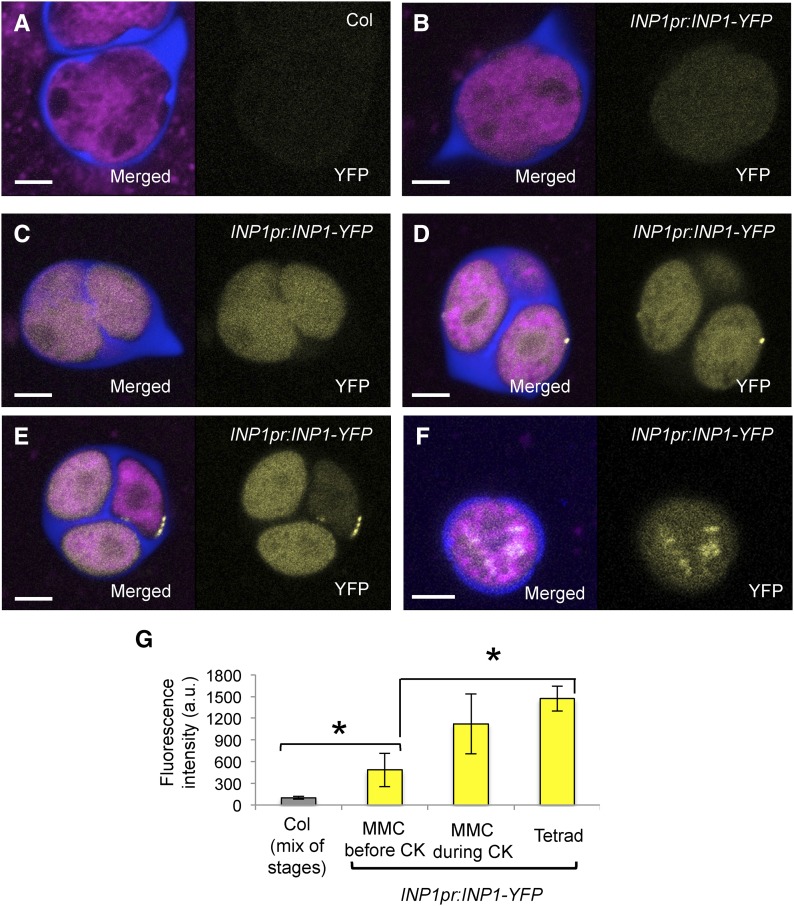
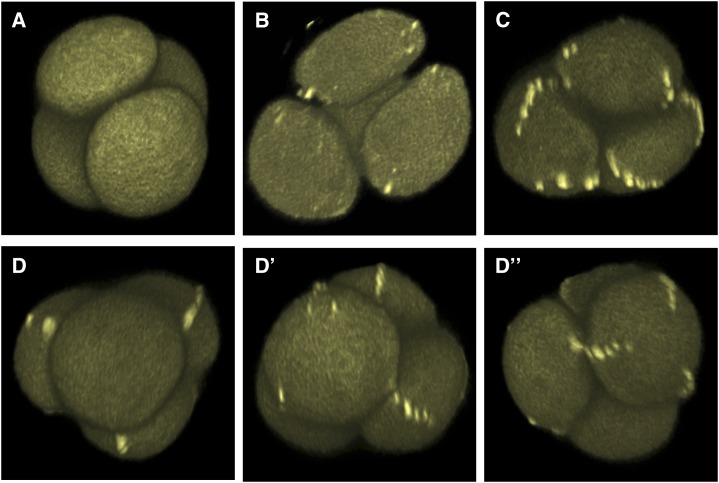
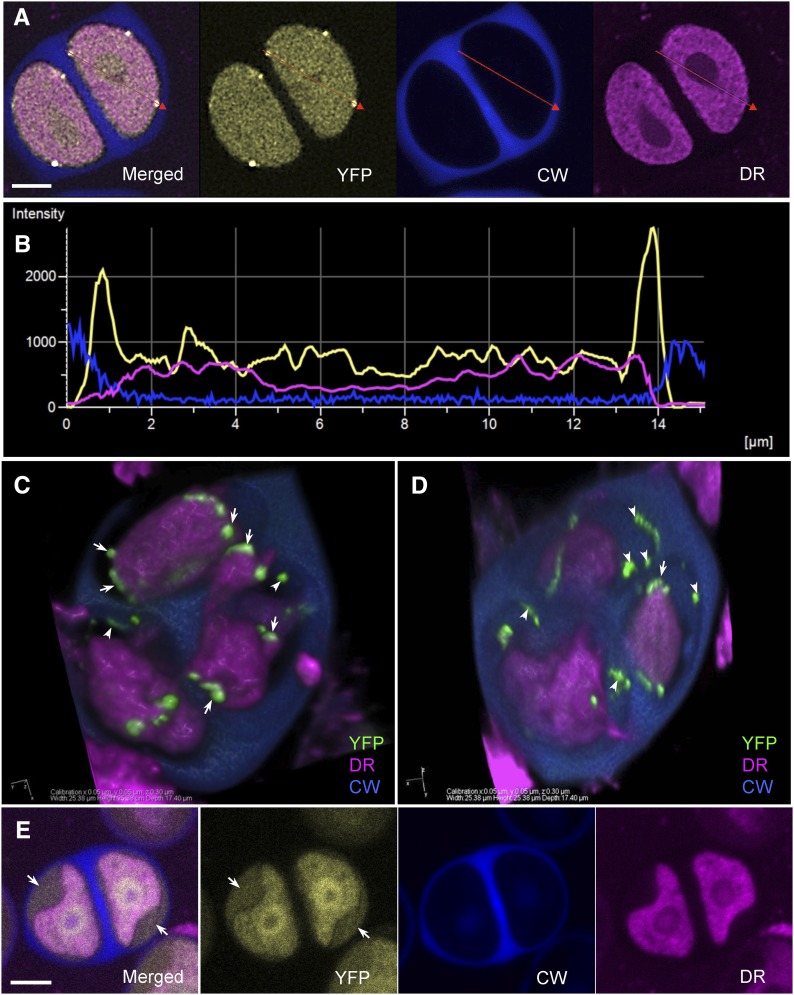
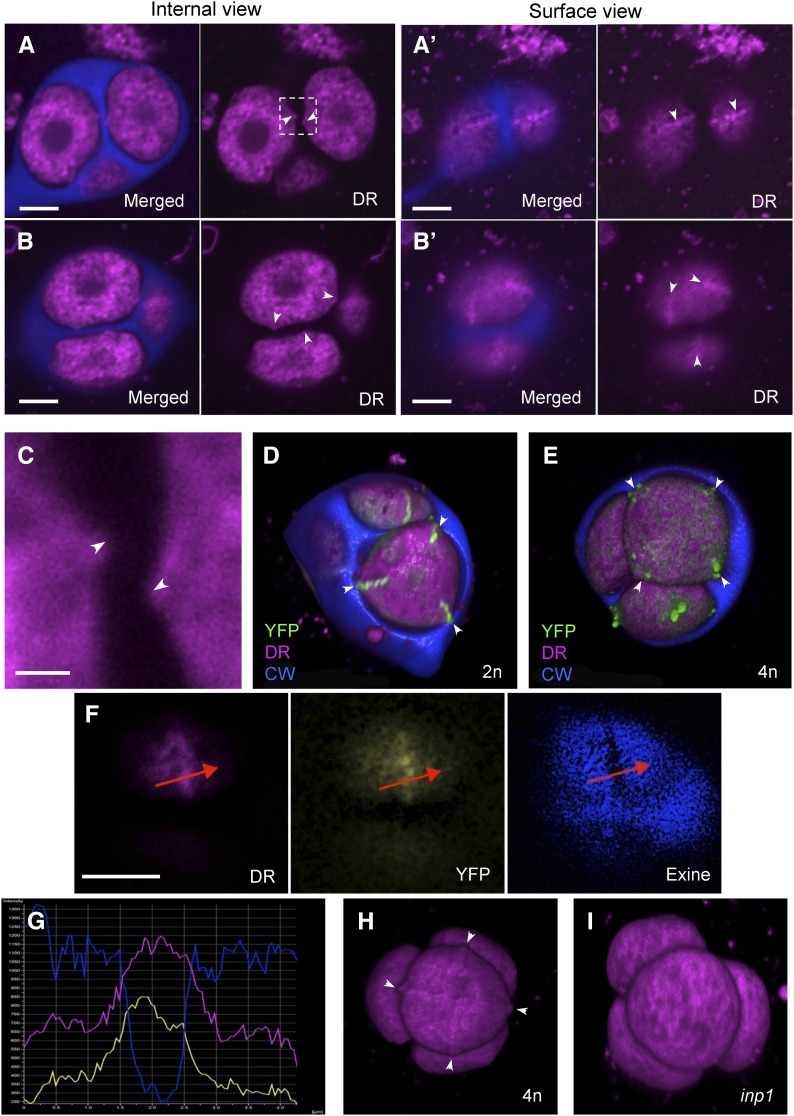
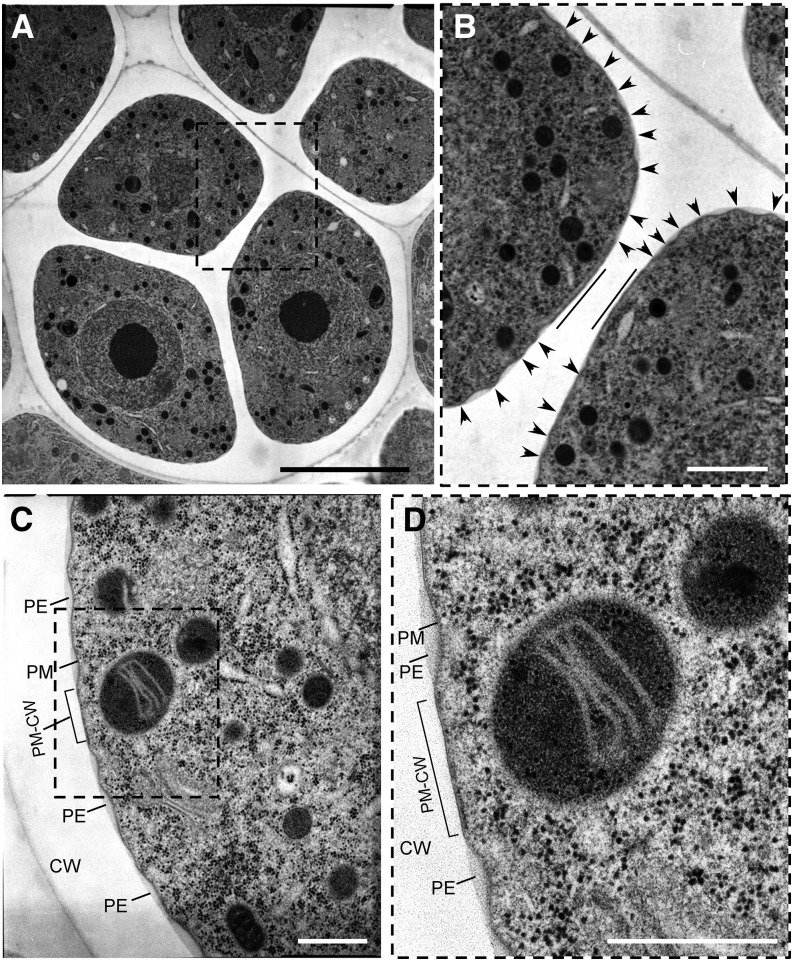
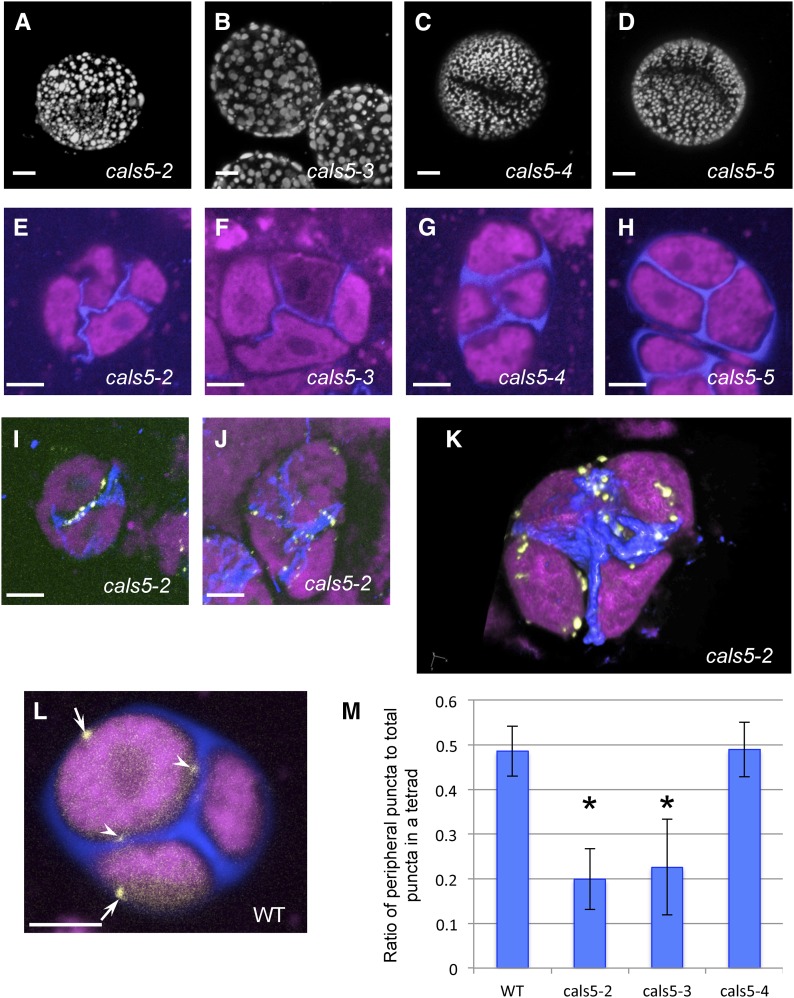
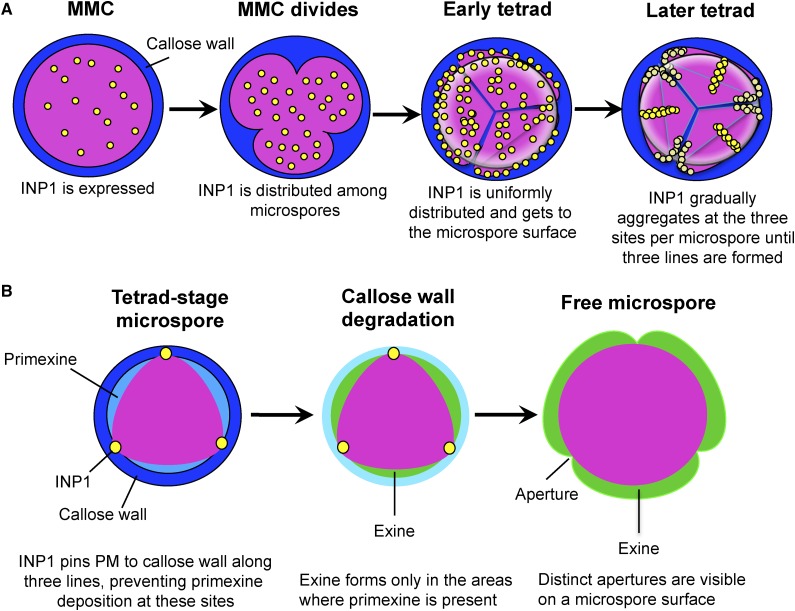
Accurate placement of extracellular materials is a critical part of cellular development. To study how cells achieve this accuracy, we use formation of pollen apertures as a model. In Arabidopsis (Arabidopsis thaliana), three regions on the pollen surface lack deposition of pollen wall exine and develop into apertures. In developing pollen, Arabidopsis INAPERTURATE POLLEN1 (INP1) protein acts as a marker for the preaperture domains, assembling there into three punctate lines. To understand the mechanism of aperture formation, we studied the dynamics of INP1 expression and localization and its relationship with the membrane domains at which it assembles. We found that INP1 assembly occurs after meiotic cytokinesis at the interface between the plasma membrane and the overlying callose wall, and requires the normal callose wall formation. Sites of INP1 localization coincide with positions of protruding membrane ridges in proximity to the callose wall. Our data suggest that INP1 is a late-acting factor involved in keeping specific membrane domains next to the callose wall to prevent formation of exine at these sites.


Figures

Figure 1.
Figure 1.
Expression of INP1 in microspore mother cells, but not in tapetum, restores formation of apertures in the inp1 mutant. A to C, INP1-YFP is expressed in the sporogenic layer of anthers when driven with DMC1 (A) or MMD1 (B) promoters and is expressed in tapetum when driven with the A9 promoter (C). D, Percentage of plants producing round, spheroidal, or oval pollen grains among the T1 populations containing, respectively, DMC1pr:INP1-YFP, MMD1pr:INP1-YFP, or A9pr:INP1-YFP transgenes. E to H, Long apertures are restored in plants with the DMC1pr (E) and MMD1pr (F) constructs, while pollen with no apertures (G) or with short apertures (H) is produced by plants expressing the A9pr construct. Scale bars = 50 μm in A to C and 5 μm in E to H.
Figure 2.
Figure 2.
Diffuse INP1-YFP fluorescence first appears in MMC, but puncta do not form until the tetrad stage. A to F, Confocal images of MMCs and tetrads. In each, image on the right shows YFP fluorescence and image on the left is the merged fluorescent signal from YFP (yellow), Calcofluor White (blue, CW), and CellMask Deep Red (magenta, membranous structures). A, Control Col-0 sporogenic cells exhibit essentially no background yellow fluorescence (MMC prior to cytokinesis is shown). B to F, Cytoplasmic and punctate YFP fluorescence in INP1pr:INP1-YFP sporogenic cells at different stages of development. B, MMC prior to cytokinesis. C, MMC during cytokinesis. D, Tetrad with some puncta. E, Tetrad with punctate lines forming. Note that the microspore with the INP1 line has the reduced amount of cytoplasmic YFP fluorescence compared to its sisters in which puncta have not yet formed. F, A young free microspore with cytoplasmic dots of YFP fluorescence. Scale bars = 5 μm. G, Quantification of mean diffused YFP fluorescence in control Col-0 sporogenic cells (Col, different developmental stages) and INP1pr:INP1-YFP in MMC before and during cytokinesis and at the tetrad stage (a.u., arbitrary units). Error bars indicate SD. Asterisks indicate statistical significance (P < 0.05).
Figure 3.
Figure 3.
Assembly of punctate INP1 lines in tetrad-stage microspores is gradual and nonsynchronous. 3D reconstructions of tetrad-stage microspores from the DMC1pr:INP1-YFP plants showing INP1-YFP lines at different stages of assembly. YFP fluorescence is shown. A, A tetrad with no puncta. See also Supplemental Movie S4. B, A tetrad with several puncta forming. See also Supplemental Movie S5. C, A tetrad with assembled INP1 lines. See also Supplemental Movie S6. D to D”, Microspores in the same tetrad can have INP1 lines at different stages of assembly. Three views of the same tetrad with a different microspore facing forward on each panel. D, The front microspore has no INP1 puncta or lines. D’, The front microspore has some INP1 puncta. D”, The front microspore has three INP1 punctate lines. See also Supplemental Movie S7.
Figure 4.
Figure 4.
INP1-YFP puncta and lines form between plasma membrane and CW. A, Confocal images of tetrad-stage microspores showing YFP (yellow), Calcofluor White (CW, blue), and CellMask Deep Red (DR, magenta) fluorescence. A red line is drawn through two INP1 puncta. B, Signal intensity profile of the three fluorophores along the red line shown in A. Yellow peaks coincide with the drop in magenta fluorescence and are followed by the increase in blue fluorescence. C to D, A 3D reconstruction of a plasmolyzed DMC1pr: INP1-YFP tetrad. Two different views of the same tetrad are shown. INP1-YFP puncta (green) are visible in association with both plasma membrane (arrows) and CWs (arrowheads). CW is partially removed to reveal the microspores. E, In microspores in which membranes got separated from the CW, the diffused INP1-YFP signal appears to occupy the space between the surface of plasma membranes and the CWs (arrows). Fluorophore colors as the same as in A. Scale bars in A and E = 5 μm.
Figure 5.
Figure 5.
Microspore plasma membrane forms protrusions and ridges at the aperture sites. A to B’, Confocal images of two tetrads showing membranous structures (magenta) and CW (blue). Membrane protrusions visible on internal optical sections (A and B, arrowheads) correspond to ridges visible on surface views of the same tetrads (A’ and B’, arrowheads). C, A magnified view of the boxed region from A of membrane protrusions (arrowheads) facing each other in a way typical of aperture placement. D, A 3D reconstruction of a tetrad from a diploid plant. Microspores have triangular outline, with three corners coinciding with three INP1 lines (green). CW is partially removed to reveal microspores. E, A 3D reconstruction of a tetrad from a tetraploid plant. Microspores have rectangular outlines, with four corners coinciding with four INP1 lines (green). CW is partially removed to reveal microspores. F, A surface view of a late tetrad-stage microspores shows that the position of the membrane ridge visible with membrane dye DeepRed (DR) coincides with positions of the INP1-YFP line (YFP) and the aperture (visible as a gap in the developing exine). G, Signal intensity profile of the three fluorophores shown in H along the red line drawn through the aperture in H. Peaks of the magenta and yellow signal correspond to the dip in the blue signal. H, A 3D reconstruction of a tetrad from a tetraploid plant. Four membrane ridges (arrowheads) are visible in the front-facing microspore. See also Supplemental Movie S8. I, In inp1 tetrads, no ridges were apparent. Scale bars = 5 μm in (A to B’ and F) and 1 μm in C.
Figure 6.
Figure 6.
Plasma membrane at the developing aperture sites is in close contact with CW and is protected from undulations and primexine deposition. A to D, TEM sections of tetrad-stage microspores at different magnifications. A, A tetrad of microspores with a boxed area containing two flattened membrane regions on sister microspores facing each other. B, A magnified view of the region boxed in A with straight lines demarcating the flattened membrane regions that face each other and arrowheads pointing at the peaks of the undulating plasma membranes. C, A portion of the microspore from another tetrad with a boxed area showing a flattened region of plasma membrane in juxtaposition to the CW (PM-CW). D, A magnified view of the boxed area from C. PE, primexine; PM, plasma membrane. The sites of PM-CW close contacts are denoted by brackets in C and D. Scale bars: 5 μm (A); 1 μm (B); 500 nm (C and D).
Figure 7.
Figure 7.
Defects in CW formation lead to defective aperture formation and abnormal localization of INP1 puncta. A to D, Although the reticulate pattern of pollen exine is disrupted in all mutant alleles of CALS5, aperture formation is specifically disrupted in strong, but not weak alleles of cals5. A and B, Pollen grains of cals5-2 and cals5-3 mutants lack apertures. C and D, In cals5-4 and cals5-5 mutants, apertures are still present. E to H, Tetrads in cals5 mutants stained with Calcofluor White (blue, CW) and CellMask Deep Red (magenta, membranous structures). Callose deposition is absent around the tetrad periphery in cals5-2 (E) and cals5-3 (F), yet weak intersporal walls still form. In cals5-4 and cals5-5, although the deposition of callose is also reduced compared to wild-type (shown in L), peripheral walls are formed and the intersporal walls are thicker and straighter than in cals5-2 and cals5-3. I to K, Strong cals5 mutants show abnormal localization of INP1 puncta. I and J, Maximum intensity projection of z-stacks of cals5-2 DMC1pr:INP1-YFP tetrads. INP1-YFP puncta exhibits strong colocalization with remaining CWs. K, A 3D reconstruction of a cals5-2 tetrad showing most INP1-YFP puncta in the proximity of intersporal CWs. (L) An example of a confocal section of a wild-type DMC1pr:INP1-YFP tetrad showing puncta localized both at the periphery of a tetrad (arrows) and at the central positions (arrowheads). Scale bars in A to J and L = 5 μm. M, Quantification of INP1 puncta localization in tetrads using serial optical sections. The ratio of peripheral puncta to the total number of puncta in a tetrad was calculated. Error bars indicate SD. Asterisks indicate statistically significant difference from wild type (P < 0.05).
Figure 8.
Figure 8.
A model of INP1 assembly into lines and formation of apertures on microspore surface. A, INP1 is produced by an MMC and initially has diffused internal localization. At the tetrad stage, INP1 gets to the microspore surface and gradually assembles first into puncta and then into punctate lines at the three preformed membrane domains. B, INP1 lines pin three domains of plasma membrane to the overlying CW, preventing primexine deposition at these regions. In the absence of primexine, exine fails to form in these regions but is deposited everywhere else, thus leading to the formation of three distinct apertures on a microspore surface.

References

    1. Alassimone J, Fujita S, Doblas VG, van Dop M, Barberon M, Kalmbach L, Vermeer JEM, Rojas-Murcia N, Santuari L, Hardtke CS, et al. (2016) Polarly localized kinase SGN1 is required for Casparian strip integrity and positioning. Nat Plants 2: 16113. - PubMed
    1. Alassimone J, Naseer S, Geldner N (2010) A developmental framework for endodermal differentiation and polarity. Proc Natl Acad Sci USA 107: 5214–5219 - PMC - PubMed
    1. Albert B, Nadot S, Dreyer L, Ressayre A (2010) The influence of tetrad shape and intersporal callose wall formation on pollen aperture pattern ontogeny in two eudicot species. Ann Bot (Lond) 106: 557–564 - PMC - PubMed
    1. Albert B, Ressayre A, Nadot S (2011) Correlation between pollen aperture pattern and callose deposition in late tetrad stage in three species producing atypical pollen grains. Am J Bot 98: 189–196 - PubMed
    1. Ariizumi T, Toriyama K (2011) Genetic regulation of sporopollenin synthesis and pollen exine development. Annu Rev Plant Biol 62: 437–460 - PubMed

Publication types

Substances

LinkOut - more resources