. 2017 Sep 26;114(39):E8274-E8283.
doi: 10.1073/pnas.1703420114. Epub 2017 Sep 12.

E46K α-synuclein pathological mutation causes cell-autonomous toxicity without altering protein turnover or aggregation

Affiliations

E46K α-synuclein pathological mutation causes cell-autonomous toxicity without altering protein turnover or aggregation

Ignacio Íñigo-Marco et al. Proc Natl Acad Sci U S A. .

Abstract

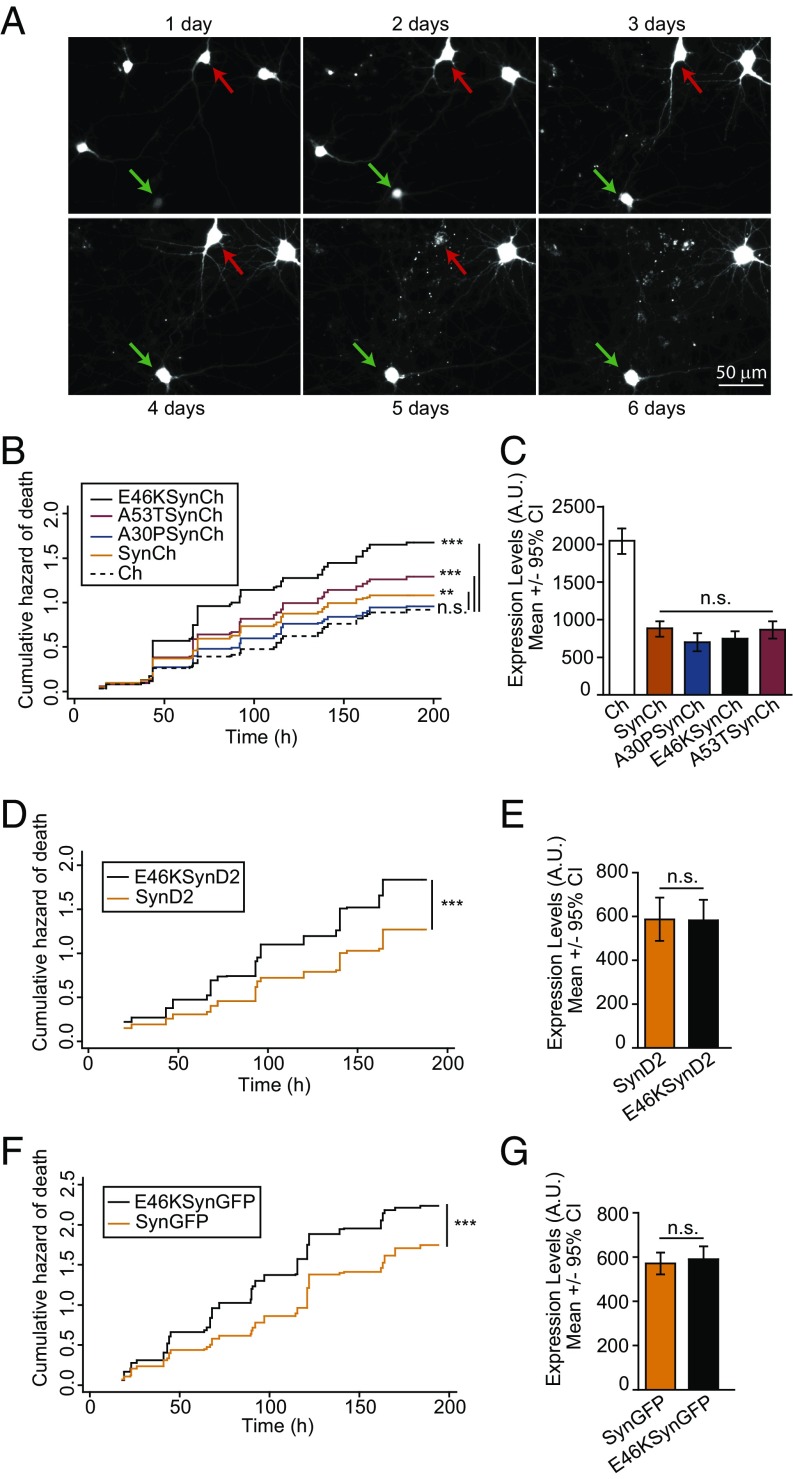
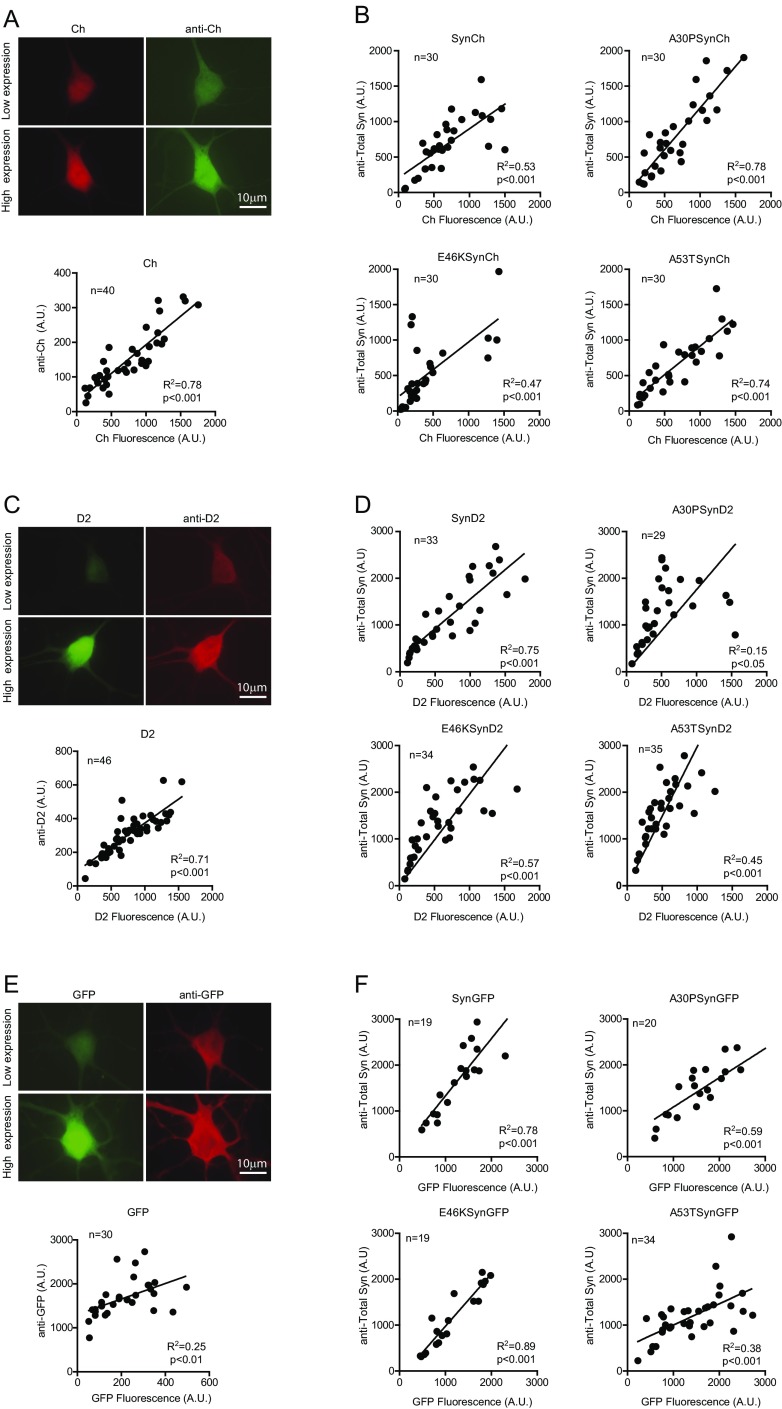
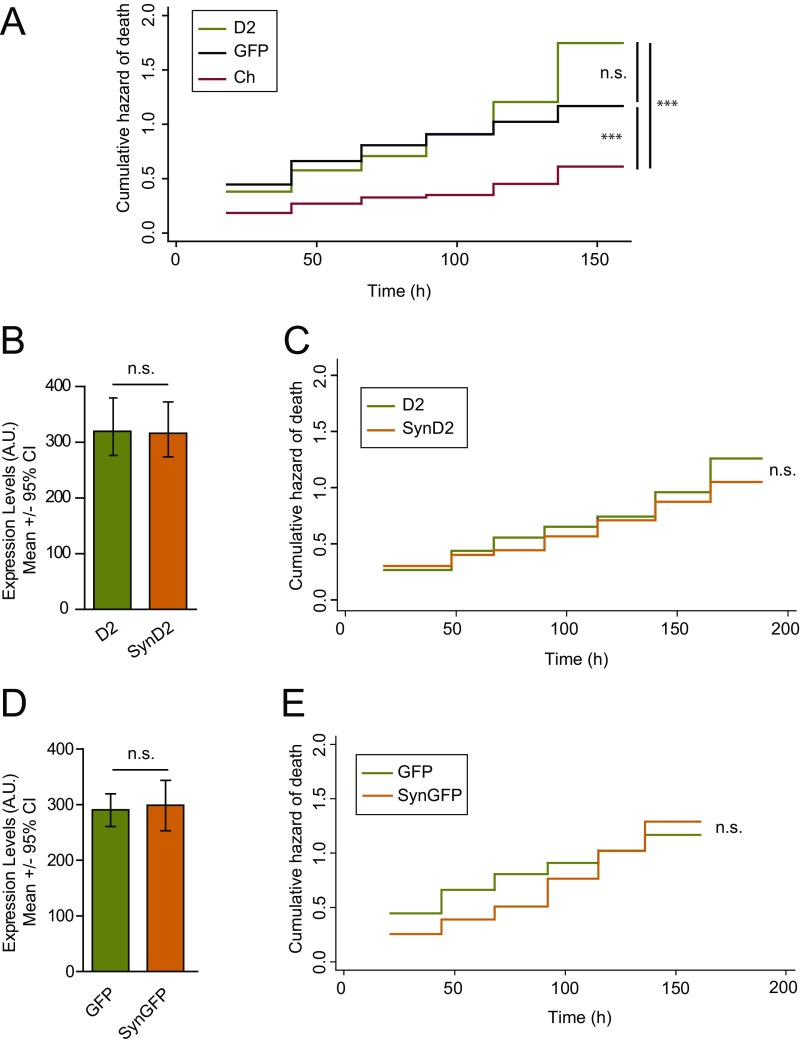
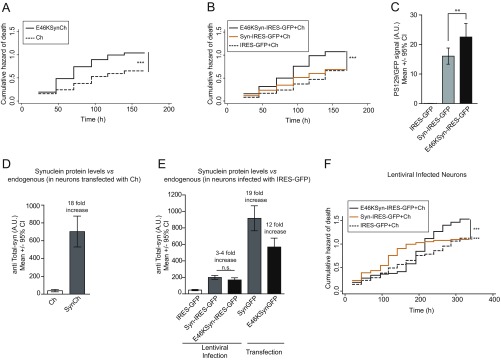
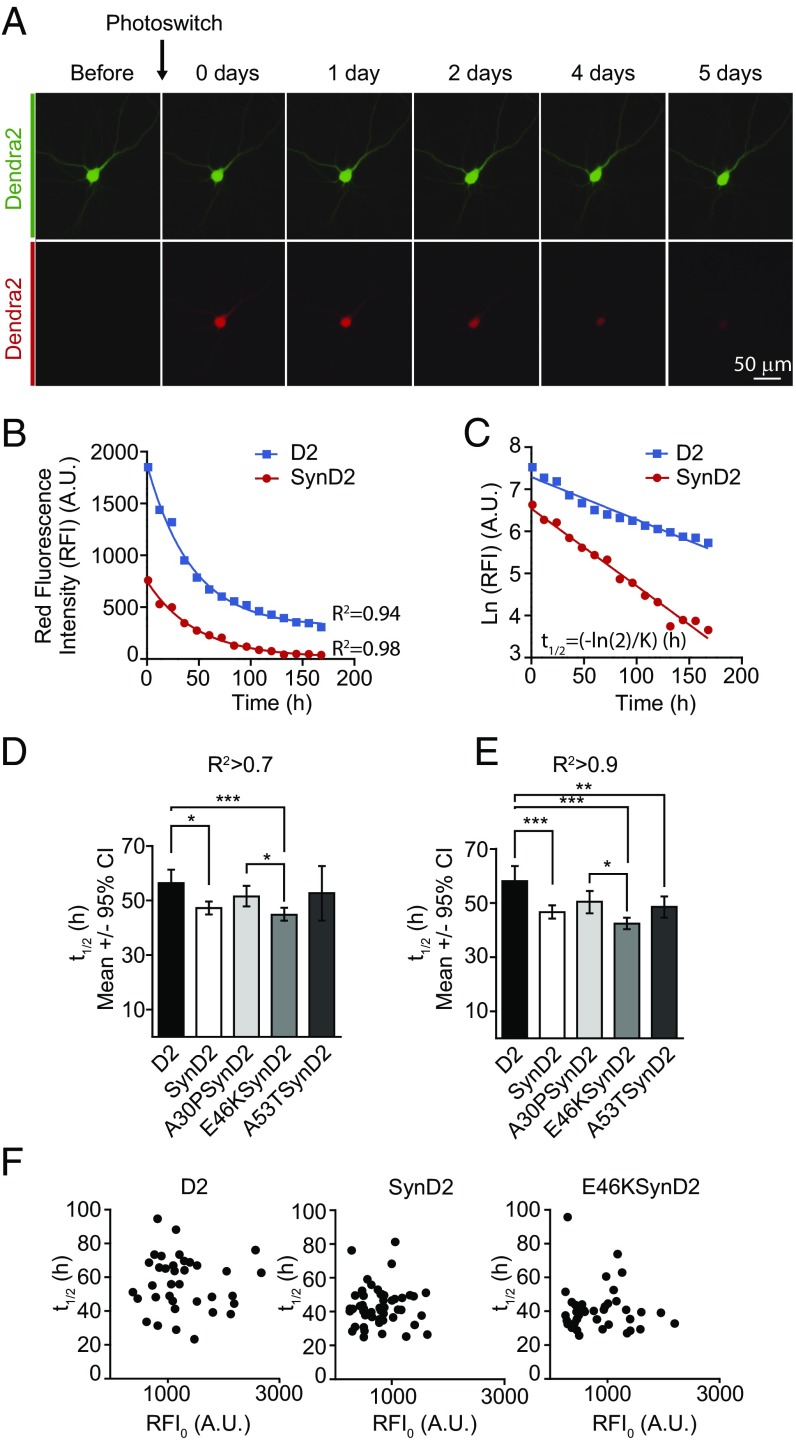
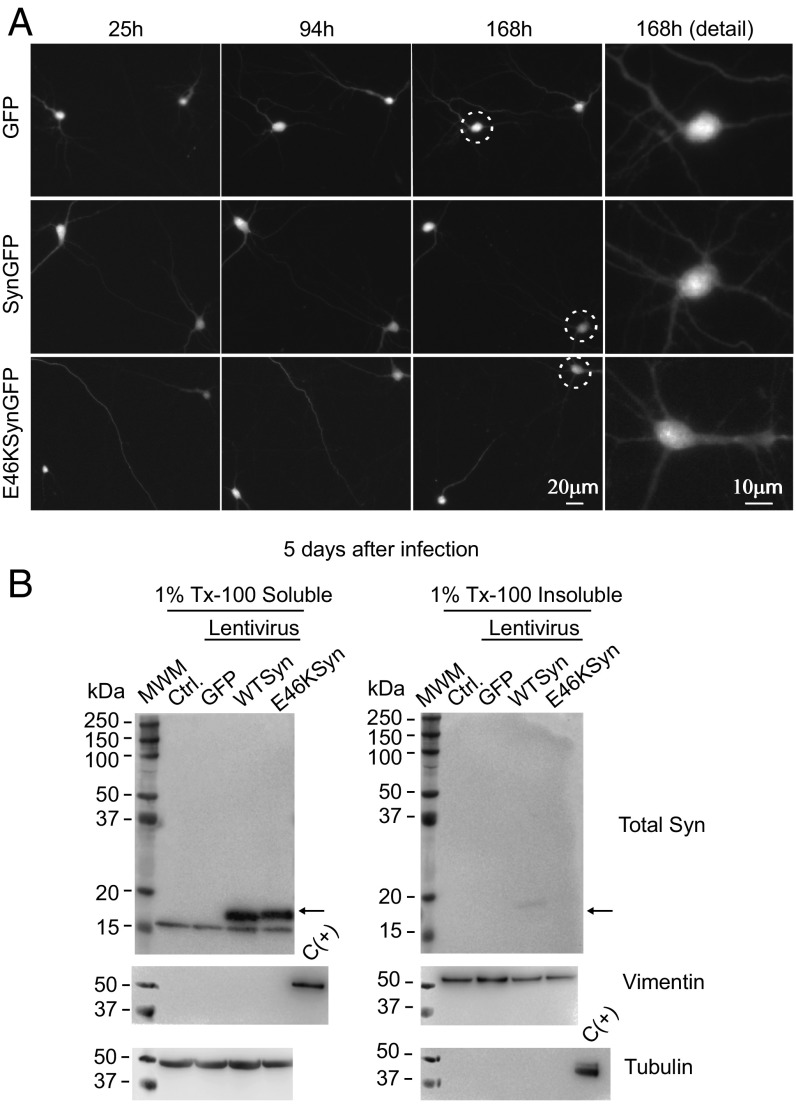
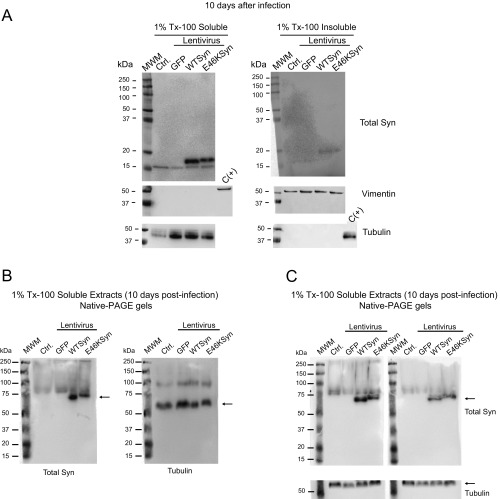
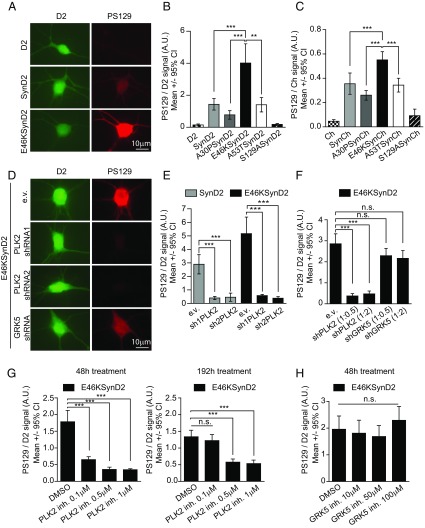
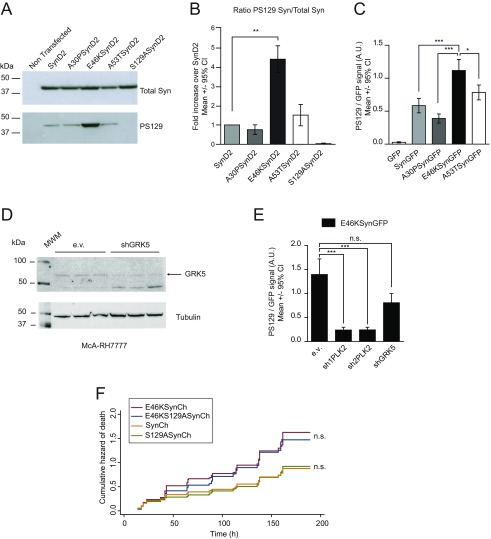
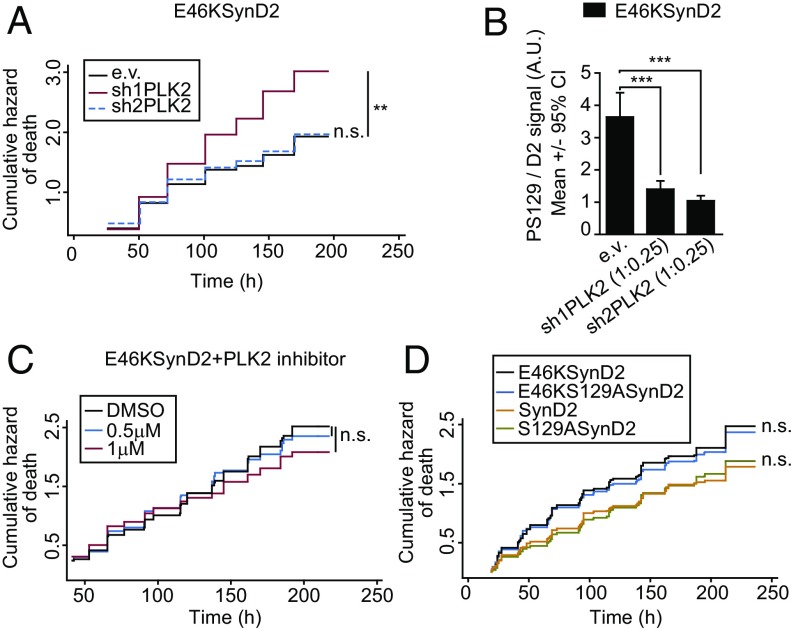
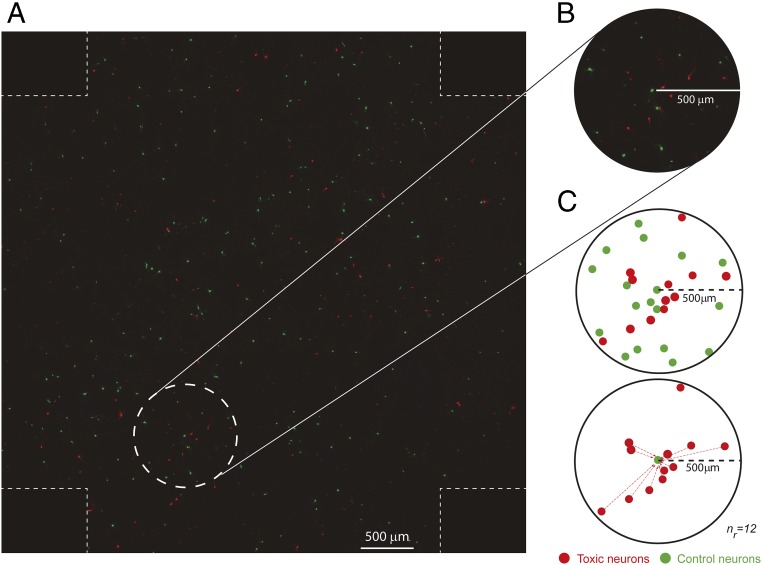
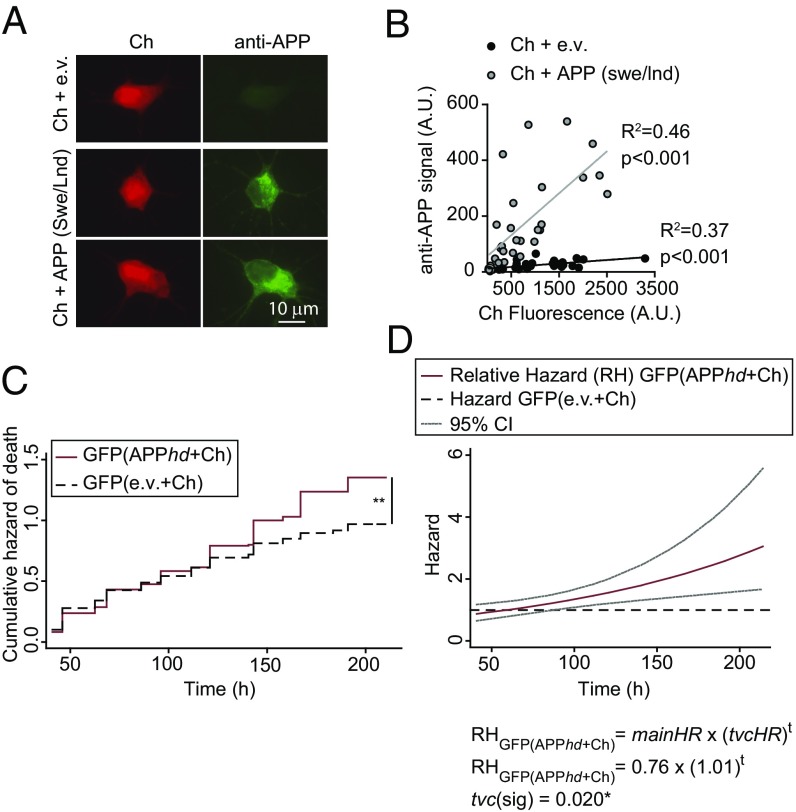
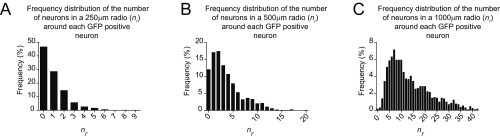
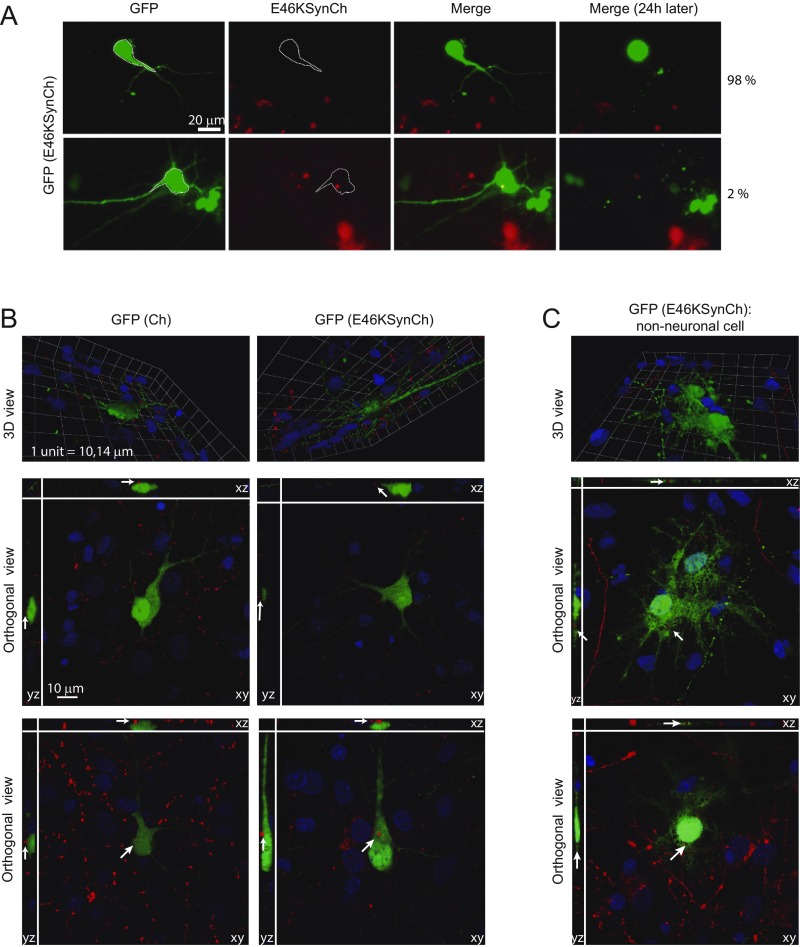
α-Synuclein (aSyn) is the main driver of neurodegenerative diseases known as "synucleinopathies," but the mechanisms underlying this toxicity remain poorly understood. To investigate aSyn toxic mechanisms, we have developed a primary neuronal model in which a longitudinal survival analysis can be performed by following the overexpression of fluorescently tagged WT or pathologically mutant aSyn constructs. Most aSyn mutations linked to neurodegenerative disease hindered neuronal survival in this model; of these mutations, the E46K mutation proved to be the most toxic. While E46K induced robust PLK2-dependent aSyn phosphorylation at serine 129, inhibiting this phosphorylation did not alleviate aSyn toxicity, strongly suggesting that this pathological hallmark of synucleinopathies is an epiphenomenon. Optical pulse-chase experiments with Dendra2-tagged aSyn versions indicated that the E46K mutation does not alter aSyn protein turnover. Moreover, since the mutation did not promote overt aSyn aggregation, we conclude that E46K toxicity was driven by soluble species. Finally, we developed an assay to assess whether neurons expressing E46K aSyn affect the survival of neighboring control neurons. Although we identified a minor non-cell-autonomous component spatially restricted to proximal neurons, most E46K aSyn toxicity was cell autonomous. Thus, we have been able to recapitulate the toxicity of soluble aSyn species at a stage preceding aggregation, detecting non-cell-autonomous toxicity and evaluating how some of the main aSyn hallmarks are related to neuronal survival.

Keywords: E46K mutation; alpha-synuclein; autonomous toxicity; neuronal death; serine 129 phosphorylation.


Conflict of interest statement

The authors declare no conflict of interest.

Figures

Fig. 1.
Fig. 1.
The E46K aSyn mutant significantly increases the risk of neuronal death in primary cultures of rat cortical neurons. (A) Longitudinal tracking with automated microscopy of individual primary rat cortical neurons transiently transfected with Ch. The green arrow points to a neuron tracked longitudinally for up to 6 dpt; the red arrow indicates a neuron that died 5 dpt. (B) Cumulative hazard estimates of primary neurons transfected with WT aSyn (SynCh), with the pathological mutants A30PSynCh, E46KSynCh, or A53TSynCh, or with Ch as control. Results show CPH analysis of 500–750 neurons per condition from four independent experiments. (C) Ch fluorescence intensity of individual neurons 20–24 h after transfection (n = 80–160 neurons per condition from a representative experiment; Kruskal–Wallis and Dunn’s post hoc test). (D and F) Cumulative hazard estimates of primary neurons transfected with D2/GFP-tagged WT aSyn or the E46K mutant (SynD2, SynGFP, E46KSynD2, E46KSynGFP). CPH analysis: D2 fusions, n = around 500 neurons per condition from four independent experiments; GFP fusions, n = around 900 neurons per condition from five independent experiments. (E and G) Expression of aSyn (WT or E46K mutant) in neurons at 20–24 h after transfection (n = around 100 neurons per condition from representative experiments Mann–Whitney test). All error bars indicate 95% CIs; n.s., nonsignificant; **P < 0.01; ***P < 0.001.
Fig. S1.
Fig. S1.
Fluorescence intensity of aSyn Ch/D2/GFP-tagged constructs as a surrogate for aSyn protein levels. (A, C, and E) Rat cortical neurons transfected with the Ch (A), D2 (C), and GFP plasmids (E) and immunostained with anti-Ch–, anti-D2–, and anti-GFP–specific antibodies. The fluorescence intensity of Ch, D2, and GFP and of the secondary antibodies recognizing anti-Ch, anti-D2, and anti-GFP was quantified in individual neurons. (B, D, and F) Neurons were transfected with Ch/D2/GFP-tagged versions of aSyn, and immunostaining was performed with an anti-aSyn–specific antibody (anti-Total aSyn). Fluorescence intensity from Ch, D2, and GFP and from secondary antibodies recognizing the anti-Total aSyn was quantified in individual neurons. Coefficient of determination (R2) and P values were estimated by correlation analysis.
Fig. S2.
Fig. S2.
Ch, D2, and GFP fluorescent proteins affect the survival of cortical neurons distinctly. (A) Cumulative risk estimates of primary neurons transfected with Ch, D2, and GFP (D2 = 386, GFP = 210, and Ch = 141 neurons, respectively; log-rank test; n.s., nonsignificant, ***P < 0.001). (B) Cohorts of neurons expressing similar levels of D2 and SynD2 were selected for further analysis of the risk of neuronal death (D2 = 119 and SynD2 = 125 neurons, respectively; Mann–Whitney test; n.s., nonsignificant). (C) The risk of death of cohorts of neurons expressing similar levels of WT aSyn (SynD2) and control protein D2 (from B) was compared (log-rank test; n.s., nonsignificant). (D) Cohorts of neurons expressing similar levels of GFP and SynGFP were selected (SynGFP = 132 and GFP = 210 neurons; Mann–Whitney test; n.s., nonsignificant). (E) The risk of death in cohorts of neurons was compared after expressing similar levels of WT aSyn (SynGFP) and control protein GFP (from D; log-rank test; n.s., nonsignificant). All error bars represent the 95% CIs.
Fig. S3.
Fig. S3.
Untagged IRES-GFP versions of aSyn show neuronal toxicity similar to that of Ch-tagged versions. (A) Cumulative hazard estimates of primary rat cortical neurons coexpressing E46KSynCh and Ch as control (n = 250–300 neurons per condition; CPH analysis; ***P < 0.001). (B) Cumulative hazard of death of primary rat cortical neurons coexpressing WT or E46K aSyn (Syn-IRES-GFP, E46KSyn-IRES-GFP) and Ch. Control conditions are neurons coexpressing IRES-GFP and Ch (n = 250–300 neurons per condition; CPH analysis; ***P < 0.001). (C) Quantification of anti-PS129 binding relative to GFP (from IRES-dependent expression) in individual primary rat cortical neurons expressing IRES-GFP, Syn-IRES-GFP, and E46KSyn-IRES-GFP from immunofluorescence experiments (n = 42–66 neurons per condition; one-way ANOVA and Bonferroni’s post hoc test; **P < 0.01). All error bars represent 95% CIs. (D) Quantification of total aSyn protein levels in immunostained individual neurons transfected with Ch and SynCh. Total aSyn levels in Ch-transfected neurons are indicative of endogenous aSyn levels (n = 10–12 neurons per condition). (E) Quantification of anti-total aSyn binding in individual neurons infected with lentivirus (IRES-GFP as control, Syn-IRES-GFP, or E46KSyn-IRES-GFP) or transfected with SynGFP and E46KSynGFP. Total aSyn levels in IRES-GFP–infected neurons are indicative of endogenous aSyn levels (n = 20–70 neurons per condition; Kruskal–Wallis and Dunn’s post hoc test). All error bars represent 95% CIs. (F) Longitudinal survival analysis in primary rat cortical neurons infected with aSyn-expressing lentivirus. Cumulative hazard estimates of primary rat cortical neurons transfected with Ch and infected 4 h later with E46KSyn-IRES-GFP, Syn-IRES-GFP, or IRES-GFP, respectively (n = 150–300 neurons per condition; CPH analysis; ***P < 0.001).
Fig. 2.
Fig. 2.
The E46K mutation does not alter aSyn protein stability. (A) Protein turnover (half-life) estimated in living neurons by OPL. (Upper Row) Illumination of a D2-transfected neuron with light at a wavelength of 488 nm induces the emission of green fluorescence. (Lower Row) After a brief pulse with intense blue light (photoswitching), a proportion of the D2 molecules photoconvert and emit red fluorescence. Green and red fluorescence intensities in single neurons are longitudinally monitored by automated microscopy. (B) Example of two photoconverted neurons in which changes in RFI over time fit an exponential decay. (C) Logarithmic transformation of the intensity of RFI [ln(RFI)] and adjustment by linear regression. The slope (K) enables the D2 half-life to be estimated (t1/2 = −ln (2)/K) in individual neurons in hours (h). (D and E) Half-life estimated for D2-tagged WT aSyn (SynD2) and pathological mutants A30PSynD2, E46KSynD2, and A53TSynD2 in neurons subjected to OPL. Graphs show the estimated half-life for neurons with coefficients of determination R2 >0.7 (D) and R2 >0.9 (E) (Kruskal–Wallis and Dunn’s post hoc test, n = 130–290 neurons per condition from five independent experiments). (F) No correlation was found between the initial RFI after photoconversion (RFI0) and the protein half-life estimated in individual neurons transfected with D2 or D2 aSyn-tagged constructs (n = 30–50 neurons per condition, a representative experiment). All error bars indicate 95% CIs; *P < 0.05, **P < 0.01, ***P < 0.001.
Fig. 3.
Fig. 3.
The E46K mutant does not form Tx-100–insoluble aggregates in rat primary cortical neurons during a longitudinal survival experiment. (A) Visual inspection does not reveal aggregate formation in neurons transfected with GFP, SynGFP, or E46KSynGFP. The circles show neurons that are amplified in the image at the Right. (B) Rat cortical primary neurons were infected with lentivirus expressing aSyn (WT or E46K mutant) together with an IRES-driven GFP reporter (41), and 5 d after lentiviral infection the primary neuronal cultures were extracted with 1% Tx-100. The detergent-soluble and -insoluble protein fractions were separated by ultracentrifugation and analyzed by Western blots. As reported elsewhere (42), tubulin appears in the soluble fraction and vimentin in the insoluble fraction. A sample from the opposite fraction was used as a positive control [C(+)]. The aSyn from these cells is predominantly detected in the 1% Tx-100–soluble fraction, with a mass of ≈16 kDa. Experiments were performed twice with similar results. Ctrl, control noninfected neurons; MWM, molecular weight marker.
Fig. S4.
Fig. S4.
The E46K aSyn pathological mutation does not form Tx-100–insoluble aggregates in primary rat cortical neurons 10 d after lentiviral infection. (A) Ten days after lentiviral infection, extracts of primary neuron cultures were homogenized in 1% Tx-100, and the detergent-soluble and -insoluble protein fractions obtained by ultracentrifugation at 100,000 × g were analyzed in Western blots. The aSyn is predominantly detected in the Tx-100–soluble fraction with a mass of ≈16 kDa; as reported, tubulin appears in the soluble fraction, and vimentin appears in the insoluble fraction. A sample from the opposite fraction was used as a positive control [C(+)]. Each experiment was performed twice with similar results. (B) Analysis of 1% Tx-100–soluble fractions from neuronal protein extracts infected with aSyn expressing lentivirus by native PAGE gels and Western blot. Rat cortical primary neurons were infected with lentivirus expressing WT or E46K mutant aSyn. Ten days after lentiviral infection, extracts of primary neuron cultures were homogenized with 1% Tx-100. The detergent-soluble fraction was separated by ultracentrifugation, run in native PAGE gels, and analyzed by Western blot with a specific antibody against Total aSyn. aSyn is detected with an apparent mass between 60–70 kDa. The same membrane was stripped and incubated with anti-tubulin antibody. Tubulin is detected with an apparent mass of 60 kDa. (C) The upper membranes represent two independent replicates of the experiment described in B. These membranes have been cut and incubated with anti-tubulin antibody. Ctrl, control noninfected neurons; MWM, molecular weight marker.
Fig. 4.
Fig. 4.
The E46K mutant exhibits the highest levels of PLK2-dependent PS129. (A) Immunofluorescence staining of primary rat cortical neurons expressing D2 or E46KSynD2 with a specific antibody against PS129. The green fluorescence signal from D2 is a surrogate for total aSyn levels, and the red fluorescence signal indicates the anti-PS129 binding (PS129 levels). (B) Quantification of the anti-PS129 binding over the D2 fluorescence intensity (total aSyn) in individual neurons expressing SynD2, A30PSynD2, E46KSynD2, or A53TSynD2; neurons expressing D2 and the S129ASynD2 mutant were used as negative controls (n = 20–40 neurons per condition; results of a representative experiment of three independent experiments are shown). (C) Similar results were obtained for aSyn Ch-tagged versions (n = around 30 neurons per condition). (D) Neurons cotransfected with E46KSynD2 and PLK2/GRK5 shRNAs containing plasmids or the empty vector (e.v.) as a control and immunostained with the anti-PS129 antibody. (E) Quantification of anti-PS129 binding relative to the D2 fluorescence intensity (total aSyn) in individual neurons expressing SynD2 or E46KSynD2 with two specific PLK2 shRNAs, sh1PLK2 and sh2PLK2. (n = 8–23 neurons per condition; results of a representative experiment of at least four independent experiments are shown). (F) Anti-PS129 binding relative to the D2 fluorescence intensity (total aSyn) in individual neurons expressing E46KSynD2 with PLK2- and GRK5-specific shRNAs at ratios of 1:2 and 1:0.5 (n = 30–44 neurons per condition from two independent experiments). (G) Quantification of PS129 in neurons expressing E46KSynD2 48 and 192 h after addition of the PLK2-specific inhibitor (inh). The effect persists at the higher doses 192 h after addition (n = 30–35 neurons per condition; results from a representative experiment of at least two independent experiments are shown). (H) A similar experiment using a GRK5-specific inhibitor did not decrease PS129 after 48 h (n = 20 neurons; results from a representative experiment of two independent experiments are shown). All error bars indicate 95% CIs; n.s., nonsignificant; **P < 0.01, ***P < 0.001 Kruskal–Wallis and Dunn’s post hoc test.
Fig. S5.
Fig. S5.
Analysis of PS129 of WT and mutant aSyn and its effect on neuronal survival. (A) HEK293 cells were transiently transfected with D2-tagged constructs of aSyn (WT, the pathological A30P, E46K, and A53T mutants, and the S129A mutant). The levels of PS129 were analyzed in Western blots using anti-Total aSyn and anti-PS129–specific antibodies. (B) Quantification of PS129 relative to the total aSyn levels in Western blots. The graph shows the values for each aSyn mutant normalized to WT aSyn (data are from three independent experiments; Kruskal–Wallis and Dunn’s post hoc test; **P < 0.01). (C) Quantification of PS129 binding over GFP intensity (total aSyn levels) in individual immunostained neurons expressing the WT and pathological aSyn GFP-tagged mutants SynGFP, A30PSynGFP, E46KSynGFP, and A53TSynGFP (data shown are from one representative experiment of three independent experiments; n = 20–39 neurons per condition; Kruskal–Wallis and Dunn’s post hoc test; *P < 0.05, ***P < 0.001). (D) Western blot of protein extracts from McA-RH7777 cells (rat cell line) transfected with a plasmid containing a specific GRK5 shRNA or the empty vector (e.v.) as a control. A specific antibody for GRK5 recognizes a band located at around 68 kDa, approximating the mass of GRK5. A decrease in GRK5 protein is observed in cells in which GRK5 shRNA is expressed. (E) Rat cortical primary neurons were cotransfected with plasmids containing E46KSynGFP and PLK2/GRK5 shRNAs or with the e.v. as a control (1:2 ratio) and were immunostained with anti-PS129 antibody. Quantification of anti-PS129 binding over GFP intensity (total aSyn levels) in individual neurons shows that only PLK2 shRNAs significantly decrease PS129 (n = 27–30 neurons per condition; Kruskal–Wallis and Dunn’s post hoc test; n.s., nonsignificant, ***P < 0.001). (F) Longitudinal survival of primary rat cortical neurons expressing Ch-tagged versions of aSyn (WT SynCh and the S129ASynCh, E46KSynCh, and E46KS129ASynCh mutants). The S129A mutant, which is PS129 incompetent, does not alter the risk of neuronal death (n = 500–650 neurons from two independent experiments; log-rank test; n.s., nonsignificant). All error bars represent 95% CIs.
Fig. 5.
Fig. 5.
PLK2-dependent PS129 does not explain the E46K-dependent toxicity. (A) Cumulative hazard estimates of primary rat cortical neurons coexpressing E46KSynD2 and PLK2 shRNAs (sh1PLK2 and sh2PLK2) (log-rank test; n = around 150 neurons per condition). (B) Quantification of PS129 relative to the D2 fluorescence intensity (total aSyn) by immunostaining individual neurons expressing E46KSynD2 and PLK2 shRNAs with the specific anti-PS129 antibody. Under the same conditions used in A, PLK2 shRNAs significantly reduced E46KSynD2 PS129 (Kruskal–Wallis and Dunn’s post hoc test; n = 18–26 neurons per condition). (C) Neurons transiently transfected with E46KSynD2 were treated with two doses of the PLK2 inhibitor previously tested and subjected to longitudinal survival analysis (log-rank test; n = 600–1,000 neurons from five independent experiments). (D) Longitudinal survival of neurons expressing aSyn WT or the pathological E46K mutation ± the S129A mutation (CPH analysis; n = 2,500 neurons per condition from seven independent experiments). All error bars indicate 95% CIs; n.s., nonsignificant, **P < 0.01, ***P < 0.001.
Fig. 6.
Fig. 6.
Experimental strategy to study the contribution of non–cell-autonomous mechanisms in neuronal death. (A) To assess the potential contribution of non–cell-autonomous mechanisms to neuronal death, we assessed how the risk of death in neurons expressing a control protein (i.e., GFP) is influenced by neighboring neurons expressing a toxic protein (i.e., Ch-tagged aSyn constructs). To that goal, we longitudinally imaged primary rat cortical neurons transiently transfected with control and toxic proteins in the same field. Shown is an example of a single tiled image of these neurons created with adjacent nonoverlapping images. Individual survival times were estimated for each individual neuron, and a CPH analysis was used to analyze how toxic neurons (red) influenced the risk of death of control neurons (green). (B) Magnified image of the area within the dashed circle in A showing toxic and control neurons within a 500-μm radius. (C) The number of toxic and control neurons within a 500-μm radius around a single control neuron. The number of red (toxic) neurons in a particular radius around each single GFP (control) neuron is the variable nr (in the example, nr = 12). The nr was calculated for each single GFP neuron in the tiled image at radii of 500 μm and 1,000 μm.
Fig. 7.
Fig. 7.
Neurons expressing APPswe/Lnd increase the risk of death of neighboring control neurons. (A) Primary rat cortical neurons were cotransfected with plasmids expressing APPswe/lnd or the empty vector (e.v.) and Ch and were immunostained with an APP-specific antibody. (B) Fluorescence intensity from Ch and from secondary antibodies recognizing APP was quantified in individual neurons. A correlation analysis was performed showing that Ch+ neurons expressed the APPswe/lnd protein compared with control conditions (e.v.). (C) Cumulative risk estimates of GFP-expressing neurons neighboring APP-expressing neurons transfected with a high dose of APP+Ch (APPhd+Ch) or control neurons (e.v.+Ch). CPH analysis of 250–300 neurons from two independent experiments: **P < 0.01. (D) Cox modeling of the time-dependent variation in the relative hazard in a population of neighboring APP-expressing neurons [GFP(APPhd+Ch)] with respect to a population of neighboring control neurons [GFP(e.v.+Ch)]. The main relative hazards at t = 0 and tvc are from Table S2 95% CIs.
Fig. S6.
Fig. S6.
Graphs showing the frequency (%) distribution of red neurons expressing Ch, SynCh, and E46KSynCh in a fixed radius (250 μm, 500 μm, or 1,000 μm) (nr) around each GFP+ neuron. (A) 250-μm radius. (B) 500-μm radius. (C) 1,000-μm radius. In radii lower than 500 μm, the frequency of GFP neurons without neurons around them is very high (around 46% of total neurons).
Fig. S7.
Fig. S7.
Evaluation of cell-to-cell aSyn spread in dying GFP control transfected cells neighboring E46KSynCh-expressing neurons. GFP living neurons that were dead in the subsequent 24 h were considered as “dying neurons.” Images from our longitudinal survival experiments enabled us to select dying GFP control neurons neighboring E46KSynCh neurons and to analyze whether they had red signal inside as a surrogate for potential uptake of aSyn species. (A) From a total of 100 dying control neurons analyzed, we found only two neurons with red signal apparently inside. (B) Confocal analysis of GFP-transfected cells neighboring Ch- or E46KSynCh-expressing neurons. Neurons were fixed at 8 dpt. (Top Row) Side view of 3D reconstructed images of GFP-transfected neurons with Ch-expressing neighboring neurons (Left) and with E46KSynCh-expressing neighboring neurons (Right). (Middle and Bottom Rows) Orthogonal views from different planes (x/y, x/z, and y/z) of confocal microscope images. Nuclei were stained with DAPI (blue); the green signal is GFP, and the red signal corresponds to Ch or E46KSynCh. Shown are representative images of GFP-expressing neurons neighboring Ch-expressing neurons (n = 30) or E46KSynCh-expressing neurons (n = 51). Red particles were not found inside GFP-expressing neurons. Similar results were obtained in neurons fixed at 4 dpt. (C) Confocal analysis of GFP-transfected nonneuronal cells neighboring E46KSynCh-expressing neurons. (Top) Side view of 3D reconstructed images from the GFP-transfected cell with E46KSynCh-expressing neighboring neurons. (Middle and Bottom) Orthogonal views from different planes (x/y, x/z, and y/z) of confocal microscope images. Nuclei were stained with DAPI (blue); the green signal represents GFP, and the red signal corresponds to Ch or E46KSynCh. Red particles were found inside GFP-expressing nonneuronal cells.

Similar articles

Cited by

References

    1. Halliday GM, Holton JL, Revesz T, Dickson DW. Neuropathology underlying clinical variability in patients with synucleinopathies. Acta Neuropathol. 2011;122:187–204. - PubMed
    1. Singleton AB, Farrer MJ, Bonifati V. The genetics of Parkinson’s disease: Progress and therapeutic implications. Mov Disord. 2013;28:14–23. - PMC - PubMed
    1. Satake W, et al. Genome-wide association study identifies common variants at four loci as genetic risk factors for Parkinson’s disease. Nat Genet. 2009;41:1303–1307. - PubMed
    1. Nalls MA, et al. International Parkinson’s Disease Genomics Consortium (IPDGC); Parkinson’s Study Group (PSG) Parkinson’s Research: The Organized GENetics Initiative (PROGENI); 23andMe; GenePD; NeuroGenetics Research Consortium (NGRC); Hussman Institute of Human Genomics (HIHG); Ashkenazi Jewish Dataset Investigator; Cohorts for Health and Aging Research in Genetic Epidemiology (CHARGE); North American Brain Expression Consortium (NABEC); United Kingdom Brain Expression Consortium (UKBEC); Greek Parkinson’s Disease Consortium; Alzheimer Genetic Analysis Group Large-scale meta-analysis of genome-wide association data identifies six new risk loci for Parkinson’s disease. Nat Genet. 2014;46:989–993. - PMC - PubMed
    1. Maraganore DM, et al. Genetic Epidemiology of Parkinson’s Disease (GEO-PD) Consortium Collaborative analysis of alpha-synuclein gene promoter variability and Parkinson disease. JAMA. 2006;296:661–670. - PubMed

Publication types

MeSH terms

LinkOut - more resources