. 2017 Sep 26;114(39):10338-10343.
doi: 10.1073/pnas.1702226114. Epub 2017 Sep 12.

On the origin of shape fluctuations of the cell nucleus

Affiliations

On the origin of shape fluctuations of the cell nucleus

Fang-Yi Chu et al. Proc Natl Acad Sci U S A. .

Abstract

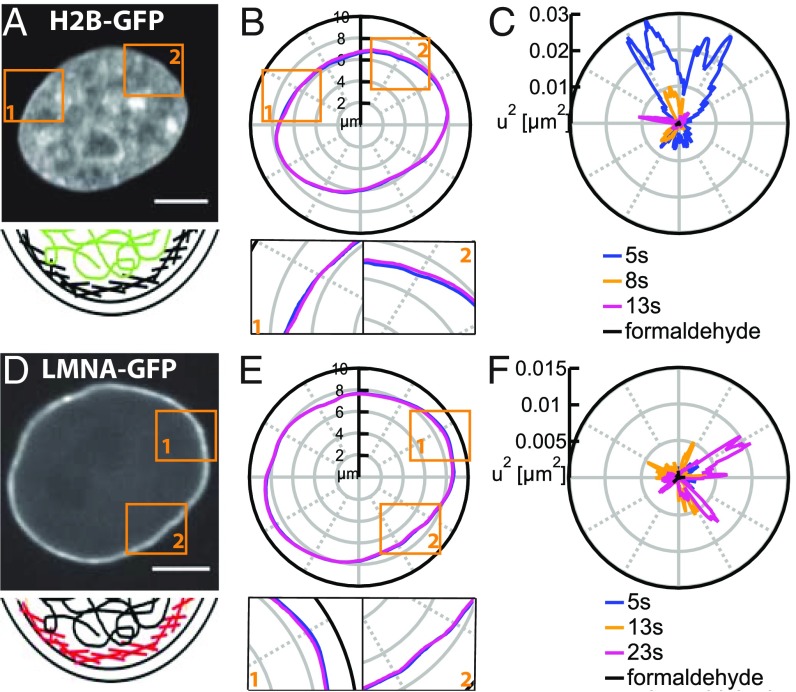
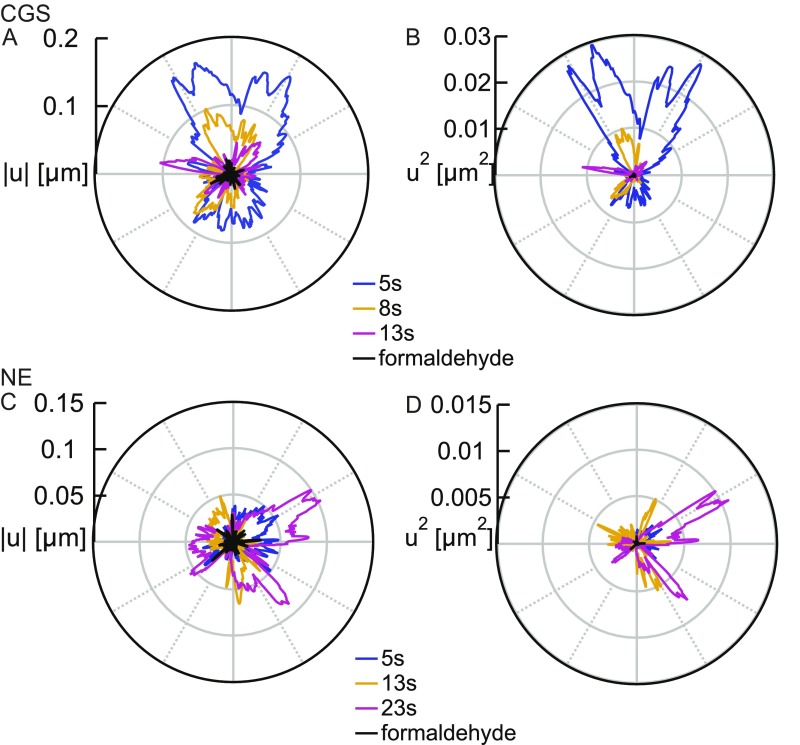
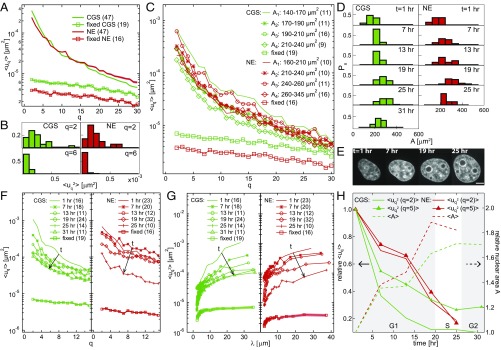
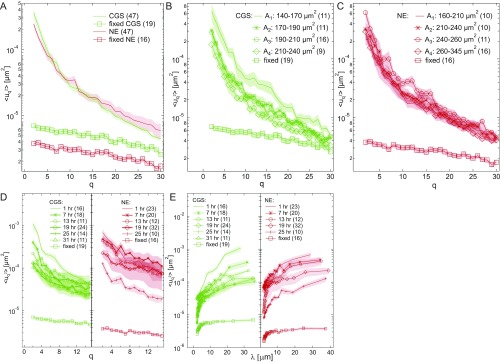
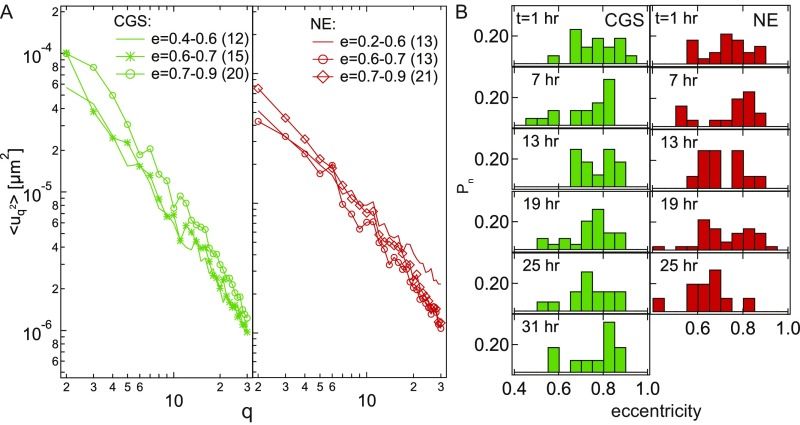
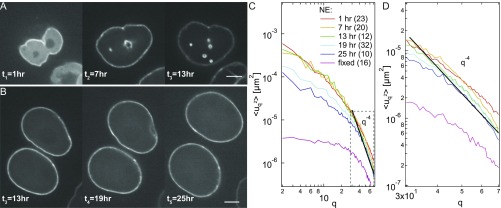
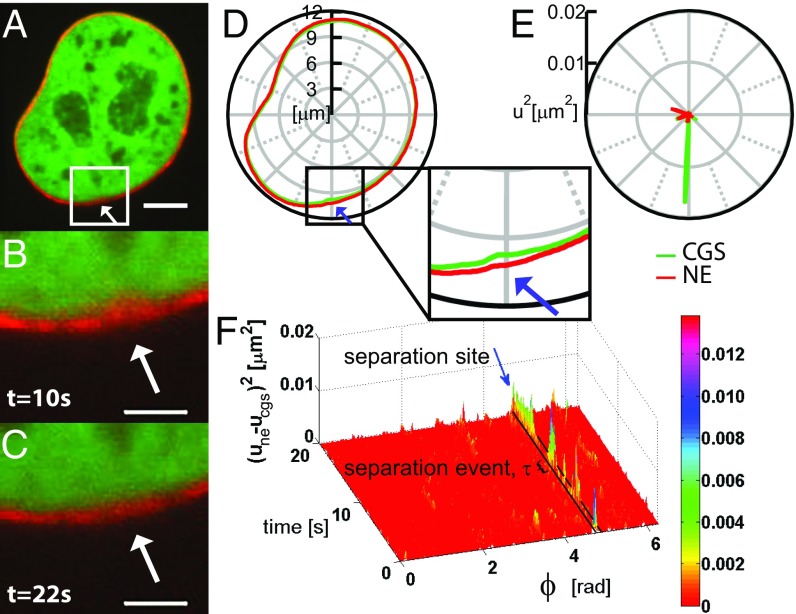
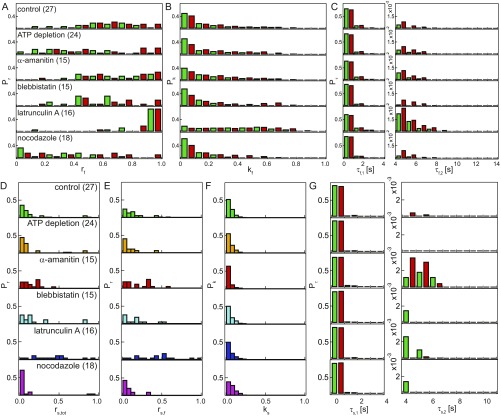
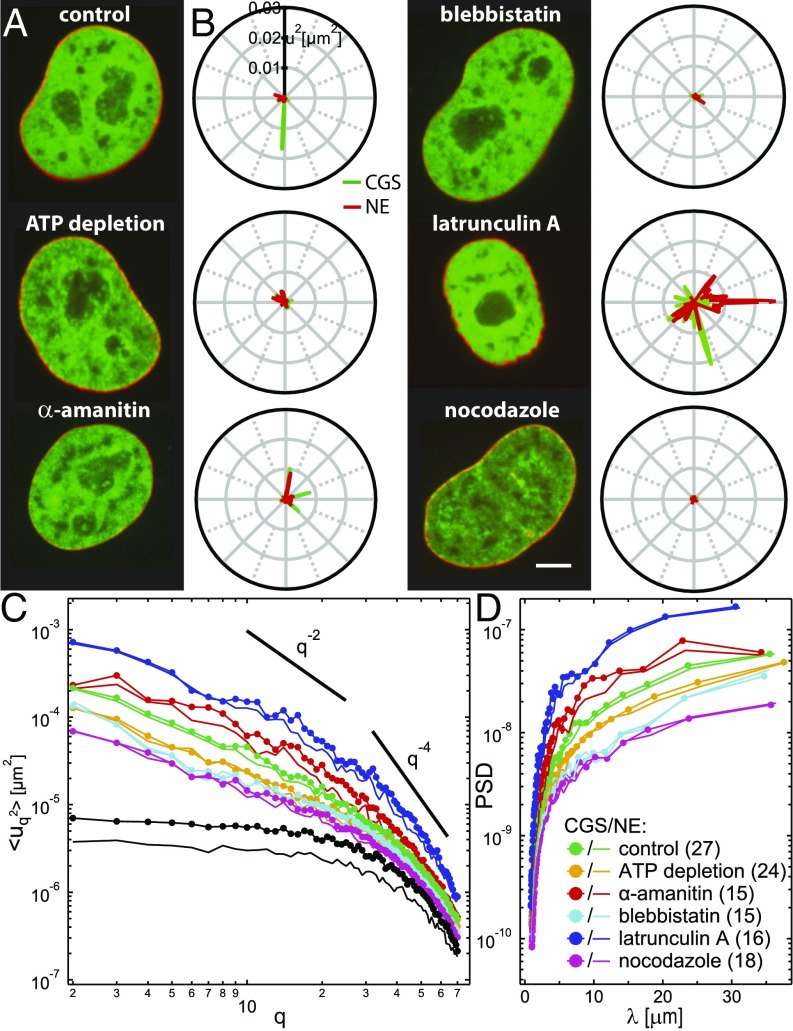
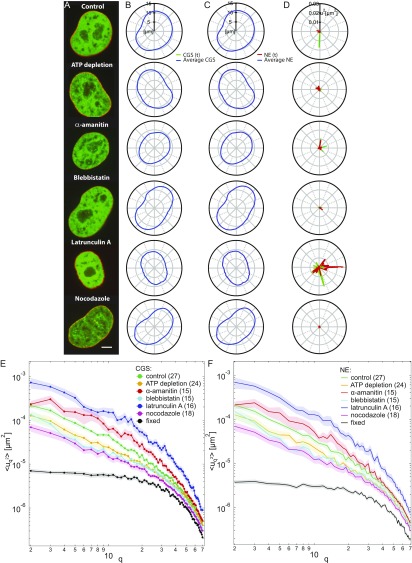
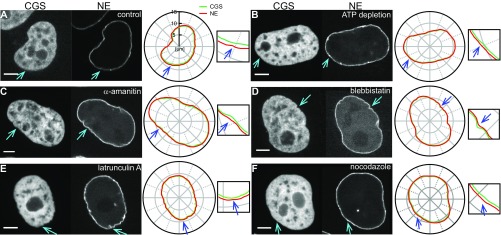
The nuclear envelope (NE) presents a physical boundary between the cytoplasm and the nucleoplasm, sandwiched in between two highly active systems inside the cell: cytoskeleton and chromatin. NE defines the shape and size of the cell nucleus, which increases during the cell cycle, accommodating for chromosome decondensation followed by genome duplication. In this work, we study nuclear shape fluctuations at short time scales of seconds in human cells. Using spinning disk confocal microscopy, we observe fast fluctuations of the NE, visualized by fluorescently labeled lamin A, and of the chromatin globule surface (CGS) underneath the NE, visualized by fluorescently labeled histone H2B. Our findings reveal that fluctuation amplitudes of both CGS and NE monotonously decrease during the cell cycle, serving as a reliable cell cycle stage indicator. Remarkably, we find that, while CGS and NE typically fluctuate in phase, they do exhibit localized regions of out-of-phase motion, which lead to separation of NE and CGS. To explore the mechanism behind these shape fluctuations, we use biochemical perturbations. We find the shape fluctuations of CGS and NE to be both thermally and actively driven, the latter caused by forces from chromatin and cytoskeleton. Such undulations might affect gene regulation as well as contribute to the anomalously high rates of nuclear transport by, e.g., stirring of molecules next to NE, or increasing flux of molecules through the nuclear pores.

Keywords: active materials; chromatin; nuclear envelope; nuclear lamina.


Conflict of interest statement

The authors declare no conflict of interest.

Figures

Fig. 1.
Fig. 1.
In vivo measurements of shape fluctuations of CGS and NE. (A) A micrograph of cell nucleus expressing H2B-GFP and schematics of the localization of chromatin (green) relative to the NE (black). (B) Contours of CGS at t = 5 and 13 s. Insets 1 and 2 present a zoomed in view. (C) Fluctuations u2 of CGS at t = 5, 8, and 13 s and for nucleus fixed with formaldehyde (black dot at the origin) demonstrating that our measurements are well above the noise floor. (D) A micrograph of cell nucleus expressing LMNA-GFP and schematics of the localization of lamins (red) relative to chromatin (black) and two lipid bilayers (black) comprising the NE. (E) Contours of the NE at t = 5 and 23 s. Insets 1 and 2 present a zoomed in view. (F) The u2 of NE at t = 5, 13, and 23 s. (Scale bar, 5 μm.)
Fig. S1.
Fig. S1.
In vivo measurements of the shape fluctuations of the CGS and NE. (A) Fluctuations u calculated for the contours of CGS from Fig. 1B at t = 5, 8, and 13 s. (B) Fluctuations u2 calculated for the contours of CGS from Fig. 1B at t = 5, 8, and 13 s. (C) Fluctuations u calculated for the NE contours from Fig. 1E at t = 5, 13, and 23 s. (D) Fluctuations u2 calculated for the NE contours from Fig. 1E at t = 5, 13, and 23 s. In addition, in AD, we plot u and u2 for samples fixed with formaldehyde (black), demonstrating that our measurements are well above the noise floor.
Fig. 2.
Fig. 2.
Shape fluctuations of CGS and NE are cell cycle-dependent. (A) Wavenumber-dependent fluctuations uq2 for CGS (H2B-GFP, green line, n = 47) and NE (LMNA-GFP, red line, n = 47). As a negative control, we calculated uq2 for both CGS (green square markers, n = 19) and NE (red square markers, n = 16) after fixing with formaldehyde. (B) Histograms of uq2 for CGS and NE, at q = 2 and 6, respectively. (C) The uq2 of CGS and NE calculated separately for four groups based on their nuclear area A for CGS (green) and NE (red); uq2 for CGS decreases with the increasing A. (D) Histograms of nuclear area A measured for a synchronized cell population at t = 1, 7, 13, 19, 25, and 31 h after metaphase. The nuclear size increases for both CGS and NE with the progressing cell cycle. (E) Micrographs of the same nucleus at four different times, showing its size increase during the cell cycle. (Scale bar, 5 μm.) (F) The uq2 of CGS (green) and NE (red) measured at different times during the cell cycle; uq2 for both CGS and NE exhibits a monotonous decrease with increasing time (highlighted by the black arrow) with p value less than 0.05 for t = 1, 13, 25, and 31 h. (G) uq2 of CGS (green) and NE (red) from F plotted as a function of wavelength λ=Lc/q, where Lc is the contour length. (H) Relative uq2, i.e., uq2 at different times normalized by uq2 at t = 1 h, for q = 2 and 5, for CGS (green) and NE (red) decreases during G1, S, and G2 (timing from ref. 18), while the relative nuclear area A, i.e., the nuclear area at different times normalized by the nuclear area at t = 1 h, increases. Error bars for A, C, and FG are shown in Fig. S2.
Fig. S2.
Fig. S2.
Shape fluctuations of CGS and NE are cell cycle-dependent. (A) Wavenumber-dependent fluctuations uq2 with error bars (SE) calculated for CGS (H2B-GFP, green solid line, n = 47) and NE (LMNA-GFP, red solid line, n = 47). (B) The uq2 of CGS calculated with error bars (SE) for four groups determined based on their measured nuclear area A. (C) The uq2 of NE calculated with error bars (SE) for four groups determined based on their measured nuclear area A. (D) Wavenumber-dependent fluctuations uq2 with error bars (SE) of CGS (green) and NE (red) measured at different times during the cell cycle; uq2 for both CGS and NE exhibits a monotonous decrease with increasing time during the cell cycle. (E) Wavenumber-dependent fluctuations uq2 as a function of wavelength λ with error bars (SE) of CGS (green) and NE (red) measured at different times during the cell cycle.
Fig. S3.
Fig. S3.
Influence of average nuclear shape on the nuclear shape fluctuations. (A) Wavenumber-dependent nuclear fluctuations uq2 for nuclei of different eccentricity e for both CGS and NE. (B) Histograms of nuclear eccentricity e for CGS (green) and NE (red) measured at t = 1, 7, 13, 19, 25, and 31 h after the metaphase. We find no correlation between the overall nuclear shape (described by eccentricity) and uq2.
Fig. S4.
Fig. S4.
Nuclear size increases with the cell cycle. (A) Micrographs of the same nucleus expressing LMNA-GFP taken at three different times during the cell cycle: t = 1, 7, and 13 h (where t = 0 h corresponds to the metaphase), showing a monotonous increase in the nuclear size with progressing cell cycle. (B) Micrographs of two cell nuclei expressing LMNA-GFP taken at three different times during cell cycle: t = 13, 19, and 25 h. (C) Wavenumber-dependent fluctuations uq2 of NE measured at different times during the cell cycle: t = 1, 7, 13, 19, and 25 h. A black solid line, q4, indicates that uq2 follows this type of behavior at large q values. (D) Inset from C shows that the part of uq2 spectra that follows the q4 behavior decreases with time, suggesting stiffening of the NE. (Scale bar, 5 μm.)
Fig. 3.
Fig. 3.
Simultaneous measurements of shape fluctuations of CGS and NE. (A) A micrograph of a nucleus expressing both H2B-mCherry (green) and LMNA-GFP (red) obtained using simultaneous two-color confocal microscopy. (B) Inset from A showing a site of local separation (highlighted by white arrow) of CGS and NE at t = 10 s, which disappears by (C) time t = 22 s. (D) Concurrent contours of CGS (H2B-mCherry) and NE (LMNA-GFP) obtained from A. (Inset) The region from B and C where CGS and NE locally separate (highlighted by blue arrow). (E) Fluctuations u2 for the contours of CGS and NE from D. (F) Visualization of the separation sites of CGS and NE, by plotting (uneucgs)2 as a function of polar angle ϕ and time t; une and ucgs are the deviations of the NE and CGS contours from their respective average contours. The black box highlighted by blue arrow demarks the temporal evolution of the separation site from D. The black bracket shows one separation event of duration τ. [Scale bar, (A) 5 μm; (B and C) 2 μm.]
Fig. S5.
Fig. S5.
Analysis of fluctuation sites upon different perturbations. (A) Histogram of ratio of fluctuation sites rf for each condition. Ratio of fluctuation sites was determined by counting the sites with fluctuation (u2>0) along the nuclear contour and normalized by its length. Green bars represent the fluctuations for CGS, where ucgs2>0, and red bars represent the fluctuations for NE, where une2>0. (B) Histograms of fluctuation rate kf at each condition. The rate of a fluctuation site was calculated by counting the time points with fluctuations u2>0 at that fluctuation site and normalized by the length of measurement (20 s). (C) Histogram of fluctuation duration τf for every condition; τf,1 shows the region of short duration, and τf,2 shows the region of long duration. (D) Histogram of ratio of separation sites rs,tot for each condition. Ratio of separation sites was determined by counting the sites with separation (ucgsune)20 along the nuclear contour and normalized by its length. (E) Histogram of the fraction of separation sites rs,f distribution calculated by normalizing data from D by the average value of rf obtained from A for each condition. (F) Histogram of separation rate ks at each condition. The rate of a separation site was calculated by counting the time points with separation at that separation site and normalized by the length of measurement (20 s). (G) Histogram of separation duration τs for every condition; τs,1 shows the region of short duration, and τs,2 shows the region of long duration. Green bars represent τs,2,cgs for (une2ucgs2)<0, and red bars represent the τs,2,ne for (une2ucgs2)>0.
Fig. 4.
Fig. 4.
Simultaneous measurements of shape fluctuations of CGS and NE upon biochemical perturbations. (A) Micrographs of cell nuclei expressing both H2B-mCherry (green) and LMNA-GFP (red) under the following conditions: control, after ATP depletion, and upon addition of α-amanitin, blebbistatin, latrunculin A, and nocodazole. (B) Fluctuations u2 of CGS (green) and NE (red) for each condition from A at one time point. Average and instantaneous contours for CGS and NE are shown in Fig. S6. (C) Wavenumber-dependent uq2 under the following conditions: control (n = 27), ATP depletion (n = 24), α-amanitin (n = 15), blebbistatin (n = 15), latrunculin A (n = 16), and nocodazole (n = 18) treatment. Black curves represent negative control by fixation with formaldehyde for CGS (markers) and NE (no markers). Solid black lines illustrate slopes q2 and q4. Error bars are shown in Fig. S6. (D) PSD of uq2 as a function of wavelength λ upon different perturbations. (Scale bar, 5 μm.)
Fig. 5.
Fig. 5.
Active and passive dynamics of CGS and NE. (A) Cartoon of a control cell (Top) and after actin depolymerization (Bottom). Inset illustrates the fluctuations of the NE caused by chromatin, Fch, microtubules, Fmt, and myosin II, Fmyo. (B) The ratio ρ=uq,pert2/uq,control2 shows the changes in fluctuations of CGS and NE upon different perturbations. (C) Cumulative plot of the passive contribution (baseline γ=ρpass) and relative active contributions γ=(uq,control2uq,pert2)/uq,control2 of chromatin, microtubules, and myosin II amounts to 1. (D) Teff for different perturbations.
Fig. S6.
Fig. S6.
Simultaneous measurements of shape fluctuations of CGS and NE upon biochemical perturbations. (A) Micrographs of cell nuclei simultaneously expressing H2B-mCherry (green) and LMNA-GFP (red) depicting nuclear phenotypes under the following conditions: control, after ATP depletion, and upon addition of α-amanitin, blebbistatin, latrunculin A, and nocodazole. (B) Average contour of CGS and instantaneous contour of CGS (H2B-GFP) at one time point for each perturbation. (C) Average contour of NE and instantaneous contour of NE (LMNA-GFP) at one time point for each perturbation. (D) Fluctuations u2 of CGS (green) and NE (red) calculated for each condition at one time point; u2 is strongly reduced upon ATP depletion as well as blebbistatin and nocodazole treatment, and u2 increases upon addition of latrunculin A. (E) The uq2 for CGS plotted with error bars (SE). (F) The uq2 for NE plotted with error bars (SE).
Fig. S7.
Fig. S7.
Example of separation sites exhibited upon different biochemical perturbations. Specifically, micrographs and instantaneous contours for CGS and NE are shown for (A) control, (B) after ATP depletion, and upon treatment with (C) α-amanitin, (D) blebbistatin, (E) latrunculin A, and (F) nocodazole. The separation sites are highlighted by blue arrows in the CGS and NE images and contours. (Scale bar, 5 μm.)
Fig. S8.
Fig. S8.
Control measurement of the contour fluctuations. (A) Image of the vesicle from ref. , which we used to test the correctness of our contour detection and fluctuation calculation algorithms (movie can be found in ref. 41). Adapted with permission from Loftus et al., Langmuir 29: 14588–14594, 2013. Copyright 2013 American Chemical Society. (B) Wavenumber-dependent fluctuations uq(t)2, which we measured for the vesicle from A. (C) Bending rigidity κ calculated for the vesicle from A.

Similar articles

Cited by

References

    1. Steen H, Lindmo T. Cellular and nuclear volume during the cell cycle of nihk 3025 cells. Cell Tissue Kinet. 1978;11:69–81. - PubMed
    1. Fidorra J, Mielke T, Booz J, Feinendegen L. Cellular and nuclear volume of human cells during the cell cycle. Radiat Environ Biophys. 1981;19:205–214. - PubMed
    1. Alberts B, et al. Molecular Biology of the Cell. Garland Sci; New York: 2014.
    1. Talwar S, Kumar A, Rao M, Menon G, Shivashankar G. Correlated spatio-temporal fluctuations in chromatin compaction states characterize stem cells. Biophys J. 2013;104:553–564. - PMC - PubMed
    1. Makhija E, Jokhun D, Shivashankar G. Nuclear deformability and telomere dynamics are regulated by cell geometric constraints. Proc Natl Acad Sci USA. 2015;13:E32–E40. - PMC - PubMed

Publication types

LinkOut - more resources