

Binding of NAD+-Glycohydrolase to Streptolysin O Stabilizes Both Toxins and Promotes Virulence of Group A Streptococcus
- PMID: 28900022
- PMCID: PMC5596348
- DOI: 10.1128/mBio.01382-17
Binding of NAD+-Glycohydrolase to Streptolysin O Stabilizes Both Toxins and Promotes Virulence of Group A Streptococcus
Abstract
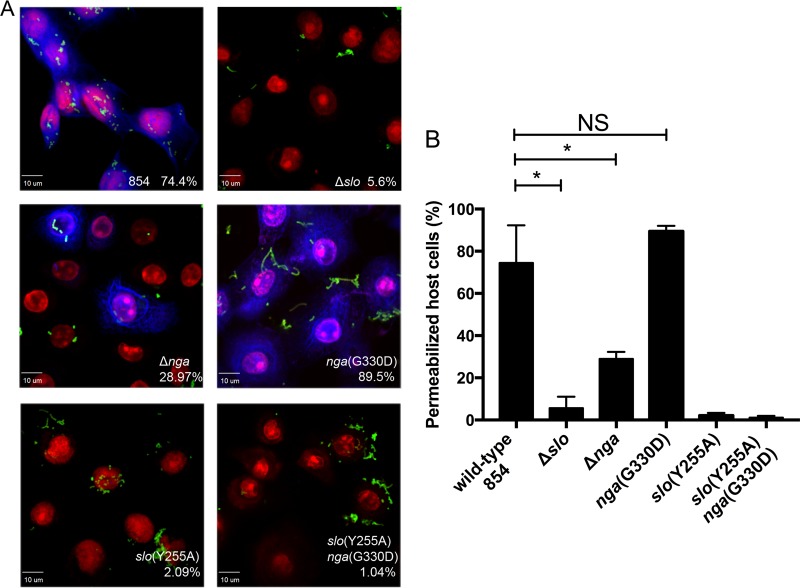
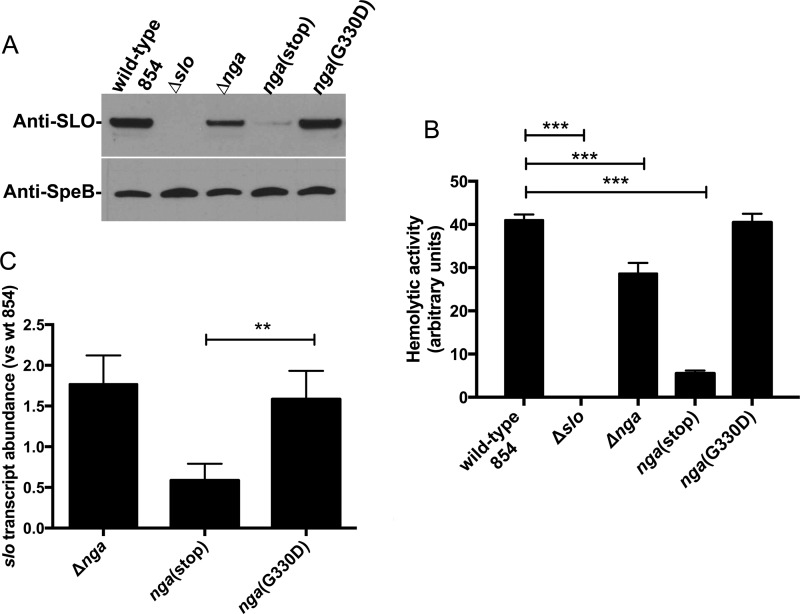
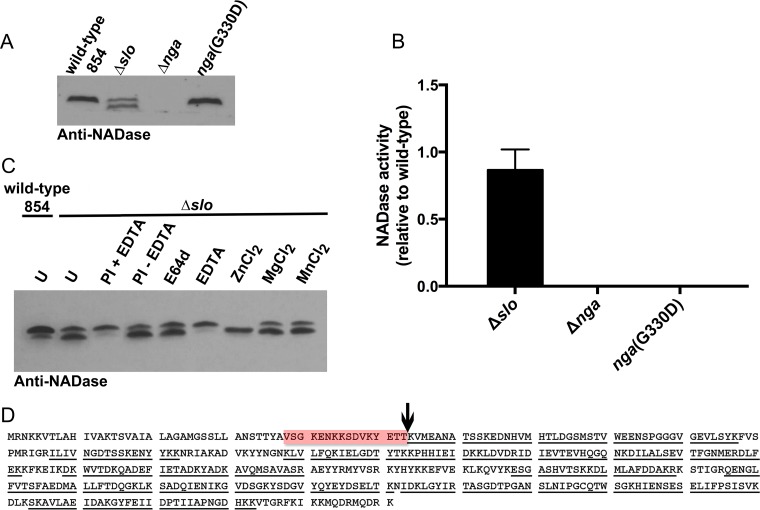
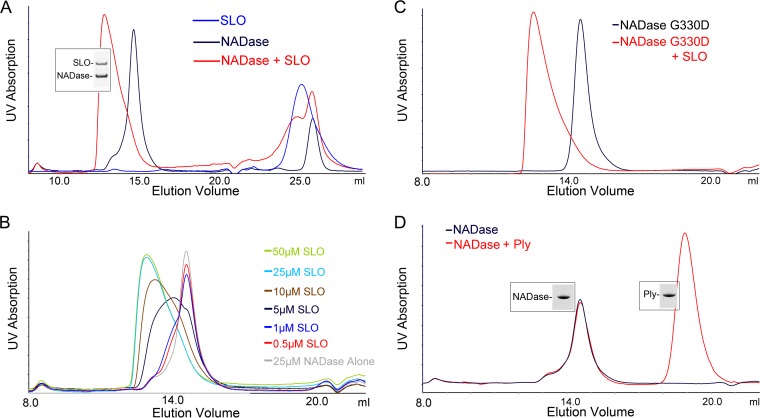
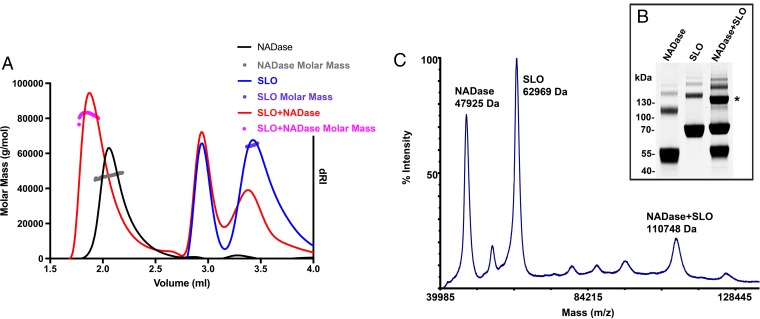
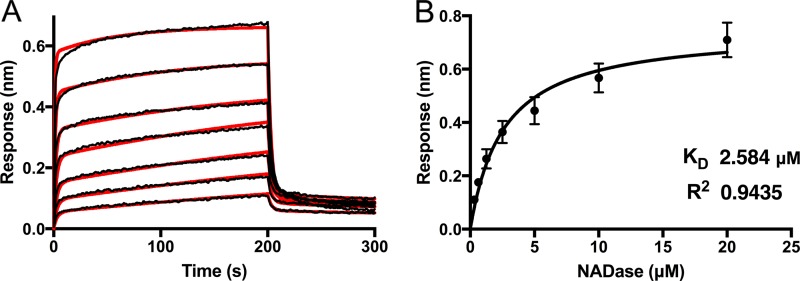
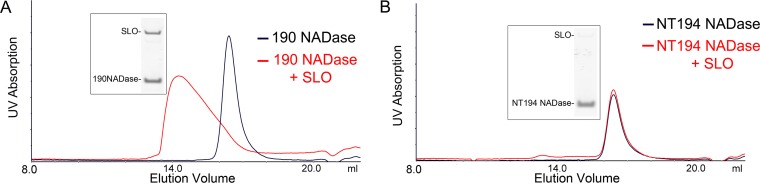
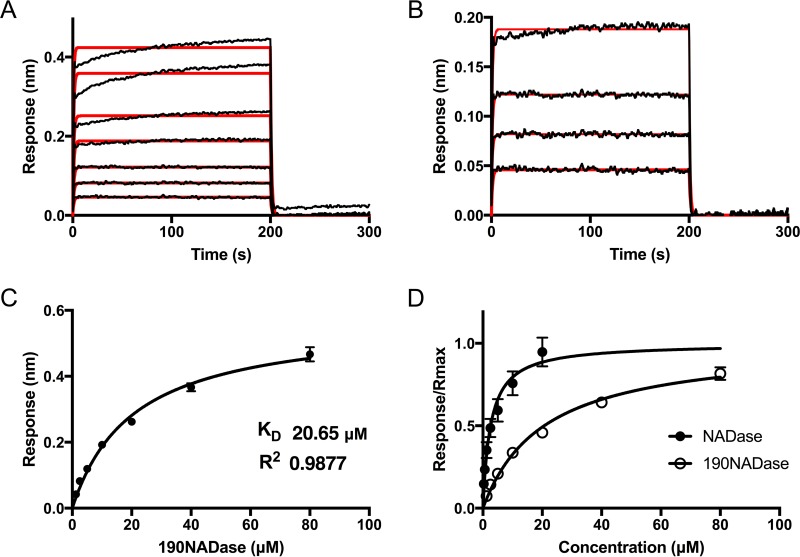
The globally dominant, invasive M1T1 strain of group A Streptococcus (GAS) harbors polymorphisms in the promoter region of an operon that contains the genes encoding streptolysin O (SLO) and NAD+-glycohydrolase (NADase), resulting in high-level expression of these toxins. While both toxins have been shown experimentally to contribute to pathogenesis, many GAS isolates lack detectable NADase activity. DNA sequencing of such strains has revealed that reduced or absent enzymatic activity can be associated with a variety of point mutations in nga, the gene encoding NADase; a commonly observed polymorphism associated with near-complete abrogation of activity is a substitution of aspartic acid for glycine at position 330 (G330D). However, nga has not been observed to contain early termination codons or mutations that would result in a truncated protein, even when the gene product contains missense mutations that abrogate enzymatic activity. It has been suggested that NADase that lacks NAD-glycohydrolase activity retains an as-yet-unidentified inherent cytotoxicity to mammalian cells and thus is still a potent virulence factor. We now show that expression of NADase, either enzymatically active or inactive, augments SLO-mediated toxicity for keratinocytes. In culture supernatants, SLO and NADase are mutually interdependent for protein stability. We demonstrate that the two proteins interact in solution and that both the translocation domain and catalytic domain of NADase are required for maximal binding between the two toxins. We conclude that binding of NADase to SLO stabilizes both toxins, thereby enhancing GAS virulence.IMPORTANCE The global increase in invasive GAS infections in the 1980s was associated with the emergence of an M1T1 clone that harbors a 36-kb pathogenicity island, which codes for increased expression of toxins SLO and NADase. Polymorphisms in NADase that render it catalytically inactive can be detected in clinical isolates, including invasive strains. However, such isolates continue to produce full-length NADase. The rationale for this observation is not completely understood. This study characterizes the binding interaction between NADase and SLO and reports that the expression of each toxin is crucial for maximal expression and stability of the other. By this mechanism, the presence of both toxins increases toxicity to keratinocytes and is predicted to enhance GAS survival in the human host. These observations provide an explanation for conservation of full-length NADase expression even when it lacks enzymatic activity and suggest a critical role for binding of NADase to SLO in GAS pathogenesis.
Keywords: NAD+-glycohydrolase; Streptococcus pyogenes; cholesterol-dependent cytolysin; pore-forming toxins; streptolysin O.
Copyright © 2017 Velarde et al.
Figures
Similar articles
-
Structure of the Streptococcus pyogenes NAD+ Glycohydrolase Translocation Domain and Its Essential Role in Toxin Binding to Oropharyngeal Keratinocytes.J Bacteriol. 2022 Jan 18;204(1):e0036621. doi: 10.1128/JB.00366-21. Epub 2021 Oct 25. J Bacteriol. 2022. PMID: 34694903 Free PMC article.
-
NAD+-Glycohydrolase Promotes Intracellular Survival of Group A Streptococcus.PLoS Pathog. 2016 Mar 3;12(3):e1005468. doi: 10.1371/journal.ppat.1005468. eCollection 2016 Mar. PLoS Pathog. 2016. PMID: 26938870 Free PMC article.
-
Intracellular Group A Streptococcus Induces Golgi Fragmentation To Impair Host Defenses through Streptolysin O and NAD-Glycohydrolase.mBio. 2021 Feb 9;12(1):e01974-20. doi: 10.1128/mBio.01974-20. mBio. 2021. PMID: 33563838 Free PMC article.
-
Streptolysin S-like virulence factors: the continuing sagA.Nat Rev Microbiol. 2011 Aug 8;9(9):670-81. doi: 10.1038/nrmicro2624. Nat Rev Microbiol. 2011. PMID: 21822292 Free PMC article. Review.
-
The Emergence of Hypervirulent M1T1 Clone of Group A Streptococcus via Genetic Recombination and Host Selection.Curr Issues Mol Biol. 2019;32:435-472. doi: 10.21775/cimb.032.435. Epub 2019 Jun 5. Curr Issues Mol Biol. 2019. PMID: 31166177 Review.
Cited by
-
Cholesterol-dependent cytolysins impair pro-inflammatory macrophage responses.Sci Rep. 2018 Apr 24;8(1):6458. doi: 10.1038/s41598-018-24955-2. Sci Rep. 2018. PMID: 29691463 Free PMC article.
-
Streptococcus pyogenes NAD+-Glycohydrolase Reduces Skeletal Muscle βNAD+ Levels Independently of Streptolysin O.Microorganisms. 2022 Jul 21;10(7):1476. doi: 10.3390/microorganisms10071476. Microorganisms. 2022. PMID: 35889195 Free PMC article.
-
The Role of Streptococcal and Staphylococcal Exotoxins and Proteases in Human Necrotizing Soft Tissue Infections.Toxins (Basel). 2019 Jun 11;11(6):332. doi: 10.3390/toxins11060332. Toxins (Basel). 2019. PMID: 31212697 Free PMC article. Review.
-
Tailored liposomal nanotraps for the treatment of Streptococcal infections.J Nanobiotechnology. 2021 Feb 15;19(1):46. doi: 10.1186/s12951-021-00775-x. J Nanobiotechnology. 2021. PMID: 33588835 Free PMC article.
-
Pathogenesis, epidemiology and control of Group A Streptococcus infection.Nat Rev Microbiol. 2023 Jul;21(7):431-447. doi: 10.1038/s41579-023-00865-7. Epub 2023 Mar 9. Nat Rev Microbiol. 2023. PMID: 36894668 Free PMC article. Review.
References
Publication types
MeSH terms
Substances
Grants and funding
LinkOut - more resources
Full Text Sources
Other Literature Sources
