. 2017 Sep 12;7(1):11289.
doi: 10.1038/s41598-017-10637-y.

The lipid-sensor TREM2 aggravates disease in a model of LCMV-induced hepatitis

Affiliations

The lipid-sensor TREM2 aggravates disease in a model of LCMV-induced hepatitis

Lindsay Kosack et al. Sci Rep. .

Abstract

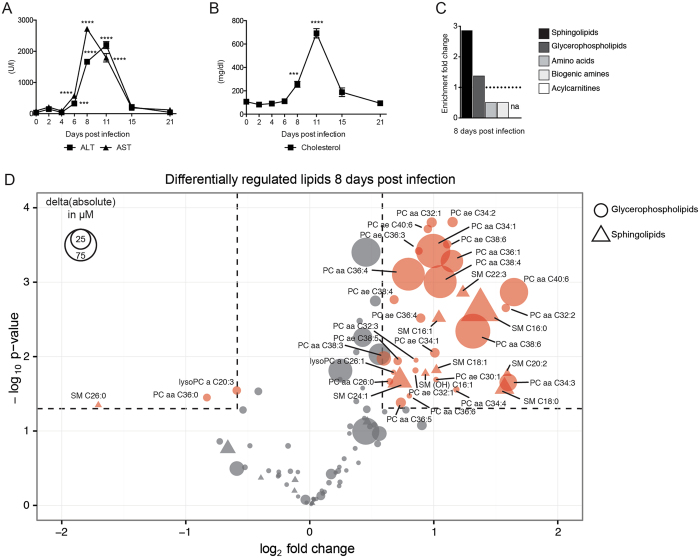
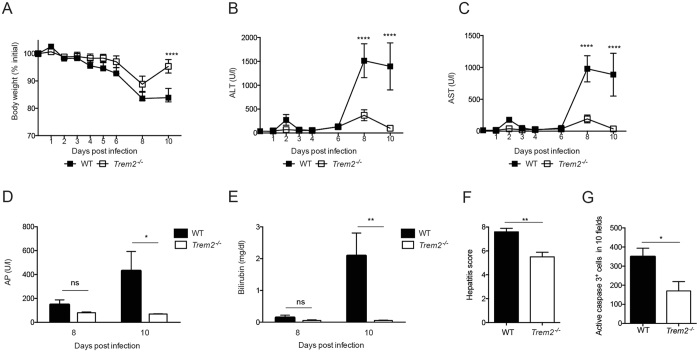
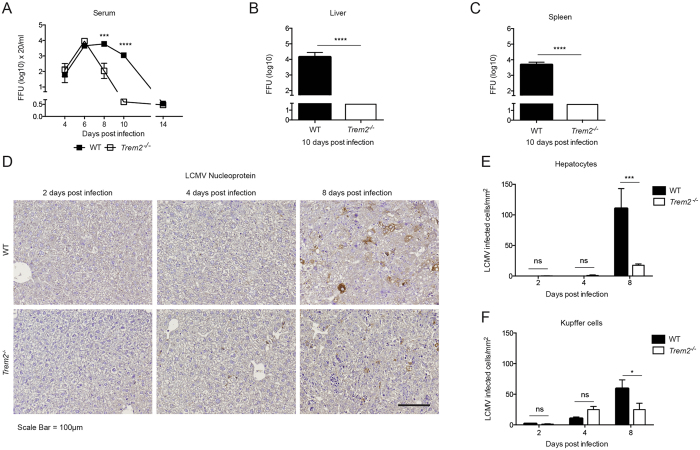
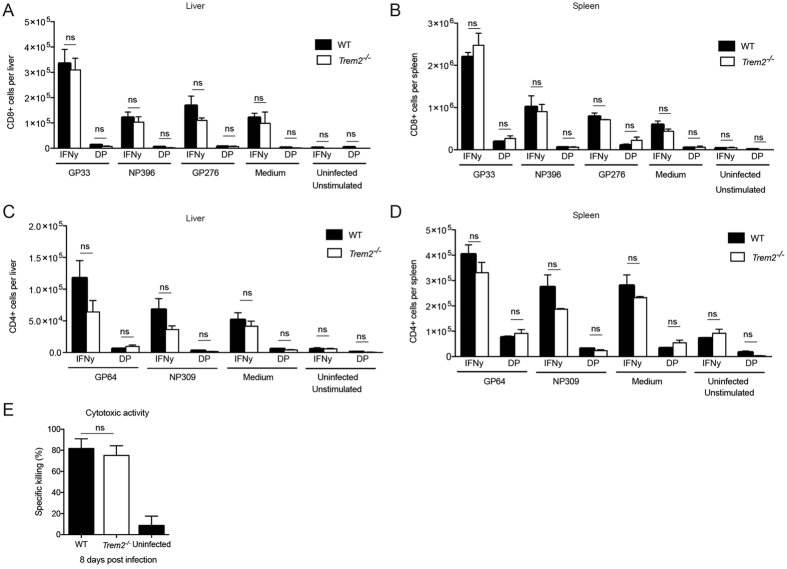
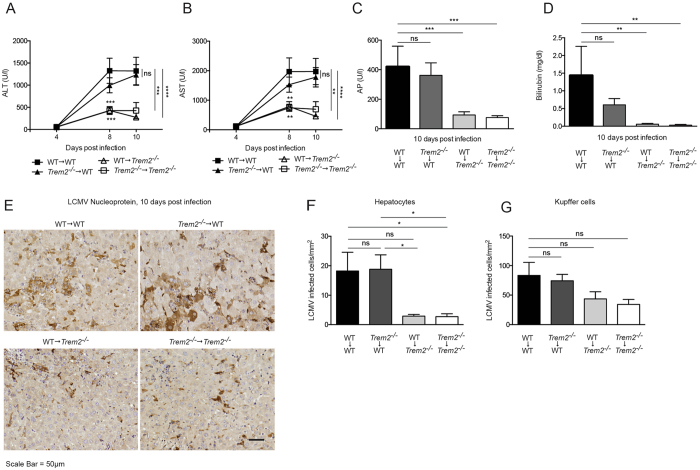
Lipid metabolism is increasingly being appreciated to affect immunoregulation, inflammation and pathology. In this study we found that mice infected with lymphocytic choriomeningitis virus (LCMV) exhibit global perturbations of circulating serum lipids. Mice lacking the lipid-sensing surface receptor triggering receptor expressed on myeloid cells 2 (Trem2 -/-) were protected from LCMV-induced hepatitis and showed improved virus control despite comparable virus-specific T cell responses. Non-hematopoietic expression of TREM2 was found to be responsible for aggravated hepatitis, indicating a novel role for TREM2 in the non-myeloid compartment. These results suggest a link between virus-perturbed lipids and TREM2 that modulates liver pathogenesis upon viral infection. Targeted interventions of this immunoregulatory axis may ameliorate tissue pathology in hepatitis.


Conflict of interest statement

The authors declare that they have no competing interests.

Figures

Figure 1
Figure 1
LCMV infection induces global changes in the composition of serum metabolites. WT mice were infected with LCMV strain WE, and serum was collected at various time-points post infection (AD). Serum kinetics of (A) alanine aminotransferase (ALT) and aspartate aminotransferase (AST), and (B) cholesterol (n = 5 mice per group). (A,B) Statistical significance was calculated by One-way ANOVA with Bonferroni correction comparing the different time points to day 0. Symbols in (A,B) represent the mean ± SEM. For targeted metabolomics (C,D), serum from uninfected mice and mice that were infected with LCMV 8 days previously was used (n = 4 mice per group). (C) Fold enrichment of the metabolite classes (glycerophospolipids, sphingolipids, biogenic amines, amino acids, acylcarnitines) was calculated using the relative proportion (number of significant metabolites from a specific metabolite class divided by the number of all significant metabolites measured) normalized to the number of measured metabolites of a specific metabolite class divided by the number of all measured metabolites. Members of the acylcarnitine class did not pass the threshold of fold-change >1.5 and p-value < 0.05. (D) Bubble plot of individual glycerophospholipids (circle) and sphingolipids (triangle) depicting fold-change (x-axis), p-value (y-axis) and the absolute change (size of symbols). Statistical significance of changed individual metabolites in sera of infected vs. uninfected mice was calculated with unpaired t-test (C,D). Red symbols in (D) reflect metabolites with a fold-change >1.5 and a p-value < 0.05.
Figure 2
Figure 2
Trem2 −/− mice are protected against LCMV-induced hepatitis. WT and Trem2 −/− mice were infected with LCMV strain WE. (A) Body weight was monitored after LCMV infection (n = 5 mice per group, representative of ≥ two independent experiments). (B,C) Serum kinetics of alanine aminotransferase (ALT) (B) and aspartate aminotransferase (AST) (C) were measured after LCMV infection (n = 5 mice per group, representative of ≥ two independent experiments). (D,E) Serum levels of alkaline phosphatase (AP) (D) and bilirubin (E) were measured eight and ten days post infection (n = 5 mice per group, representative of two independent experiments). (F) Liver sections of infected WT and Trem2 −/− were histopathologically scored (see Methods; n = 5 mice per group). (G) Liver sections of infected WT and Trem2 −/− were stained for cleaved Caspase 3 and the number of positive cells in 10 fields was quantified (n = 4 mice per group). Statistical significance was calculated by (AE) Two-way ANOVA with Bonferroni correction or by (F,G) unpaired t-test. Symbols respectively bars represent the mean ± SEM.
Figure 3
Figure 3
Trem2 −/− mice show improved virus clearance compared to WT mice. WT and Trem2 −/− mice were infected with LCMV strain WE. (AC) Viral loads from serum (A), liver (B) and spleen (C) were quantified by immunological focus assay (n = 4–5 mice per group, representative of two independent experiments (B,C), data pooled from two independent experiments (A). (D,F) Liver sections from infected WT and Trem2 −/− mice were stained for LCMV nucleoprotein (NP). Representative images of 3 to 4 mice per condition are shown in (D) and NP+ hepatocytes and NP+ Kupffer cells were quantified (E,F). Scale bar represents 100 μM. Statistical significance was calculated by (A,E,F) Two-way ANOVA with Bonferroni correction or by (B,C) unpaired t-test. Symbols respectively bars represent the mean ± SEM.
Figure 4
Figure 4
WT and Trem2 −/− mice show indistinguishable T cell responses. WT and Trem2 −/− mice were infected with LCMV strain WE. (A,B) Single cell suspensions of liver and spleen were restimulated ex vivo with peptides GP33–41, NP396–404 and GP276–286. CD8+ T cells producing IFNγ and double-producing (DP) IFNγ and TNFα were quantified in the liver (A) and spleen (B) eight days post infection (n = 3 mice per group). (C,D) Single cell suspensions of liver and spleen were restimulated ex vivo with peptides GP64–80 and NP309–328. CD4+ T cells producing IFNγ and double-producing IFNγ and TNFα were quantified in the liver (C) and spleen (D) eight days post infection (n = 3 mice per group). Statistical significance was calculated by unpaired t-test. Bars represent the mean ± SEM. (E) Eight days post infection, virus-specific cytotoxic activity of CD8+ T cells from WT and Trem2 −/− mice was measured using an in vivo cytotoxicity assay (n = 3–4 mice per group). Statistical significance was calculated by unpaired t-test. Bars represent the mean ± SEM.
Figure 5
Figure 5
Non-hematopoietic TREM2 aggravates LCMV-induced hepatitis. (AG) Chimeric mice were generated by reciprocal transfer of WT and Trem2 −/− bone marrow and subsequently infected with LCMV strain WE. (A,B) Serum kinetics of alanine aminotransferase (ALT) (A) and aspartate aminotransferase (AST) (B) were measured after LCMV infection (n = 8–9 mice per group, data pooled from two similar experiments). (C,D) Serum levels of alkaline phosphatase (AP) (C) and bilirubin (D) were measured ten days post infection (n = 8–9 mice per group, data pooled from two similar experiments). (EG) Liver sections from infected mice were stained for LCMV nucleoprotein. Representative images are shown in (E) and LCMV+ hepatocytes and Kupffer cells were quantified (F,G) (n = 8–9 mice per group, data pooled from two similar experiments harvested at 10 respectively 12 days post infection). Scale bar represents 50 μM. Statistical significance was calculated by (A–D) Two-way or by (F,G) One-way ANOVA with Bonferroni correction. Symbols respectively bars represent the mean ± SEM.

References

    1. Rouse BT, Sehrawat S. Immunity and immunopathology to viruses: what decides the outcome? Nature reviews. Immunology. 2010;10:514–526. doi: 10.1038/nri2802. - DOI - PMC - PubMed
    1. Medzhitov R, Schneider DS, Soares MP. Disease tolerance as a defense strategy. Science. 2012;335:936–941. doi: 10.1126/science.1214935. - DOI - PMC - PubMed
    1. Litvak V, et al. A FOXO3-IRF7 gene regulatory circuit limits inflammatory sequelae of antiviral responses. Nature. 2012;490:421–425. doi: 10.1038/nature11428. - DOI - PMC - PubMed
    1. Norata GD, et al. The Cellular and Molecular Basis of Translational Immunometabolism. Immunity. 2015;43:421–434. doi: 10.1016/j.immuni.2015.08.023. - DOI - PubMed
    1. O’Neill LA, Pearce EJ. Immunometabolism governs dendritic cell and macrophage function. The Journal of experimental medicine. 2016;213:15–23. doi: 10.1084/jem.20151570. - DOI - PMC - PubMed

Publication types

MeSH terms