. 2017 Sep 12;7(1):11262.
doi: 10.1038/s41598-017-11361-3.

Structural and functional insights into the periplasmic detector domain of the GacS histidine kinase controlling biofilm formation in Pseudomonas aeruginosa

Affiliations

Structural and functional insights into the periplasmic detector domain of the GacS histidine kinase controlling biofilm formation in Pseudomonas aeruginosa

Ahmad Ali-Ahmad et al. Sci Rep. .

Abstract

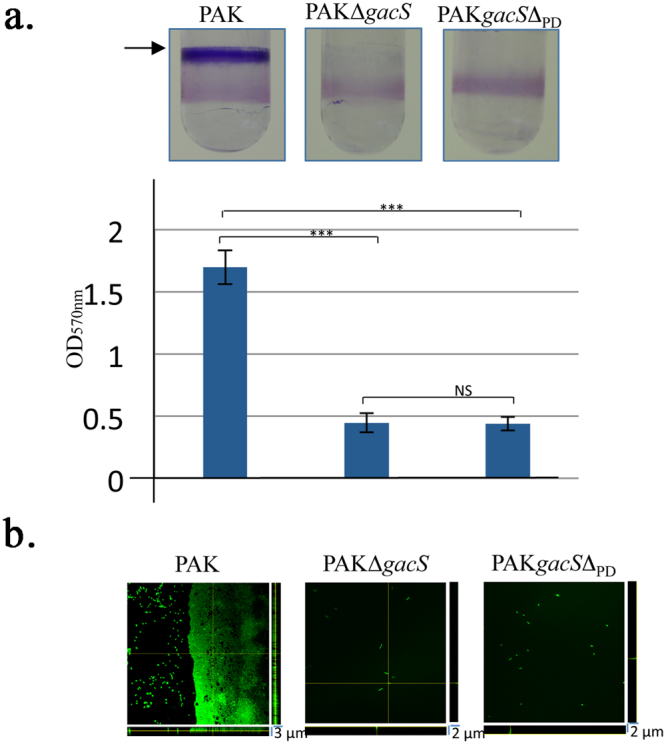
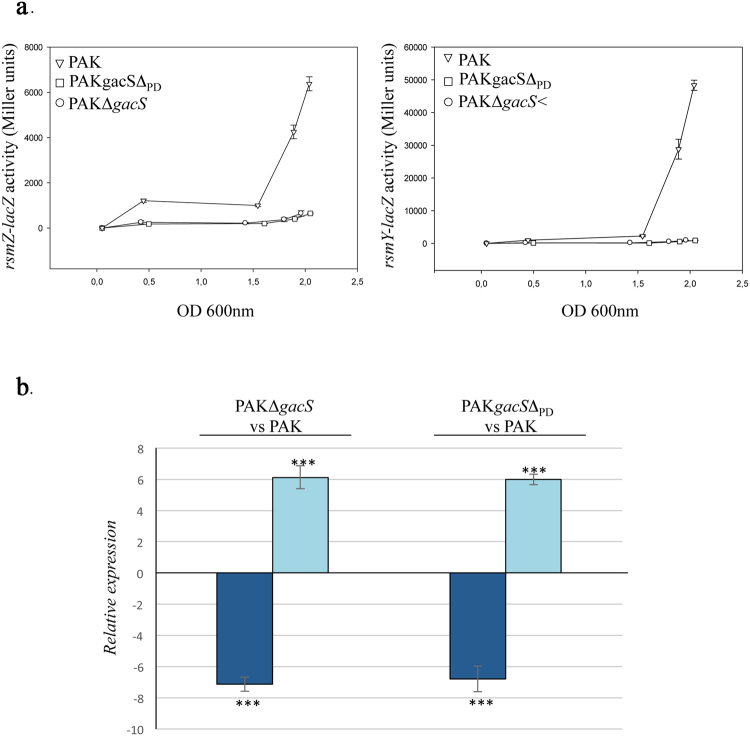
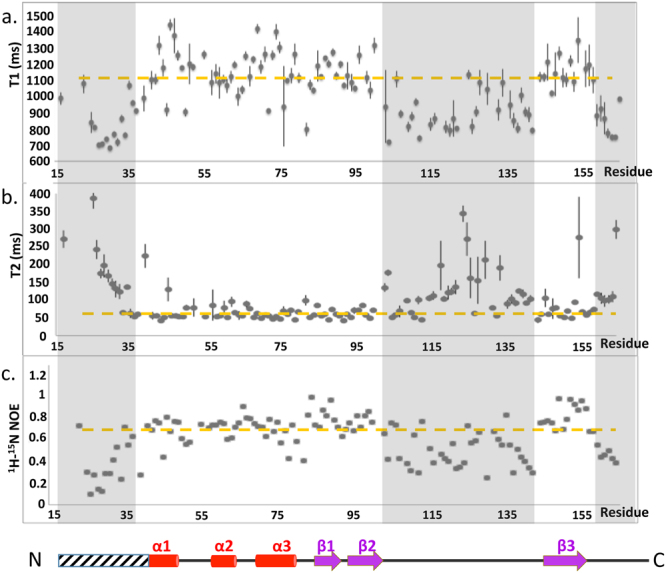
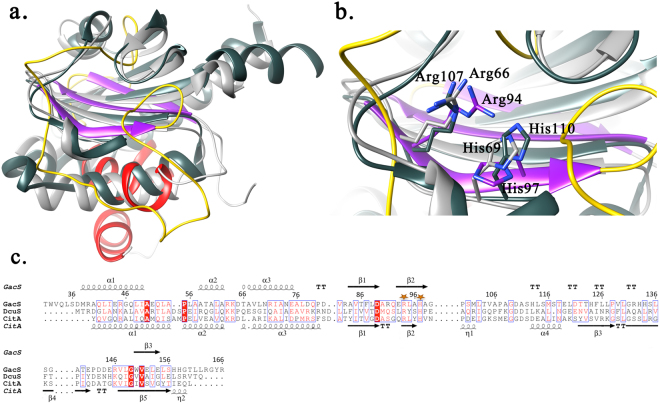
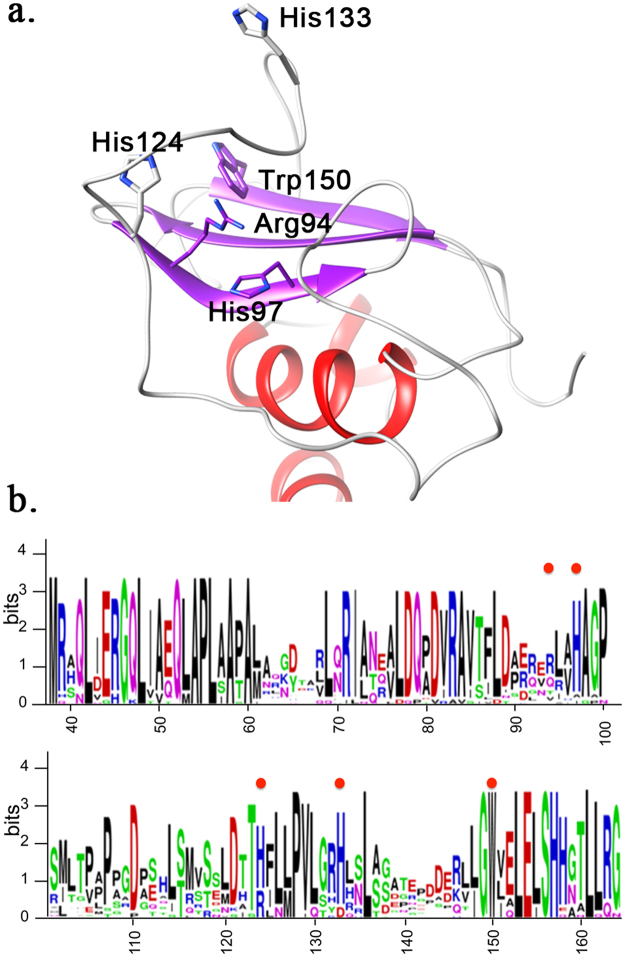
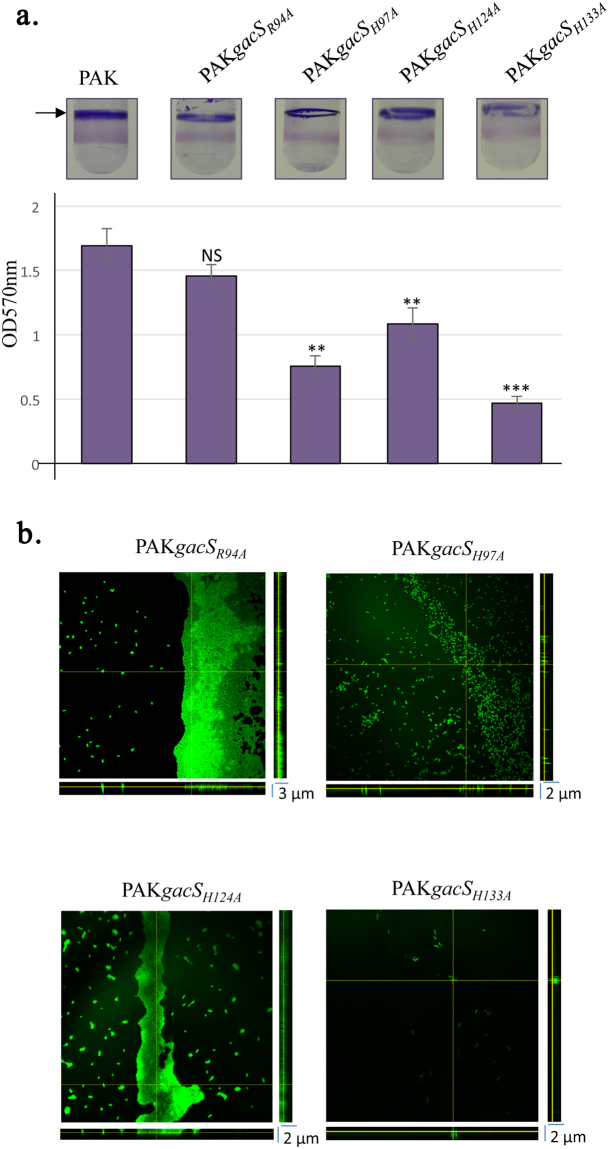
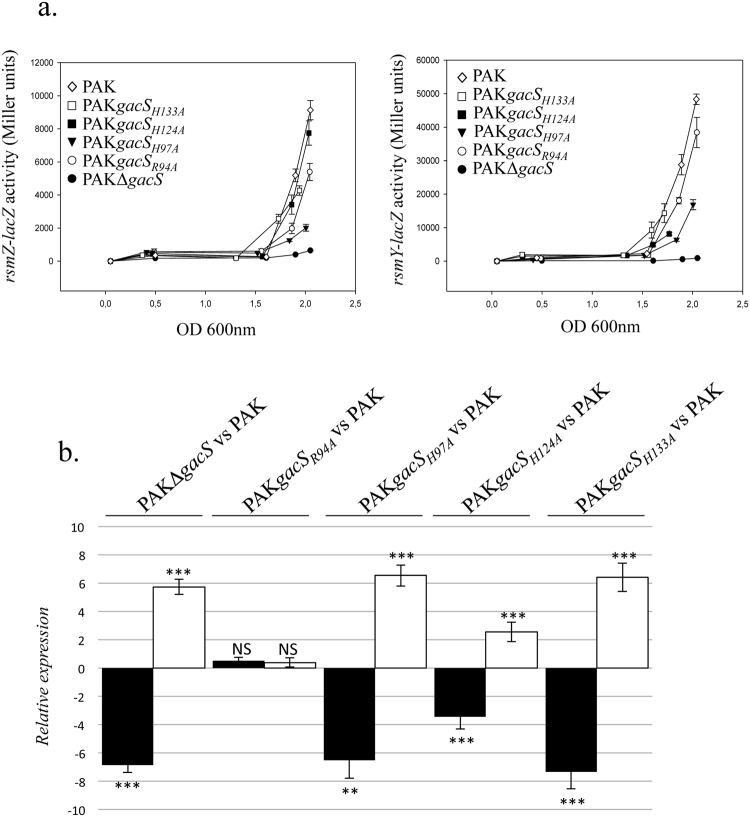
Pseudomonas aeruginosa is an opportunistic pathogenic bacterium responsible for both acute and chronic infections and has developed resistance mechanisms due to its ability to promote biofilm formation and evade host adaptive immune responses. Here, we investigate the functional role of the periplasmic detector domain (GacSPD) from the membrane-bound GacS histidine kinase, which is one of the key players for biofilm formation and coordination of bacterial lifestyles. A gacS mutant devoid of the periplasmic detector domain is severely defective in biofilm formation. Functional assays indicate that this effect is accompanied by concomitant changes in the expression of the two RsmY/Z small RNAs that control activation of GacA-regulated genes. The solution NMR structure of GacSPD reveals a distinct PDC/PAS α/β fold characterized by a three-stranded β-sheet flanked by α-helices and an atypical major loop. Point mutations in a putative ligand binding pocket lined by positively-charged residues originating primarily from the major loop impaired biofilm formation. These results demonstrate the functional role of GacSPD, evidence critical residues involved in GacS/GacA signal transduction system that regulates biofilm formation, and document the evolutionary diversity of the PDC/PAS domain fold in bacteria.


Conflict of interest statement

The authors declare that they have no competing interests.

Figures

Figure 1
Figure 1
Deletion of the GacS periplasmic detection domain affects biofilm formation. (a) Biofilm production in glass tubes (upper panel) is illustrated and quantified after crystal violet-staining (lower panel). Biofilm levels represent mean values (with error bars) obtained from three independent experiments. *, **, *** and ns refer to p < 0.05, p < 0.01, p < 0.001 and non-significant difference, respectively, according to the Wilcoxon-Mann-Whitney tests. (b) Biofilm formation is monitored by confocal laser scanning microscopy after 12 h. The extracted z images and their respective xy and xz planes are shown.
Figure 2
Figure 2
Effect of the deletion of the GacS detection domain on rsm, T3SS and T6SS gene expression. (a) Activities of the rsmZ–lacZ (left) and rsmY–lacZ (right) transcriptional chromosomal fusions were monitored at different growth stages in the PAK WT (open triangle), PAKΔgacS (open square) or PAKgacSΔPD (open circle) strain. The corresponding β-galactosidase activities are expressed in Miller units as the mean values (with error bars) of three independent experiments. (b) Transcript levels of VgrG1b (T6SS; dark blue bar) and ExoS (T3SS; light blue bar) were monitored in the PAK, PAK∆gacS and PAKgacSΔPD strains using RT-qPCR; fold change is displayed for the two mutant strains compared to PAK strain. *, ** and *** refer to p < 0.05, p < 0.01 and p < 0.001, respectively, according to the moderated t-tests.
Figure 3
Figure 3
NMR solution structure of GacSPD. (a) A superimposition of 20 representative structures of GacSPD corresponding to the minimal rmsd of all protein backbone N, Cα and CO atoms. (b) GacSPD lowest-energy structure. The structure contains a central β-sheet containing three β-strands (β1 84–89, β2 93–98 and β3 150–154) and three N-terminal α-helices (α1 38–50, α2 57–63 and α3 65–76). A major loop, indicated by a black arrow, links β2 to β3 and wraps the apical side of the β-sheet. The N- and C-termini are labelled. (c) Topology scheme of GacSPD.
Figure 4
Figure 4
15N NMR backbone relaxation data of GacSPD. (a) Per residue 15N T1 longitudinal relaxation times. (b) Per residue 15N T2 transverse relaxation times. (c) Per residue heteronuclear NOE ratios along with the location of GacSPD secondary structural elements shown as red cylinder for α-helix and violet arrow for β-strand.
Figure 5
Figure 5
Structural comparison. (a) Superimposition of GacSPD (colored secondary structure) and two structural homologues, E. coli DcuSp (dark grey), and K. pneumonia CitAp (light grey). (b) Close-up views of the conservation pattern made by the two positively-charged residues between GacSPD, CitAp and DcuSp. (c) Structural sequence alignment of GacSPD, CitAp and DcuSp. The conserved Arg and His residues are highlighted with orange stars.
Figure 6
Figure 6
Mutation locations in GacSPD solution structure. (a) A GacSPD cartoon representation with the selected mutated residues shown as sticks. (b) Multiple sequence alignment of 227 GacS periplasmic detector domains from the Pseudomonas Genus. The logo representation was generated with the Skylign web-server. Location of the mutated residues (Arg94, His97, His124, His133 and Trp150) is indicated by a red dot.
Figure 7
Figure 7
Effect of mutations in the GacS detection domain on biofilm formation. (a) Biofilm production in glass tubes (upper panel) is illustrated and quantified after crystal violet staining (lower panel). The corresponding levels of biofilm production represent means values (with error bars) obtained from three independent experiments. *, **, *** and ns referred to p < 0.05, p < 0.01 and p < 0.001 and non-significant difference, respectively, according to the Wilcoxon-Mann-Whitney tests. (b) Biofilm formation monitored by confocal laser scanning microscopy after 12 h. Extracted z images and their respective xy and xz planes are shown.
Figure 8
Figure 8
Effect of mutations in the GacS detection domain on rsm genes, T3SS and T6SS expression. (a) Activities of the rsmZ–lacZ (left panel) and rsmY–lacZ (right panel) transcriptional chromosomal fusions were monitored at different growth stages in the PAKWT, PAKΔgacS, PAKgacS R94A, PAKgacS H97A, PAKgacS H124A PAKgacS H133A strains. The corresponding β-galactosidase activities are expressed in Miller units and correspond to mean values (with error bars) obtained from three independent experiments. (b) Transcript levels of VgrG1b (T6SS; black bar) and ExoS (T3SS; white bar) were monitored in the PAK, PAKΔgacS, PAKgacS R94A, PAKgacS H97A, PAKgacS H124A and PAKgacS H133A strains using RT-qPCR and fold change is displayed for the four mutant strains compared to the PAK strain. *, ** and *** refer to p < 0.05, p < 0.01 and p < 0.001, respectively, according to the moderated t-tests.

References

    1. Stock AM, Robinson VL, Goudreau PN. Two-component signal transduction. Annu Rev Biochem. 2000;69:183–215. doi: 10.1146/annurev.biochem.69.1.183. - DOI - PubMed
    1. Jung K, Fried L, Behr S, Heermann R. Histidine kinases and response regulators in networks. Curr Opin Microbiol. 2012;15:118–124. doi: 10.1016/j.mib.2011.11.009. - DOI - PubMed
    1. Cheung J, Hendrickson WA. Sensor domains of two-component regulatory systems. Current opinion in microbiology. 2010;13:116–123. doi: 10.1016/j.mib.2010.01.016. - DOI - PMC - PubMed
    1. Zhang Z, Liu Q, Hendrickson WA. Crystal structures of apparent saccharide sensors from histidine kinase receptors prevalent in a human gut symbiont. FEBS Journal. 2014;281:4263–4279. doi: 10.1111/febs.12904. - DOI - PMC - PubMed
    1. Mitrophanov AY, Groisman EA. Signal integration in bacterial two-component regulatory systems. Genes Dev. 2008;22:2601–2611. doi: 10.1101/gad.1700308. - DOI - PMC - PubMed

Publication types

MeSH terms

LinkOut - more resources