. 2017 Sep 12;8(1):400.
doi: 10.1038/s41467-017-00543-2.

A 3D magnetic tissue stretcher for remote mechanical control of embryonic stem cell differentiation

Affiliations

A 3D magnetic tissue stretcher for remote mechanical control of embryonic stem cell differentiation

Vicard Du et al. Nat Commun. .

Abstract

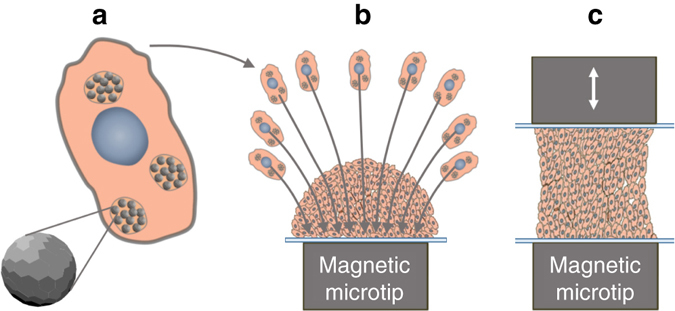
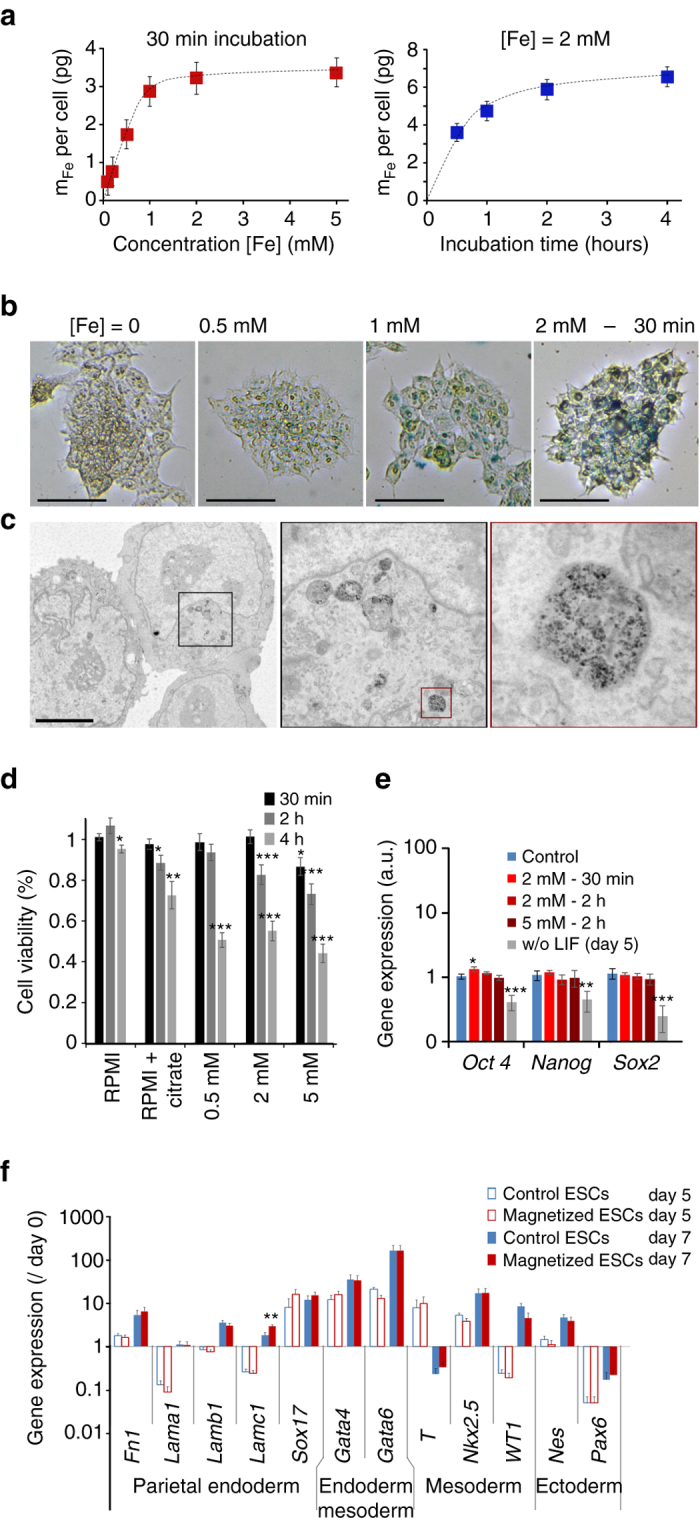
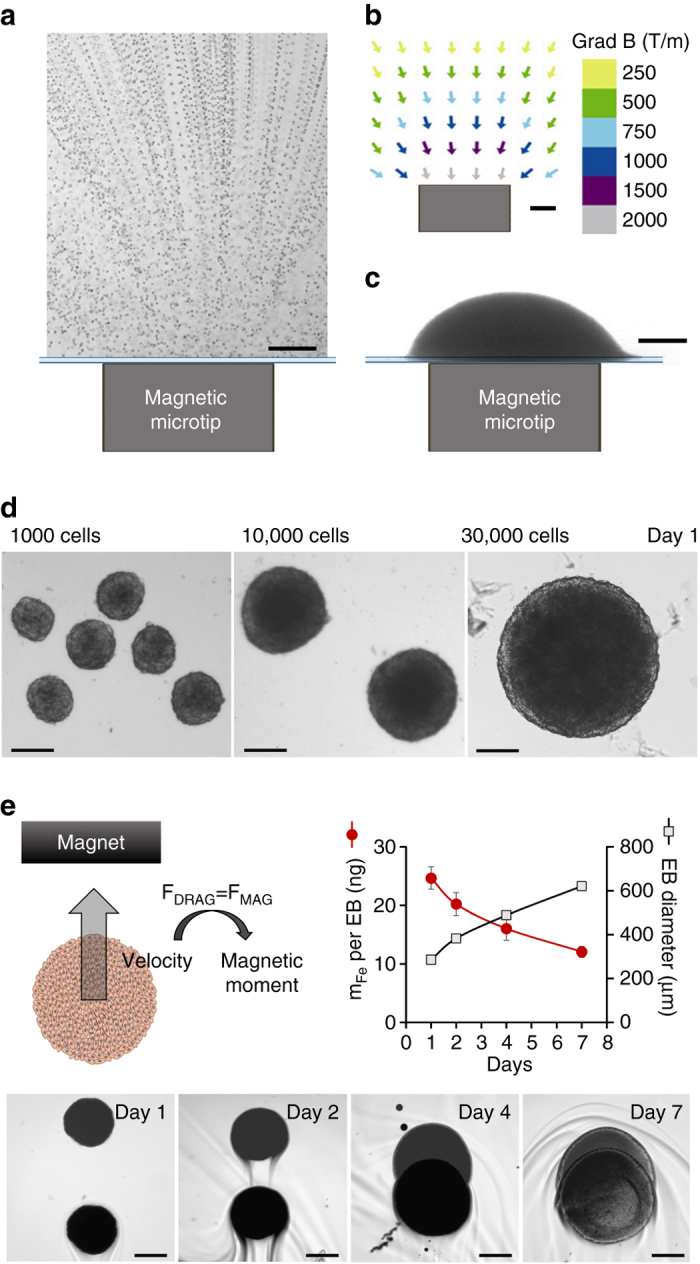
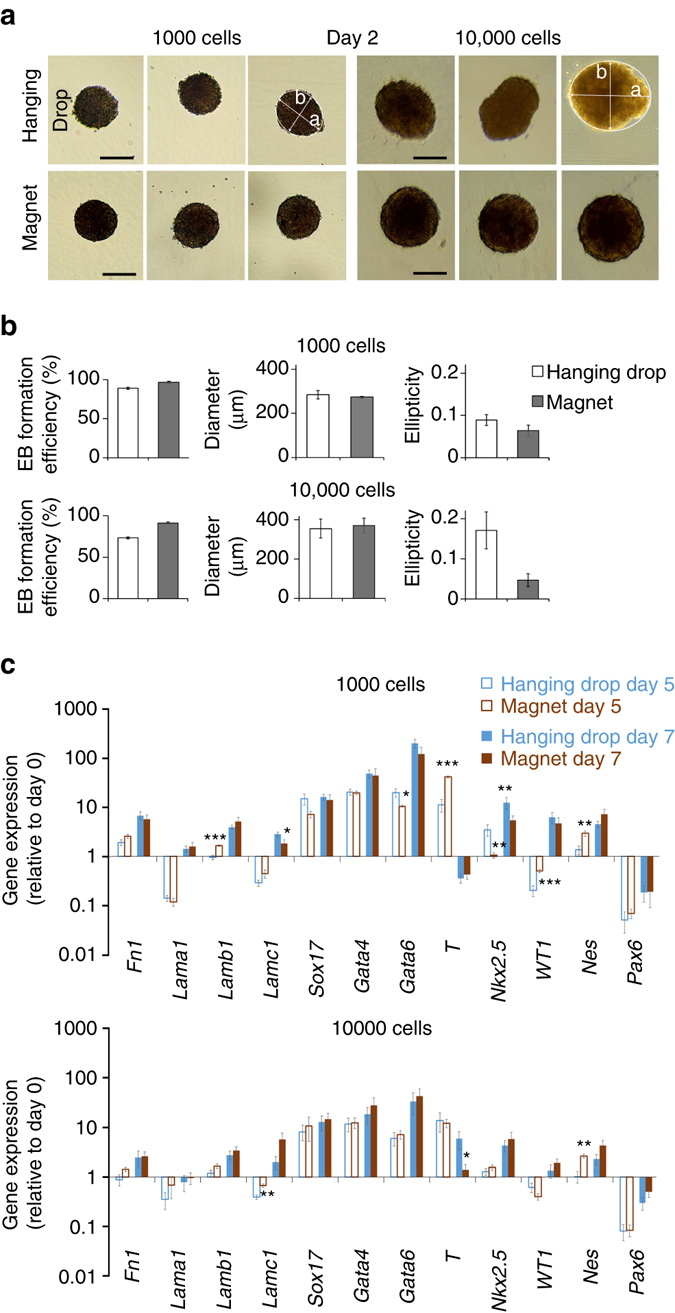
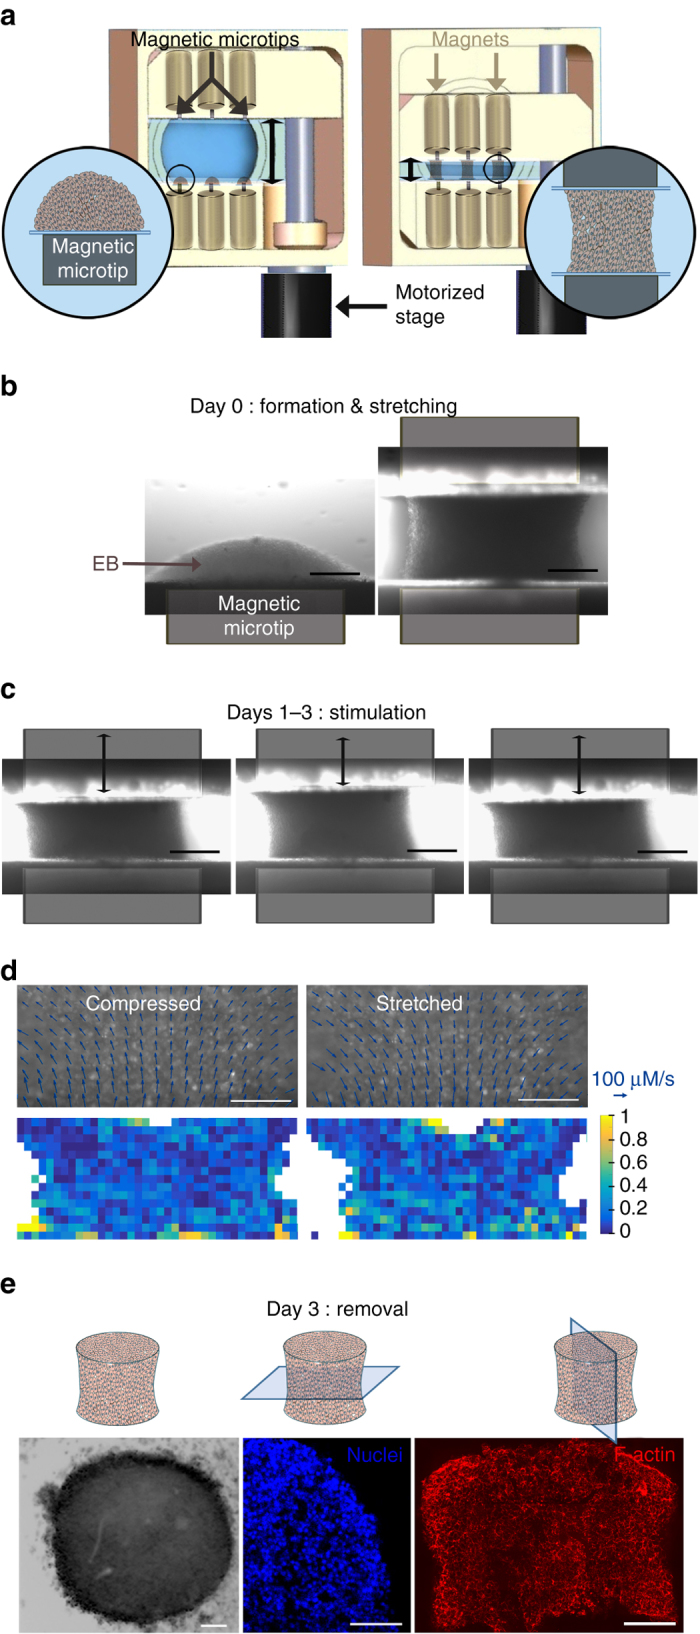
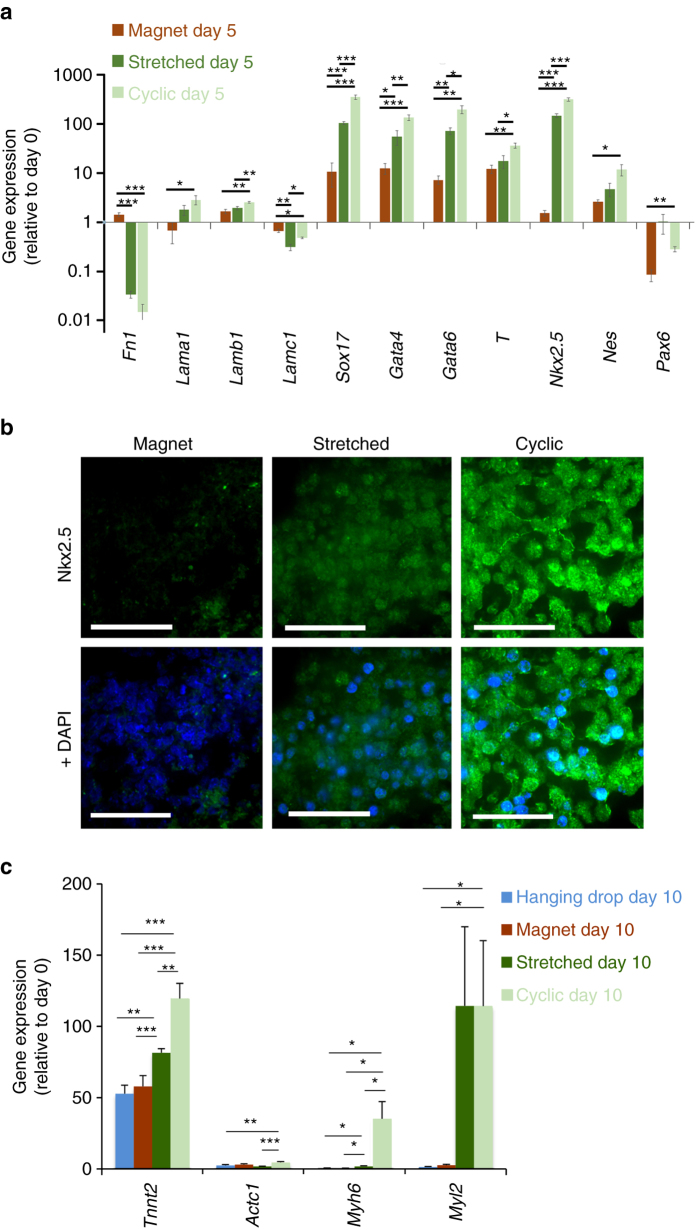
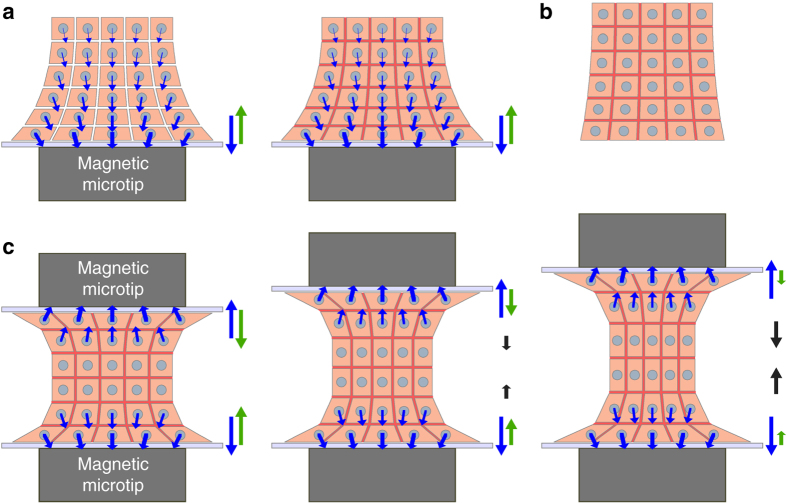
The ability to create a 3D tissue structure from individual cells and then to stimulate it at will is a major goal for both the biophysics and regenerative medicine communities. Here we show an integrated set of magnetic techniques that meet this challenge using embryonic stem cells (ESCs). We assessed the impact of magnetic nanoparticles internalization on ESCs viability, proliferation, pluripotency and differentiation profiles. We developed magnetic attractors capable of aggregating the cells remotely into a 3D embryoid body. This magnetic approach to embryoid body formation has no discernible impact on ESC differentiation pathways, as compared to the hanging drop method. It is also the base of the final magnetic device, composed of opposing magnetic attractors in order to form embryoid bodies in situ, then stretch them, and mechanically stimulate them at will. These stretched and cyclic purely mechanical stimulations were sufficient to drive ESCs differentiation towards the mesodermal cardiac pathway.The development of embryoid bodies that are responsive to external stimuli is of great interest in tissue engineering. Here, the authors culture embryonic stem cells with magnetic nanoparticles and show that the presence of magnetic fields could affect their aggregation and differentiation.


Conflict of interest statement

The authors declare no competing financial interests.

Figures

Fig. 1
Fig. 1
Schematic illustrating the different steps involved in the magnetic stretcher. a Nanoparticles incorporation in ESCs, b EBs formation from magnetized ESCs driven by a magnetic microtip, and c EBs magnetic stimulation in situ, in the 3D geometry, and without the need for a supporting matrix
Fig. 2
Fig. 2
Optimization of embryonic stem cell (ESC) magnetic labeling. a Magnetic labeling of ESCs at different extracellular iron concentrations (for a fixed incubation time of 30 min) and during different incubation periods (for a fixed iron concentration of [Fe] = 2 mM). b Perls’ Prussian blue staining of ESCs after labeling with different concentrations of extracellular iron (between 0.5 mM and 2 mM), and a fixed incubation time of 30 min. Scale bar: 250 µm. c Transmission electron micrograph of ESC after labeling for 30 min at [Fe] = 2 mM (successive zooms of framed areas). Scale bar: 5 µm. Nanoparticles are all located inside the lysosomes. d Cell viability testing using Alamar Blue detection of cell metabolic activity. Cell viability was calculated relative to the control (unlabeled cells in complete medium) and was measured 2 h after different incubation periods (in RPMI) with different extracellular iron concentrations and incubation times. e Expression of pluripotency genes Oct4, Nanog and Sox2 measured by real-time PCR. The gene expression level was calculated with respect to RPLP0 mRNA and expressed as compared to control (unlabeled cells, cultured in complete medium with LIF, = 1 ± SEM). A positive control was added in which the LIF has been removed during 5 days before analysis (culture in complete medium without LIF). One can note that only one condition led to a significant upregulation (Oct4—incubation at 2 mM for 30 min). However the gene was upregulated <1.5-fold (1.3-fold exactly). Besides, higher doses (2 h incubation at 2 and 5 mM) provide the same Oct4 expression as the control. f Expression of several genes characteristic of the different embryonic layers in hanging drop EB formation conditions with 1000 unlabeled (control, blue bars) or labeled cells (magnetic, red bars), 5 days (open bars) and 7 days (solid bars) after initiation of differentiation. All values were calculated with respect to RPLP0 mRNA and normalized by the expression value of the same gene measured at day 0. Two-sample t-test was used to compare the control group with the magnetic group, for same gene and same day; *p < 0.05; **p < 0.01; ***p < 0.001. All error bars represent the SEM
Fig. 3
Fig. 3
Magnetic formation of embryoid bodies. a ESC attraction by a magnetic microtip (750 µm in diameter). To visualize cell movement, the microtip was introduced into a chamber containing suspended cells under a microscope, and cell movements were video-monitored with a ×10 objective. Here 100 movie images were superimposed (0.1 s time intervals) in order to directly observe the trajectories of the cells migrating towards the magnetic microtip. At 1 mm from the microtip, the cells migrate at an average velocity of 300 µm/s, which corresponds to an iron mass of 3 pg cell in a magnetic field gradient of 300 mT/mm. b The field gradient was mapped around the microtip by studying the migration of monodisperse magnetic beads with a calibrated diameter of 4.6 µm (Dynal). At 1 mm from the microtip, it was 300 mT/mm. Scale bar: 200 µm. c Final image of the aggregate obtained 1 min after seeding 30 000 ESCs over the magnetic microtip. Scale bar: 200 µm. d Microscopic images of embryoid bodies (EBs) on day 1, obtained by seeding 1000, 10,000 and 30,000 cells per microtip. Scale bar: 200 µm. e Monitoring of EBs magnetism over 7 days after nanoparticles cellular incorporation, and EB formation (day 0). It consists of tracking the EB magnetic migration towards a magnet, and measuring the corresponding velocity, which translates into the EB magnetic moment (proportional to the mass of iron per EB) by balancing the viscous drag and the magnetic force. Typical migrations are shown for the different times (days 1, 2, 4 and 7), corresponding to the superimposition of two images at 3 s interval. Scale bar: 200 µm. The mass of iron (circles) and the EBs diameters (squares), averaged over eight different EBs, were then plotted as a function of time. Error bars represent the SEM
Fig. 4
Fig. 4
Comparison between magnetic EB formation and hanging drop method. a Typical images of EBs observed at day 2 after seeding (of 1000 or 10,000 ESCs), either in hanging drop or over a magnetic attractor. The short axis b and the long-axis a of the equivalent ellipse were determined by image analysis (Image J). Scale bar: 200 µm. b Quantification over 50 EBs: Efficiency is calculated as the number of EBs actually formed over the number of hanging drops deposited or of magnetic attractors present below the dish; the diameter (expressed in µm) is the effective diameter computed from the EBs areas; and the ellipticity is defined as 1-b/a. c Expression of a panel of genes characteristic of the different embryonic cell layers in EB obtained with hanging drop or magnetic aggregation with either 1000 or 10,000 cells. All gene expressions were normalized using the reference gene RPLP0 mRNA, and calculated relatively to the expression of the same gene obtained at day 0, prior to EB formation. The values varied very little from one condition to another. Even statistically significant differences (over- or under-expression) were small: with 1000 cells on day 5, Lamb1 expression increased by a factor of 1.7 and T expression by 3.7, while Nkx2.5 fell by a factor of 3.2, Wt1 rose by 2.5 and Nes rose by 2.1. On day 7, Lamc1 expression fell 1.5-fold and Nkx2.5 fell 2.3-fold. With 10,000 cells, Lamc1 increased 1.7-fold and Nes 2.6-fold on day 5, while T fell 4.2-fold on day 7. All error bars represent the SEM
Fig. 5
Fig. 5
Magnetic stretcher: formation and stimulation of EBs. a Diagram of the magnetic stretcher device developed. Three EBs could be created on magnetic microtips (magnetized by permanent magnets), and then could be stretched/stimulated by approaching another 3 microtips (also magnetized by permanent magnets). The system is motorized to realize micrometer displacement of the second mobile magnetic microtips system. b Typical images of the first phases on day 0: EB formation and stretching. Scale bar: 200 µm. c Typical images of the cyclic stimulation (here at days 1-3). Scale bar: 200 µm. d Fluorescence images of membrane-stained cells in compressed and stretched EBs (10% imposed strain) are overlaid with velocity vectors extracted from PIV analysis (arrow bar scales for a speed of 100 µm/s). Only one fourth of the vectors are represented for easy reading. Scale bar: 100 µm. The divergence of the velocity field (for stretching) or its opposite (for compression) representative for the strain rate is mapped in both cases. For compression and stretching steps the mean effective strain rate sensed by cells is calculated at 0.32 ± 0.08 and 0.32 ± 0.06 s−1, respectively. e EB sampling on day 3 (here shown for a “cyclic” condition): Optical microscopy right after magnet removal and fluorescent imaging (DAPI staining, middle; F-actin staining, right) of 16-µm cryosections in the perpendicular and parallel direction of the tissue axis. The nuclei image shows a homogeneous cell density in the center of the EB, while F-actin is homogenous whatever the localization of the cell inside the stretched EB. Scale bar: 100 µm. All EBs were formed with 10,000 ESCs
Fig. 6
Fig. 6
EBs characterization for the magnet, stretched and cyclic conditions. a Expression of genes characteristic of the different embryonic cell layers in EB after 5 days maturation (day 5). All EBs were obtained from 10,000 magnetized ESCs. Magnet: EB created on a magnetic microtip; Stretching: EB formed on a magnetic microtip, then stretched between two microtips; Cyclic: as before, plus stimulation at 1 Hz twice a day for 3 days. Gene expression (normalized to RPLP0) is calculated relative to the same gene expression at day 0 before EB formation. b Immunostaining (in green) of Nkx2.5 for EBs in the three conditions, with DAPI staining overlaid on the right. Images are obtained at the center of each EB. Scale bar: 50 µm. c Gene expression at longer maturation times (day 10) for specific cardiac markers cardiac troponin T (Tnnt2), cardiac α-actin (Actc1), α myosin heavy chain (Myh6) and myosin regulatory light chain 2 (Myl2). All EBs were obtained from 10,000 ESCs. For the hanging drop formation (blue), ESCs were not labeled with the magnetic nanoparticles. For the three other conditions, ESCs were magnetic (3 pg of iron per cell): EB formation by magnet with no further stimulation (dark red), stretched stimulation (dark green) and cyclic stimulation (light green). mRNA levels are shown relative to control (day 0, defined as 1), and normalized to reference gene RPLP0. Error bars represent the SEM
Fig. 7
Fig. 7
Schematic view of the forces involved within the EB in the magnetic stretcher. a Formation of the EB on the magnetic microtip located below a glass wall. Each cell is subjected to a magnetic force (blue arrow). The total resulting magnetic force (shown on the right-hand side, also in blue) is exactly balanced by the wall reaction force (green arrow). This pair of forces act like a “clamp” that holds mainly the “proximal” region of the sample, closest to the glass wall. After the magnetic contact, adhesion molecules (in red) develop the EB cohesion, without affecting forces. b The whole aggregate can then be used as a standalone EB. c When another magnetic microtip is approached with another glass wall, the upper cell layers are “clamped” against the upper wall in a similar way as in a. Varying the separation of both “clamps” makes it possible to adjust or cycle the (tensile) strain of the main part of the EB (represented here with a thickness of only two cells for simplicity, but actually corresponding to the major part of the entire EB)

References

    1. Pati F, et al. Printing three-dimensional tissue analogues with decellularized extracellular matrix bioink. Nat. Commun. 2014;5:3935. doi: 10.1038/ncomms4935. - DOI - PMC - PubMed
    1. Giobbe GG, et al. Functional differentiation of human pluripotent stem cells on a chip. Nat. Meth. 2015;12:637–640. doi: 10.1038/nmeth.3411. - DOI - PubMed
    1. Todhunter ME, et al. Programmed synthesis of three-dimensional tissues. Nat. Methods. 2015;12:975–981. doi: 10.1038/nmeth.3553. - DOI - PMC - PubMed
    1. Parmar PA, et al. Temporally degradable collagen–mimetic hydrogels tuned to chondrogenesis of human mesenchymal stem cells. Biomaterials. 2016;99:56–71. doi: 10.1016/j.biomaterials.2016.05.011. - DOI - PMC - PubMed
    1. Discher DE, Mooney DJ, Zandstra PW. Growth factors, matrices, and forces combine and control stem cells. Science. 2009;324:1673–1677. doi: 10.1126/science.1171643. - DOI - PMC - PubMed

Publication types

LinkOut - more resources