. 2017 Sep 12;7(1):11257.
doi: 10.1038/s41598-017-10843-8.

Live imaging reveals the dynamics and regulation of mitochondrial nucleoids during the cell cycle in Fucci2-HeLa cells

Affiliations

Live imaging reveals the dynamics and regulation of mitochondrial nucleoids during the cell cycle in Fucci2-HeLa cells

Taeko Sasaki et al. Sci Rep. .

Abstract

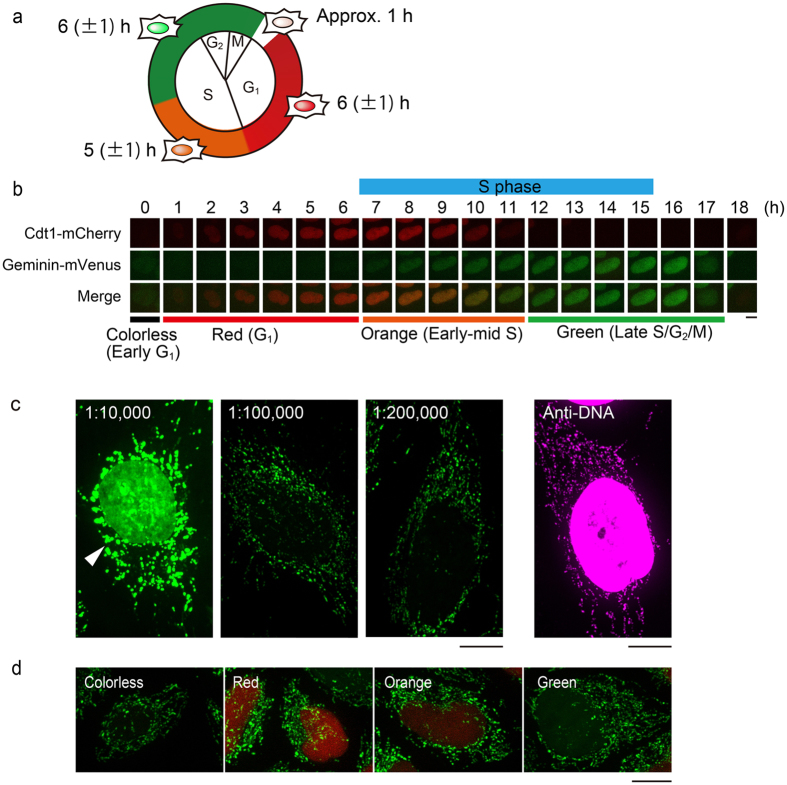
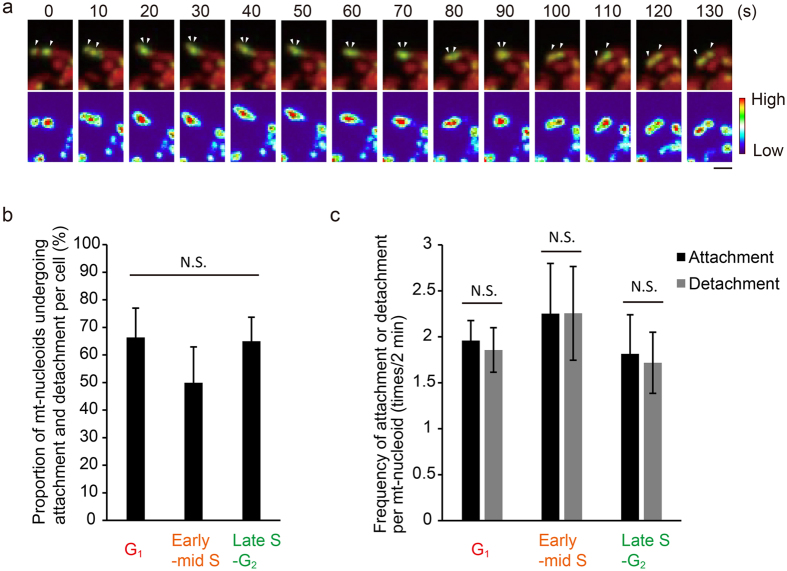
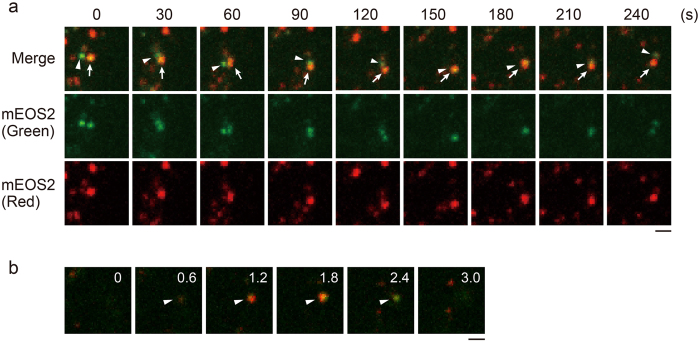
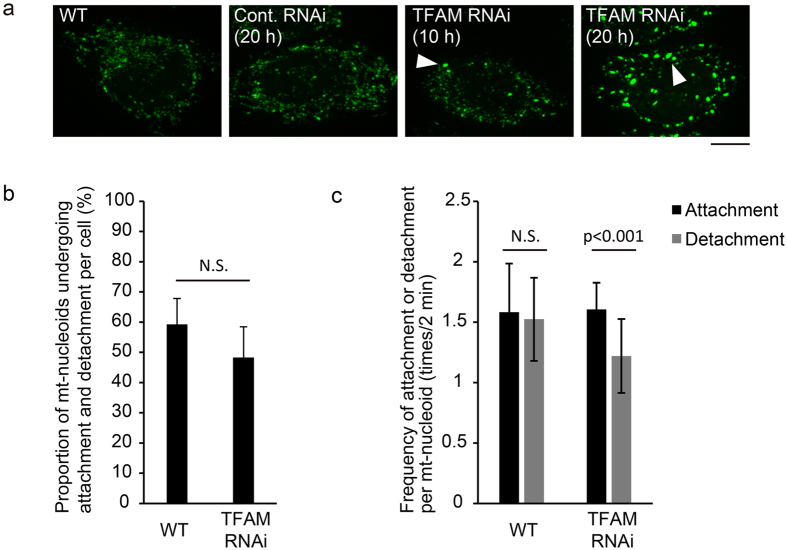
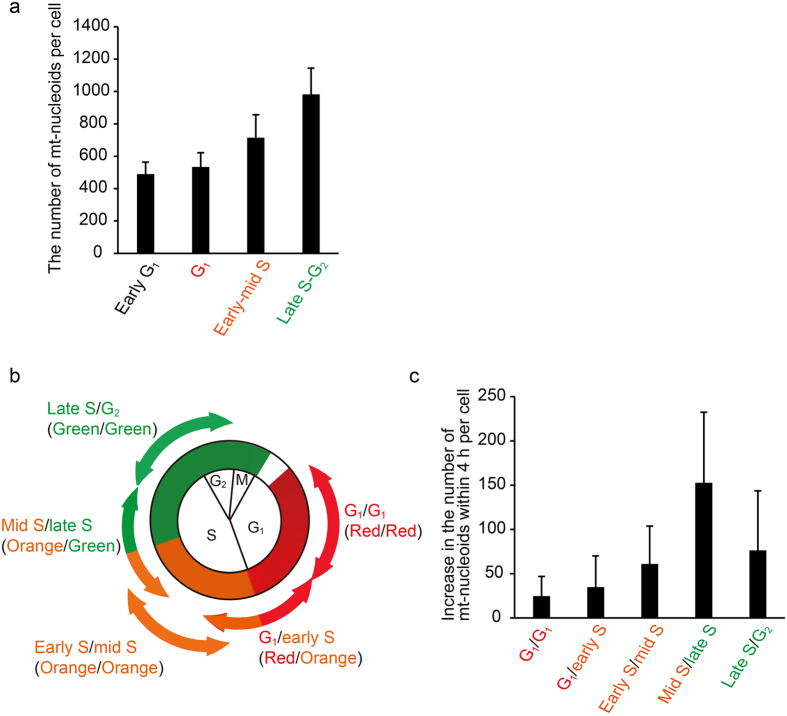
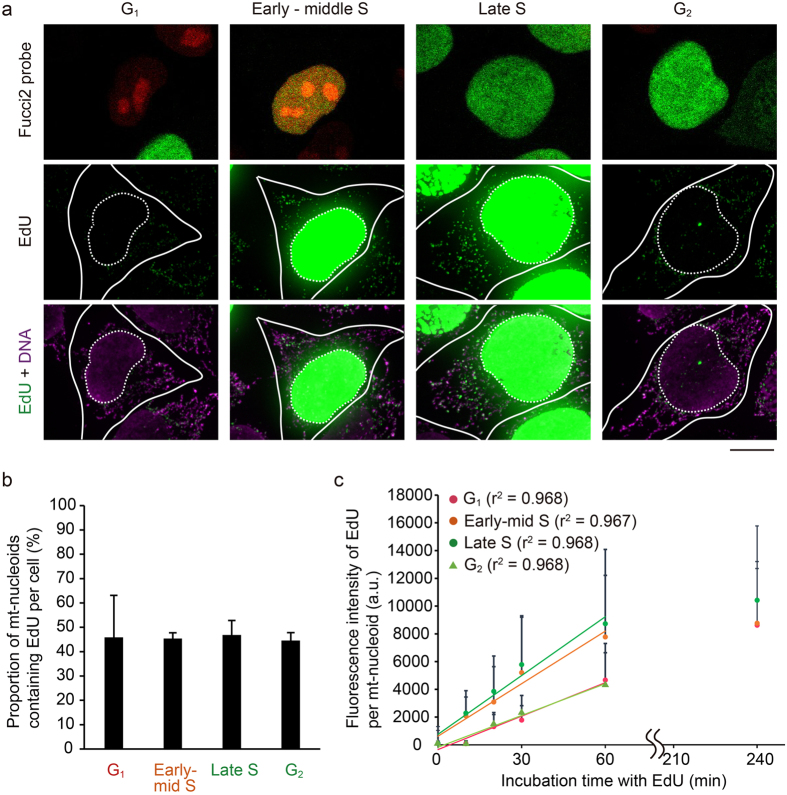
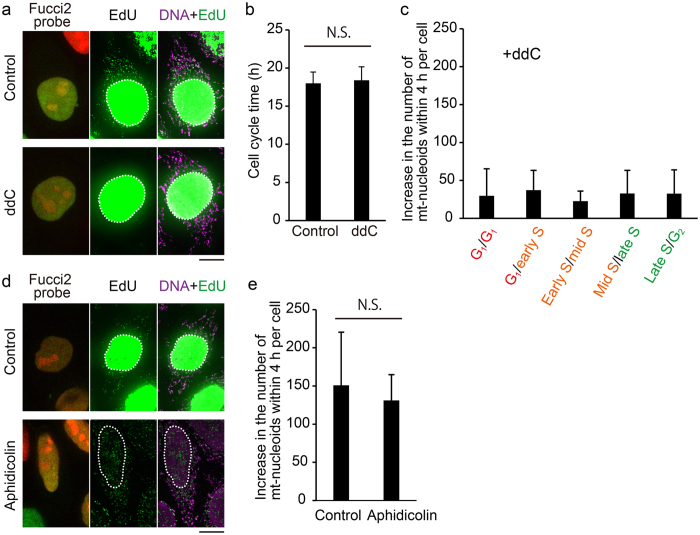
Mitochondrial DNA (mtDNA) is organized in nucleoprotein complexes called mitochondrial nucleoids (mt-nucleoids), which are critical units of mtDNA replication and transmission. In humans, several hundreds of mt-nucleoids exist in a cell. However, how numerous mt-nucleoids are maintained during the cell cycle remains elusive, because cell cycle synchronization procedures affect mtDNA replication. Here, we analyzed regulation of the maintenance of mt-nucleoids in the cell cycle, using a fluorescent cell cycle indicator, Fucci2. Live imaging of mt-nucleoids with higher temporal resolution showed frequent attachment and detachment of mt-nucleoids throughout the cell cycle. TFAM, an mtDNA packaging protein, was involved in the regulation of this dynamic process, which was important for maintaining proper mt-nucleoid number. Both an increase in mt-nucleoid number and activation of mtDNA replication occurred during S phase. To increase mt-nucleoid number, mtDNA replication, but not nuclear DNA replication, was necessary. We propose that these dynamic and regulatory processes in the cell cycle maintain several hundred mt-nucleoids in proliferating cells.


Conflict of interest statement

The authors declare that they have no competing interests.

Figures

Figure 1
Figure 1
SYBR Green I can selectively visualize mt-nucleoids in Fucci2 cells. (a) Schematic representation of the Fucci2 cells used in this study. Average duration of each phase is shown. (b) Time-lapse series of typical fluorescent images during the cell cycle in Fucci2 cells. The duration of S phase was 9 h based on the experiment with EdU pulse labeling (blue bar, the detailed method is presented in the Materials and Methods section). Images showing the color of the nucleus are also presented as merged images. Scale bar, 10 μm. (c) Changes of staining pattern depending on the SYBR Green I concentration in normal HeLa cells. Dilutions of SYBR Green I are indicated above the images. DNAs were immunostained using anti-DNA antibodies in cells without staining of SYBR Green I (panel on the far right). Scale bars, 10 μm. (d) Selective visualization of mt-nucleoids in Fucci2 cells using a low concentration (1:300,000 dilution) of SYBR Green I. The color of the nucleus denoting the cell cycle phase is indicated in the upper left of each image. Scale bar, 10 μm.
Figure 2
Figure 2
mt-nucleoids undergo frequent attachment and detachment during the cell cycle. (a) Time-lapse series of confocal images of mt-nucleoids (green) and mitochondria (red). mtDNAs were stained with SYBR Green I in HeLa cells expressing mitochondrially targeted DsRed (HeLa-Su9 cells). Lower panels show the fluorescence intensity of SYBR Green I as heat map images. Arrowheads show each mt-nucleoid. Scale bar, 1 μm. (b) Proportion of mt-nucleoids undergoing attachment or detachment per cell during the cell cycle mtDNAs were stained with SYBR Green I in Fucci2 cells. A total of 20 mt-nucleoids per cell were randomly selected and analyzed. Error bars indicate standard deviation (ncells = 5 for each phase). The statistical significance of differences in attachment and detachment was examined by analysis of variance (p = 0.1005). N.S., not significant. (c) The frequency of attachment and detachment per mt-nucleoid for 2 min during the cell cycle. mtDNAs were stained with SYBR Green I in Fucci2 cells. mt-nucleoids undergoing attachment and detachment were analyzed for the number of attachments and detachments. A total of 20 mt-nucleoids per cell were randomly selected and analyzed. Error bars indicate standard deviation (ncells = 5 for each phase). The statistical significance of differences in attachment and detachment was examined by paired t-test (G1, p = 0.1739; early-middle S, p = 0.9780; late S-G2, p = 0.2253). N.S., not significant.
Figure 3
Figure 3
mt-nucleoids remain as discrete entities. (a) Time-lapse imaging of mt-nucleoids in TFAM-mEOS2 cells. Partial region of the cell was irradiated by a laser at 405 nm for photoconversion. Change of the colors of mt-nucleoids was not observed after attachment. Similar observations were obtained from 14 analyses. Arrowheads indicate non-photoconverted mt-nucleoids, and arrows indicate photoconverted ones. Scale bar, 1 μm. (b) Image sequence of the z stack shown in Fig. 3a at 180 s. The z stack position (μm) is shown in the upper right of each image. Scale bar, 1 μm.
Figure 4
Figure 4
TFAM knockdown leads to reduced detachment of mt-nucleoids. (a) Effect of TFAM knockdown on mt-nucleoids. Knockdown of TFAM was performed in HeLa cells. mtDNAs were stained with SYBR Green I in TFAM-knockdown cells. Time after transfection of siRNAs is shown in the upper left of the images. Note that mt-nucleoid enlargement is observed from 10 h after transfection. Arrowheads indicate enlarged mt-nucleoids. Scale bar, 10 μm. (b) Proportion of mt-nucleoids undergoing attachment and detachment in wild-type and TFAM-knockdown HeLa cells. The significance of differences was examined by Student’s t-test (p = 0.0947). N.S., not significant. A total of 20 to 48 mt-nucleoids per cell were randomly selected and analyzed. Error bars indicate standard deviation (ncells = 6 for each condition). (c) Frequency of attachment and detachment per mt-nucleoid in wild-type and TFAM-knockdown HeLa cells in 2 min. The frequency was analyzed in mt-nucleoids undergoing attachment and detachment. A total of 20 to 48 mt-nucleoids per cell were randomly selected and analyzed. Error bars indicate standard deviation (ncells = 6 for each condition). The significance of differences in attachment and detachment was examined by paired t-test (WT, p = 0.1281; TFAM RNAi, p = 0.0007). N.S., not significant.
Figure 5
Figure 5
Predominant increase in the number of mt-nucleoids was observed during the S phase. (a) The number of mt-nucleoids per cell in each cell cycle phase. SYBR Green I-stained mt-nucleoids were counted in Fucci2 cells in each phase. Error bars indicate standard deviation (Early G1 ncells = 19, G1 ncells = 22, Early-middle S ncells = 78, Late S-G2 ncells = 42). (b) The period of time-lapse imaging for the experiment in Fig. 5c. Fucci2 cells were classified into five phases depending on the change in color of their nucleus. (c) Increase in the number of mt-nucleoids within 4 h during the cell cycle. We stained Fucci2 cells with 1:300,000 SYBR Green I, and performed time-lapse imaging at 4-h intervals in each cell cycle phase presented in Fig. 5b, after which we counted the mt-nucleoid number at 0 and 4 h. Error bars indicate standard deviation (ncells = 10 for each phase).
Figure 6
Figure 6
mtDNA replication occurs throughout the cell cycle, but the activity increases during the S phase. (a) Visualization of mtDNA replication in Fucci2 cells during the cell cycle. Fucci2 cells were incubated with 15 μM EdU for 60 min. After fixation, the color of the nucleus of Fucci2 cells was recorded, after which we performed signal amplification of EdU (green). We also performed immunostaining of DNA using anti-DNA antibodies (magenta), because signals of SYBR Green I in mt-nucleoids disappeared after fixation. Position of the nucleus (white dotted line) and cell shape (white line) are shown in each image. Scale bar, 10 μm. (b) Proportion of EdU-incorporating mt-nucleoids in a cell during the cell cycle. This proportion was calculated from the number of mt-nucleoids with EdU divided by the number of mt-nucleoids immunostained with anti-DNA antibodies in a cell. Error bars indicate standard deviation (G1, ncells = 7; early-middle S, ncells = 9; late S, ncells = 7; G2, ncells = 7). (c) Fluorescence intensity of EdU signals in each mt-nucleoid during the cell cycle. The EdU intensity in each mt-nucleoid was analyzed using Fiji software. Approximately straight lines for 0–60 min of incubation are shown in the plot area, and the r2 value of each line is indicated in parentheses. The slopes of each approximation line are 80.31, 126.18, 141.26, and 67.53 for G1, early-middle S, late S, and G2, respectively. Error bars indicate standard deviation (nmt-nucleoid = 200 from 10 cells for each plot).
Figure 7
Figure 7
mtDNA replication is required for increase in the number of mt-nucleoids. (a) Effect of ddC treatment on mtDNA and nuclear DNA replication. Cells were treated with or without 100 μM ddC for 3 h, and subsequently incubated with 20 μM EdU for 1 h. Position of the nucleus (white dotted line) is shown in each image. Scale bar, 10 μm. (b) Effect of ddC treatment on cell cycle progression. Cells were treated with 100 μM ddC and time-lapse imaged at 1-h intervals. Error bars indicate standard deviation (ncells = 20 for each phase). Statistical significance was examined by Student’s t-test. N.S., not significant (p = 0.4422). Scale bar, 10 μm. (c) Effect of ddC treatment on regulation of mt-nucleoid number. Fucci2 cells treated with ddC were time-lapse imaged at 4-h intervals. Error bars indicate standard deviation (ncells = 10 for each bar). (d) Effect of aphidicolin treatment on mtDNA and nuclear DNA replication. Cells were treated with 15 μM aphidicolin (Aphidicolin) or 1:4000 DMSO (Control) for 10 h, and subsequently incubated with 20 μM EdU for 1 h. Position of the nucleus (white dotted line) is shown in each image. Scale bar, 10 μm. (e) Effect of aphidicolin treatment on regulation of mt-nucleoid number. The increase in the number of mt-nucleoids within 4 h was investigated during the phase in which the color of the nucleus changed from orange to green, in Fucci2 cells treated with 15 μM aphidicolin or 1:4000 DMSO for 10 h. Statistical significance was examined by Student’s t-test. N.S., not significant (p = 0.4325). Error bars indicate standard deviation (ncells = 10 for each condition).

References

    1. Wallace DC. Mitochondrial DNA mutations in disease and aging. Environ. Mol. Mutagen. 2010;51:440–450. - PubMed
    1. Satoh M, Kuroiwa T. Organization of multiple nucleoids and DNA molecules in mitochondria of human cell. Exp. Cell Res. 1991;196:137–140. doi: 10.1016/0014-4827(91)90467-9. - DOI - PubMed
    1. Legros F, Malka F, Frachon P, Lombès A, Rojo M. Organization and dynamics of human mitochondrial DNA. J. Cell. Sci. 2004;117:2653–2662. doi: 10.1242/jcs.01134. - DOI - PubMed
    1. Kukat C, et al. Super-resolution microscopy reveals that mammalian mitochondrial nucleoids have a uniform size and frequently contain a single copy of mtDNA. Proc. Natl. Acad. Sci. USA. 2011;108:13534–13539. doi: 10.1073/pnas.1109263108. - DOI - PMC - PubMed
    1. Bogenhagen DF. Mitochondrial DNA nucleoid structure. Biochim. Biophys. Acta. 2012;1819:914–920. doi: 10.1016/j.bbagrm.2011.11.005. - DOI - PubMed

Publication types