. 2017 Sep 12;7(1):11379.
doi: 10.1038/s41598-017-11563-9.

Limitations of Qdot labelling compared to directly-conjugated probes for single particle tracking of B cell receptor mobility

Affiliations

Limitations of Qdot labelling compared to directly-conjugated probes for single particle tracking of B cell receptor mobility

Libin Abraham et al. Sci Rep. .

Abstract

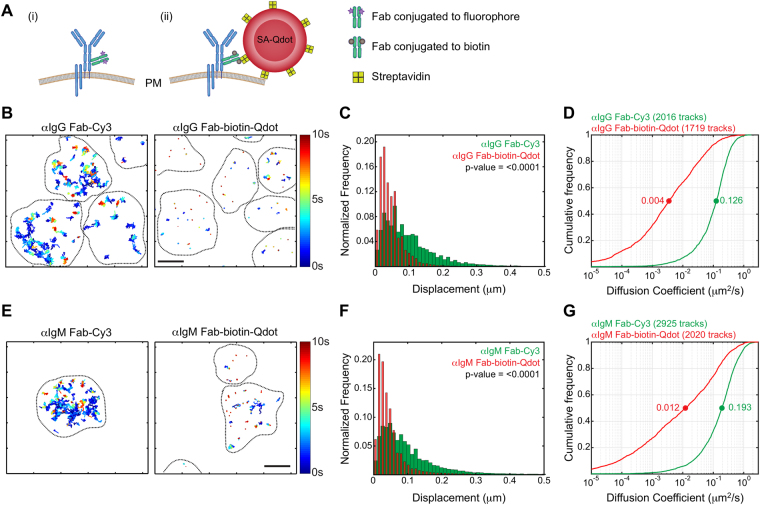
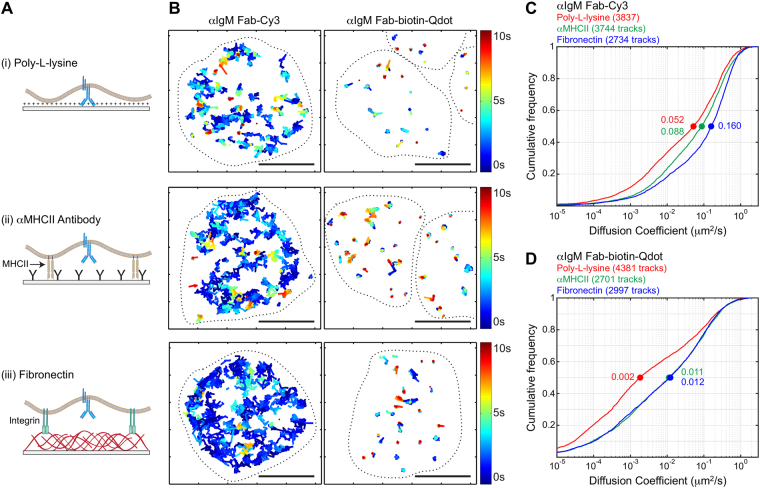
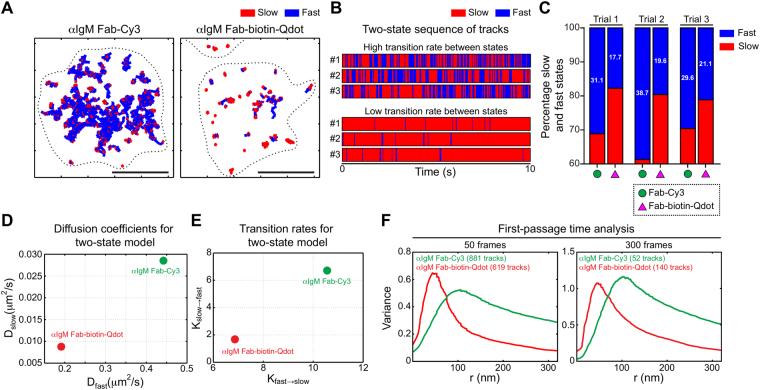
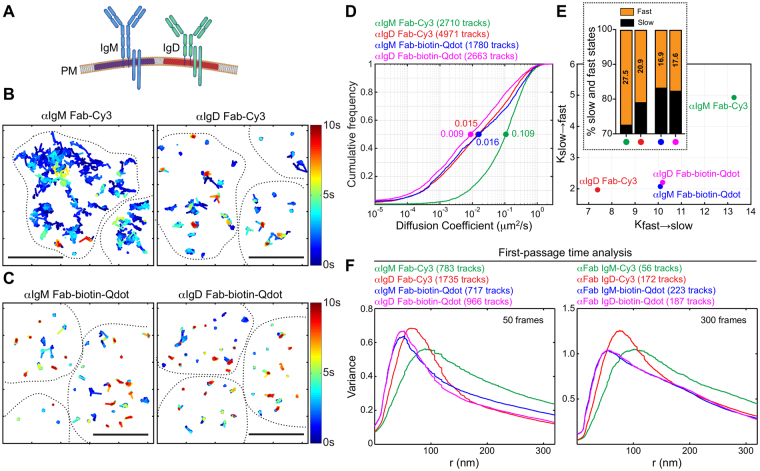
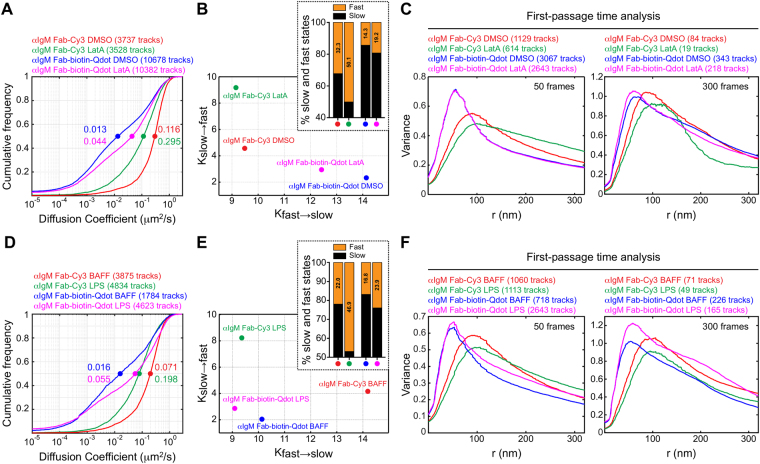
Single-particle tracking (SPT) is a powerful method for exploring single-molecule dynamics in living cells with nanoscale spatiotemporal resolution. Photostability and bright fluorescence make quantum dots (Qdots) a popular choice for SPT. However, their large size could potentially alter the mobility of the molecule of interest. To test this, we labelled B cell receptors on the surface of B-lymphocytes with monovalent Fab fragments of antibodies that were either linked to Qdots via streptavidin or directly conjugated to the small organic fluorophore Cy3. Imaging of receptor mobility by total internal reflection fluorescence microscopy (TIRFM), followed by quantitative single-molecule diffusion and confinement analysis, definitively showed that Qdots sterically hinder lateral mobility regardless of the substrate to which the cells were adhered. Qdot labelling also drastically altered the frequency with which receptors transitioned between apparent slow- and fast-moving states and reduced the size of apparent confinement zones. Although we show that Qdot-labelled probes can detect large differences in receptor mobility, they fail to resolve subtle differences in lateral diffusion that are readily detectable using Cy3-labelled Fabs. Our findings highlight the utility and limitations of using Qdots for TIRFM and wide-field-based SPT, and have significant implications for interpreting SPT data.


Conflict of interest statement

The authors declare that they have no competing interests.

Figures

Figure 1
Figure 1
Qdots hinder the lateral mobility of cell surface receptors. (A) Schematic representation of BCR labelling for SPT using (i) monovalent Fab fragments directly conjugated to fluorophores, or (ii) monovalent Fab fragments conjugated to biotin, followed by streptavidin (SA)-Qdots. The illustration depicts the relative sizes of the BCR, the Cy3 fluorophore, and SA-Qdot. (B,C). A20 B-lymphoma cells were labelled with either anti-IgG (αIgG) Fab-Cy3 or anti-IgG Fab-biotin-Qdots, settled onto anti-MHCII-coated coverslips and then imaged for 10 s at 33 Hz by TIRFM. (B) Trajectories are plotted using a colour-coded temporal scale. The black dashed lines indicate cell boundaries. (C) Distribution of displacement of tracks. Data were analyzed using the Kolmogorov-Smirnov (KS) test and the p-value is indicated. (D) Diffusion coefficients were calculated for all tracks and cumulative frequency curves for both labelling strategies are shown. The dots on the curves indicate the median values. (EG) Ex vivo murine splenic B cells were labelled with anti-IgM (αIgM) Fab-Cy3 or anti-IgM Fab-biotin-Qdots. Trajectories, distributions of displacements, and cumulative frequency curves of diffusion coefficients are shown. Scale bars = 3 μm.
Figure 2
Figure 2
Qdot labelling fails to distinguish substrate-dependent changes in receptor diffusion. (A) Schematic representation of coverslips functionalized with (i) poly-L-lysine, (ii) anti-MHCII antibodies (αMHCII), or (iii) fibronectin, indicating the mode of cell attachment and the assumed differences in the distance between the plasma membrane and the coverslip. (B) Ex vivo murine splenic B cells were labelled and seeded onto the indicated functionalized coverslips (upper panel poly-L-lysine, middle panel αMHCII, lower panel fibronectin) before imaging by TIRFM. Trajectories are plotted using a colour-coded temporal scale. The dashed lines indicate cell boundaries. Scale bars = 5 μm. (C,D) Single-state diffusion coefficients for IgM-BCR tracks obtained using Fab-Cy3 labelling (C) or Fab-biotin-Qdot labelling (D). For all three substrates, the cumulative frequency curves of the diffusion coefficients are shown and the median values are indicated by the dots on the curves.
Figure 3
Figure 3
Qdot labelling alters state-switching behaviour and apparent confinement of IgM BCRs. Ex vivo murine splenic B cells were labelled with anti-IgM Fab-Cy3 or anti-IgM Fab-biotin-Qdot and adhered to anti-MHCII-coated coverslips before being imaged for 10 s at 33 Hz. (A) After applying an immobility threshold to remove stuck particles (see Methods and Supplementary Fig. S2), a two-state HMM model was used to subdivide trajectories into slow-diffusing (red) and fast-diffusing (blue) segments, with dynamic transitions between these two inferred behaviours. Depicted are representative static trajectories of IgM-BCRs that were segmented into inferred slow and fast states. Scale bar = 5 μm. (B) Each barcode shows the time course for transitions between fast (blue) and slow (red) states. Shown are 3 examples of trajectories in which the receptor rapidly switches between slow and fast states (these were obtained using anti-IgM Fab-Cy3 labelling) with a high transition rate and 3 trajectories in which the receptor exhibits primarily slow diffusion, with a low transition rate (these were obtained using anti-IgM Fab-biotin-Qdot labelling). (C) For each condition, all tracks were combined and the percent of time that receptors exhibited slow (red) versus fast (blue) diffusion was determined. Data are shown for 3 independent experiments. (D,E) The HMM algorithm was then used to calculate the inferred slow and fast state diffusion coefficients (D), as well as the transition rates (Kslow→fast, Kfast→slow) (E) between the two states for receptors labelled with either anti-IgM Fab-Cy3 (green) or anti-IgM Fab-biotin-Qdot (red). Note the lower values for Fab-biotin-Qdot labelling. (F) After applying an immobility threshold to remove stuck particles, the trajectories were analyzed using the first-passage time algorithm. Histograms depicting the confinement radii for short tracks (50 frames, left panel) and long tracks (300 frames, right panel) are shown. The numbers of tracks analyzed are indicated. Note that Fab-Cy3 labelling yields larger confinement radii.
Figure 4
Figure 4
Lateral diffusion of IgM-BCRs and IgD-BCRs cannot be distinguished using Qdot-labelling. (A) Schematic representation of IgM- and IgD-containing BCRs. (BF) Ex vivo splenic B cells were labelled with anti-IgM or anti-IgD (αIgD) Fab-Cy3 probes (B) or with anti-IgM or anti-IgD Fab-biotin-Qdot probes (C). In panels B and C, trajectories are plotted using a colour-coded temporal scale. The dashed lines indicate cell boundaries. Scale bars = 5 μm. Cumulative frequency plots of single-state diffusion coefficients are shown (D). Median values are indicated by the dots. In panel (E), tracks were analyzed using the FPT algorithm. Histograms depicting the confinement radii for short tracks (50 frames, left panel) and long tracks (300 frames, right panel) are shown. In panel (F), the tracks were analyzed using the two-state HMM. The transition rates (Kslow→fast, Kfast→slow) between the two states are shown. The inset shows the fraction of time that receptors exhibited slow (red) versus fast (blue) diffusion, as determined using the two-state HMM. All data in panels (BF) are from the same experiment. Similar results were obtained in two independent experiments.
Figure 5
Figure 5
Larger changes in receptor mobility can be detected using Qdots. (AC) Ex vivo splenic B cells were labelled with either anti-IgM Fab-Cy3 or anti-IgM Fab-biotin-Qdot. The cells were treated with DMSO or 1 μM latrunculin A (LatA) for 5 min prior to SPT imaging. Cumulative frequency plots of single-state diffusion coefficients for IgM-BCRs are shown in (A). Median values are indicated by the dots. (B) The tracks were analyzed using the two-state HMM. The transition rates (Kslow→fast, Kfast→slow) between the two states are shown. The inset shows the fraction of time that receptors exhibited slow (black) versus fast (orange) diffusion, as determined using the two-state HMM. All data are from the same experiment. Similar results were obtained in three independent experiments. (C) The trajectories were analyzed using the FPT algorithm and histograms depicting the confinement radii for short tracks (50 frames, left panel) and long tracks (300 frames, right panel) are shown. (DF) Splenic B cells were cultured for 16 h with 5 ng/mL BAFF or with BAFF + 5 μg/mL LPS before being labelled with either anti-IgM Fab-Cy3 or anti-IgM Fab-biotin-Qdot. (D) Cumulative frequency plots of diffusion coefficients are shown. (E) The transition rates between slow- and fast-diffusion states determined by the HMM algorithm. The fraction of time that receptors exhibited slow (black) versus fast (orange) diffusion are shown in the inset. (F) The trajectories were analyzed using the FPT algorithm and histograms depicting the confinement radii for short and long tracks are shown. All data are from the same experiment. Similar results were obtained in two independent experiments.

References

    1. Kusumi A, et al. Dynamic organizing principles of the plasma membrane that regulate signal transduction: commemorating the fortieth anniversary of Singer and Nicolson’s fluid-mosaic model. Annual review of cell and developmental biology. 2012;28:215–250. doi: 10.1146/annurev-cellbio-100809-151736. - DOI - PubMed
    1. Grecco HE, Schmick M, Bastiaens PI. Signaling from the living plasma membrane. Cell. 2011;144:897–909. doi: 10.1016/j.cell.2011.01.029. - DOI - PubMed
    1. Kholodenko BN, Hancock JF, Kolch W. Signalling ballet in space and time. Nature reviews. Molecular cell biology. 2010;11:414–426. doi: 10.1038/nrm2901. - DOI - PMC - PubMed
    1. Germain RN. T-cell signaling: the importance of receptor clustering. Current biology: CB. 1997;7:R640–644. doi: 10.1016/S0960-9822(06)00323-X. - DOI - PubMed
    1. Treanor B. B-cell receptor: from resting state to activate. Immunology. 2012;136:21–27. doi: 10.1111/j.1365-2567.2012.03564.x. - DOI - PMC - PubMed

Publication types

Substances

Grants and funding