Review
. 2017 Jul 28:11:755.
doi: 10.3332/ecancer.2017.755. eCollection 2017.

Cancer of childhood in sub-Saharan Africa

Affiliations
Review

Cancer of childhood in sub-Saharan Africa

Cristina Stefan et al. Ecancermedicalscience. .

Abstract

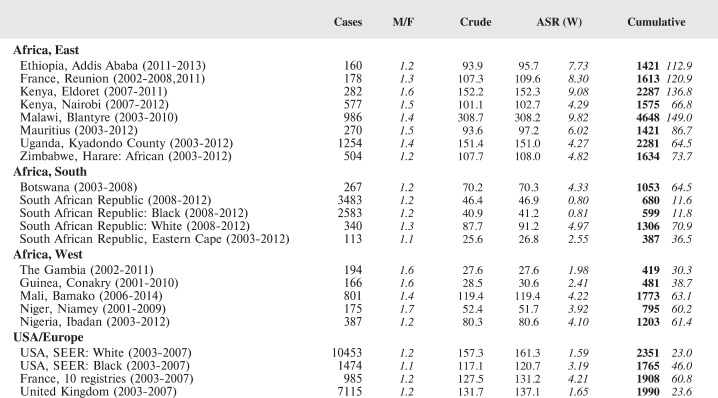
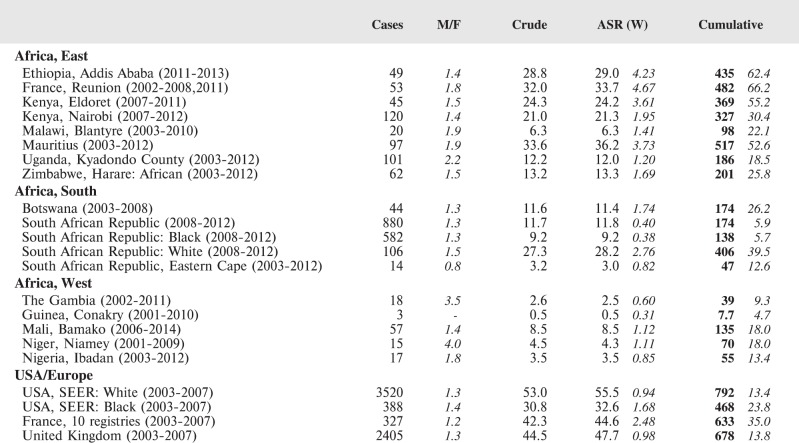
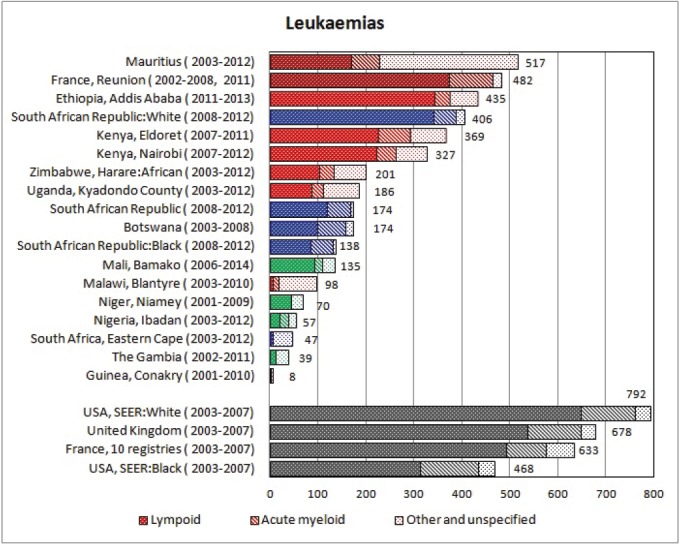
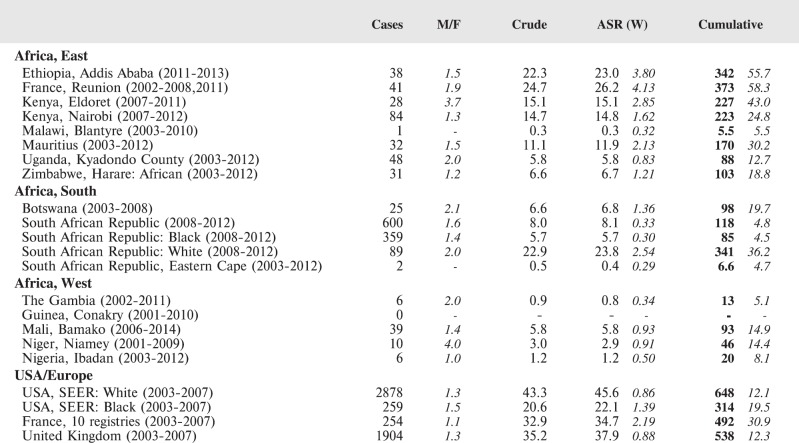
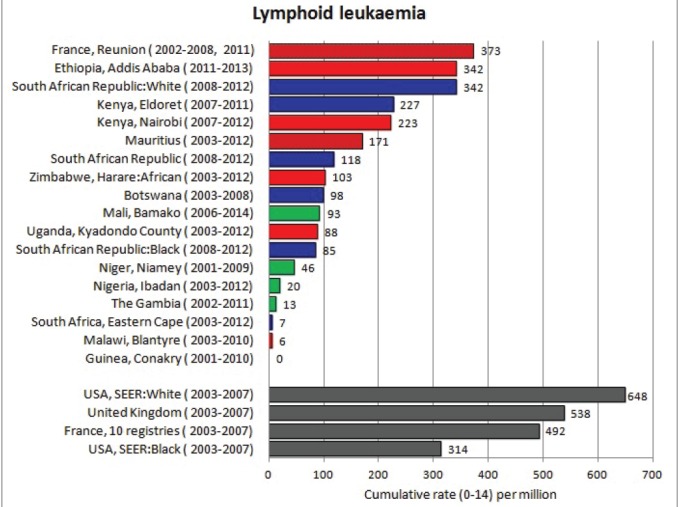
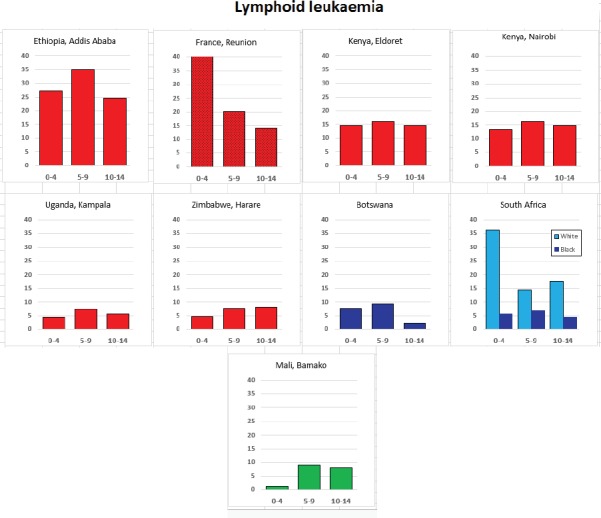
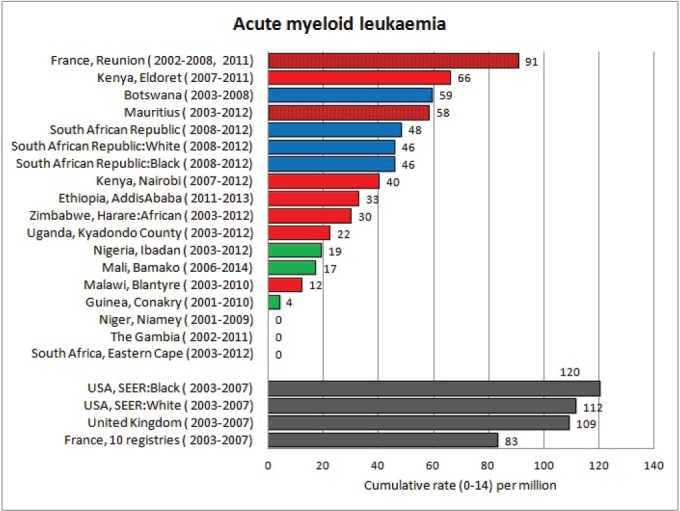
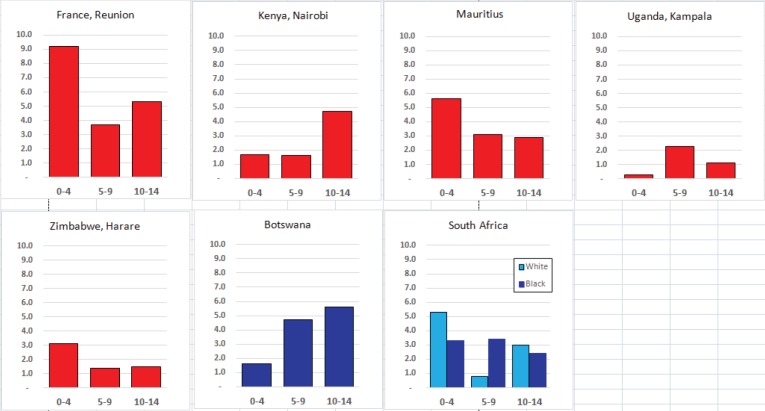
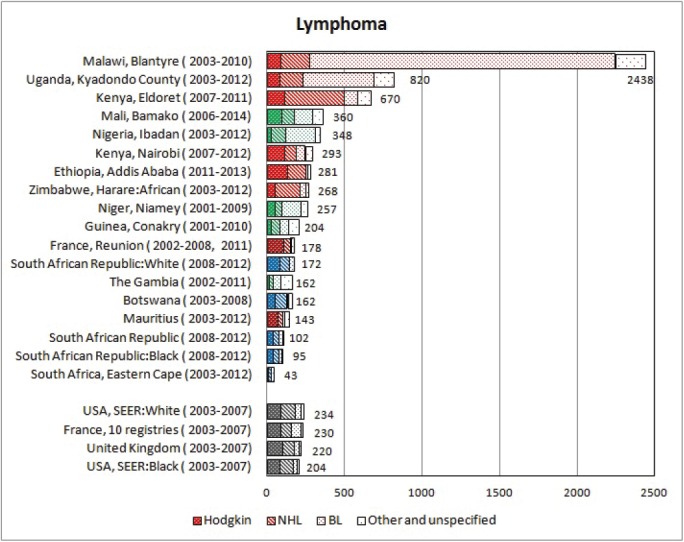
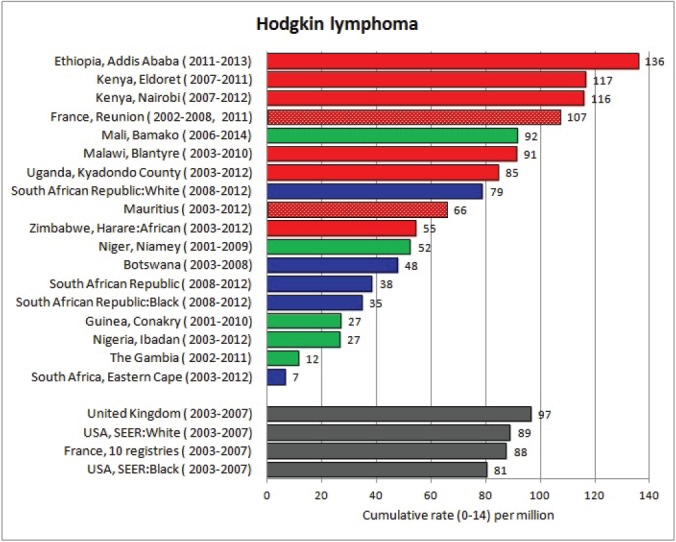
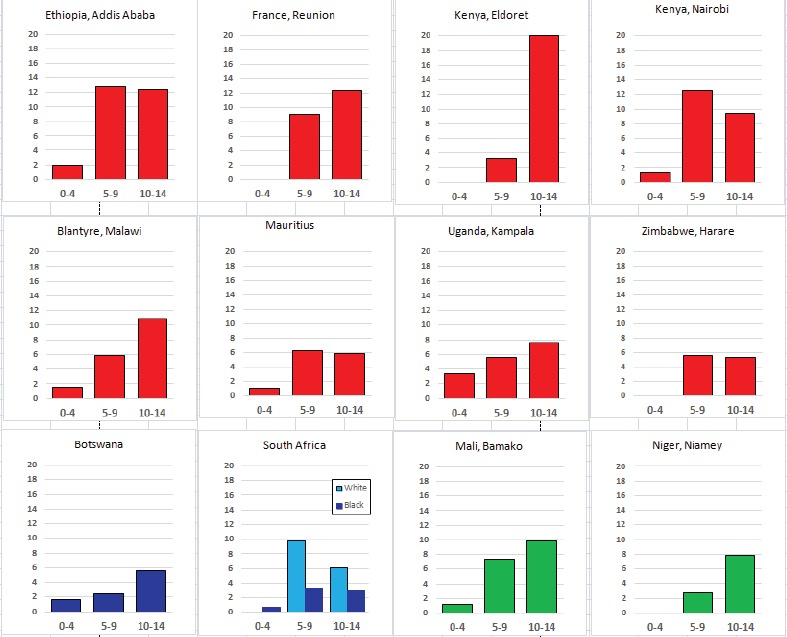
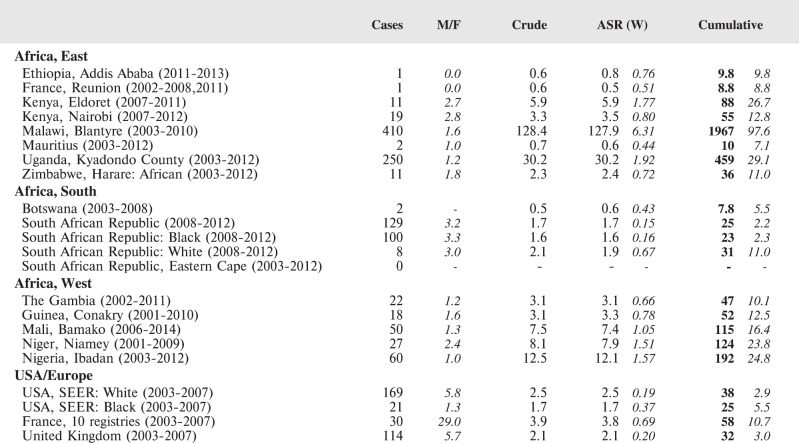
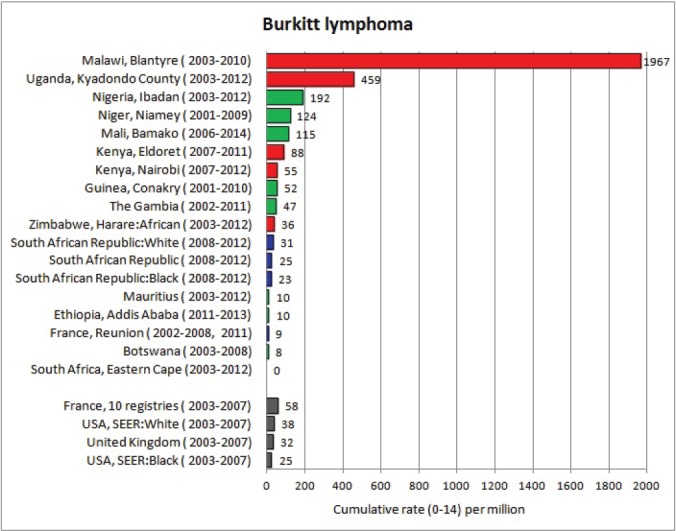
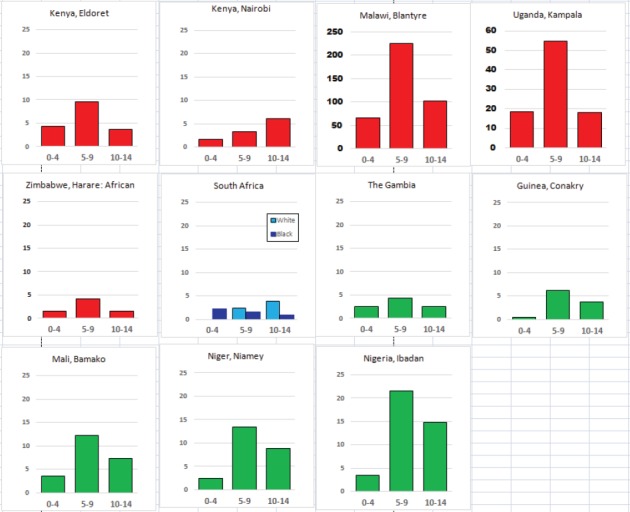
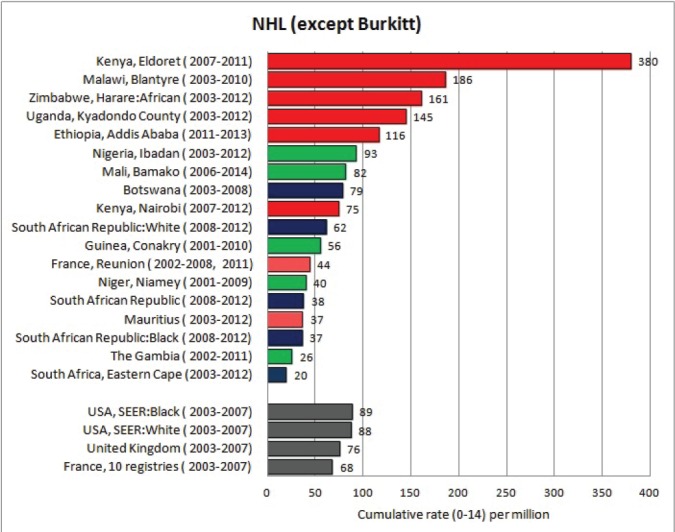
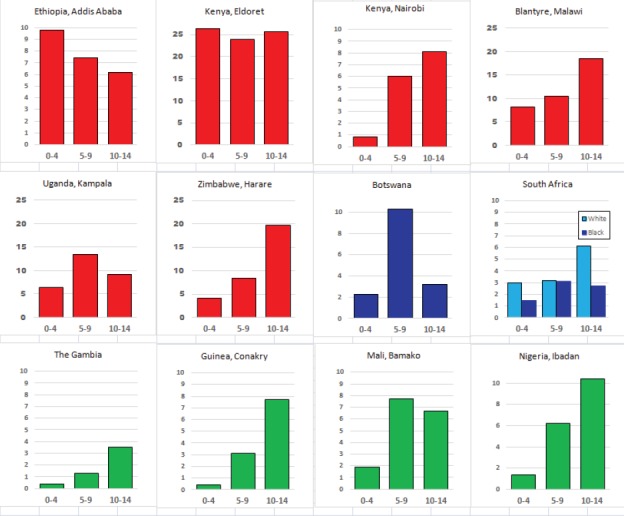
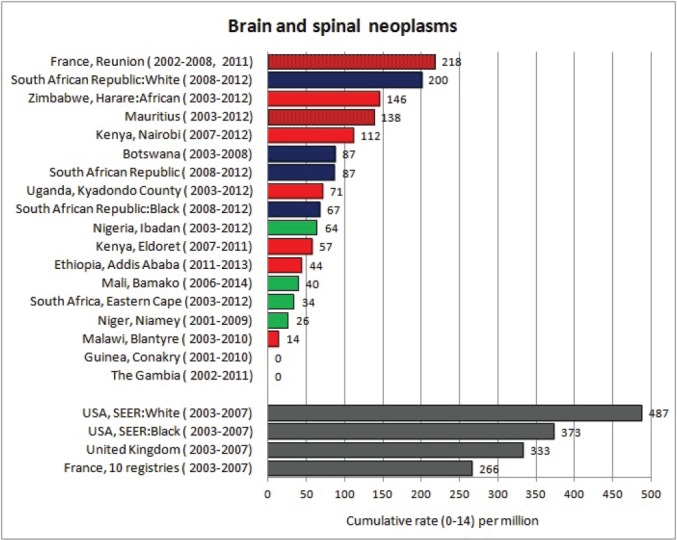
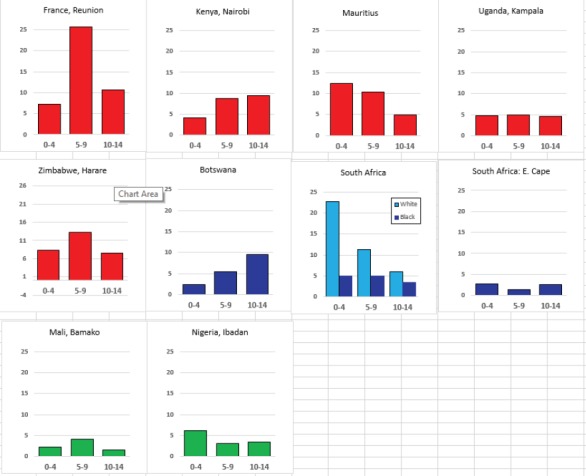
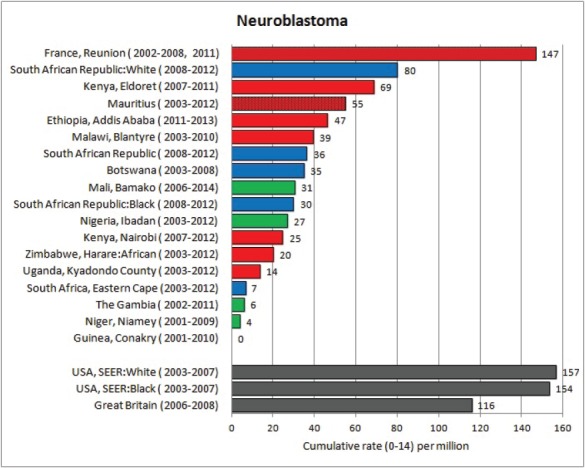
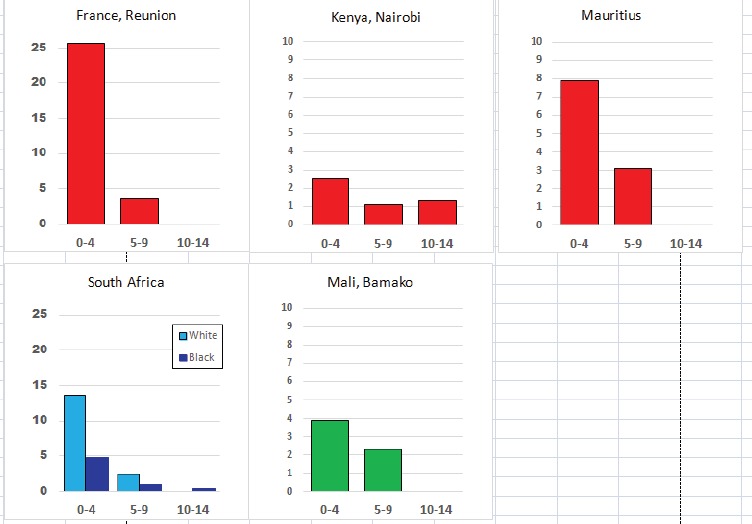
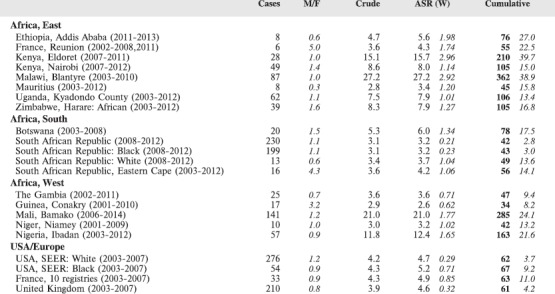
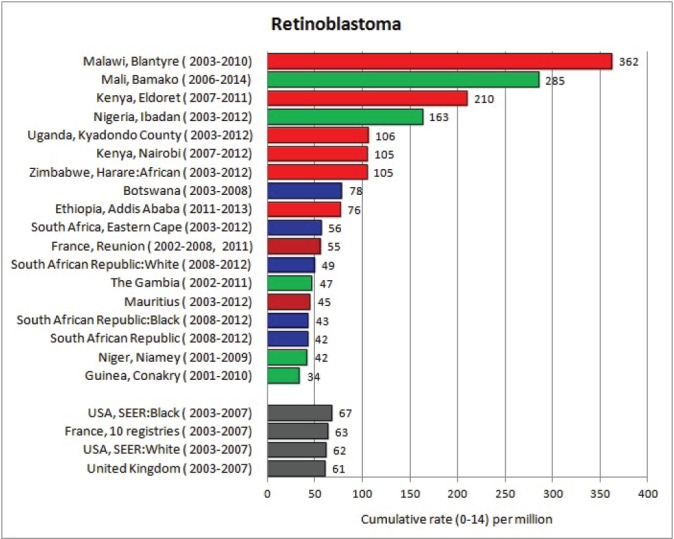
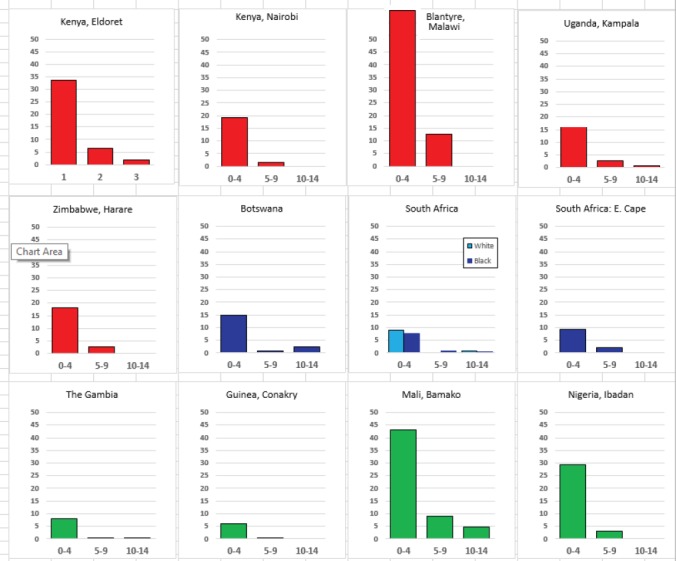
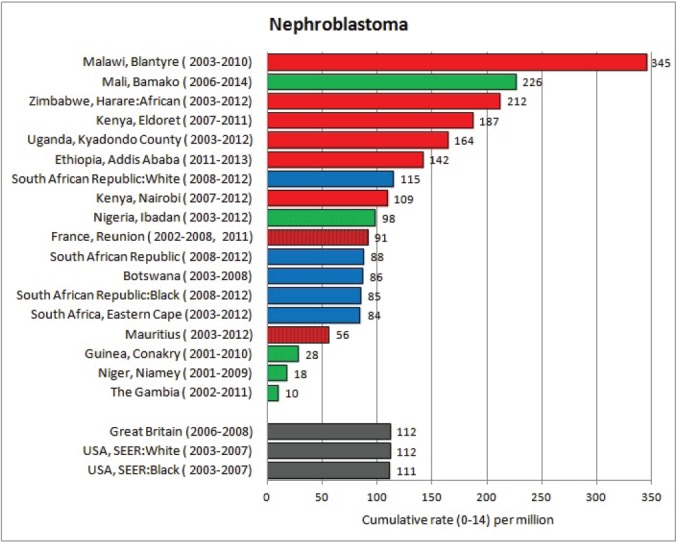
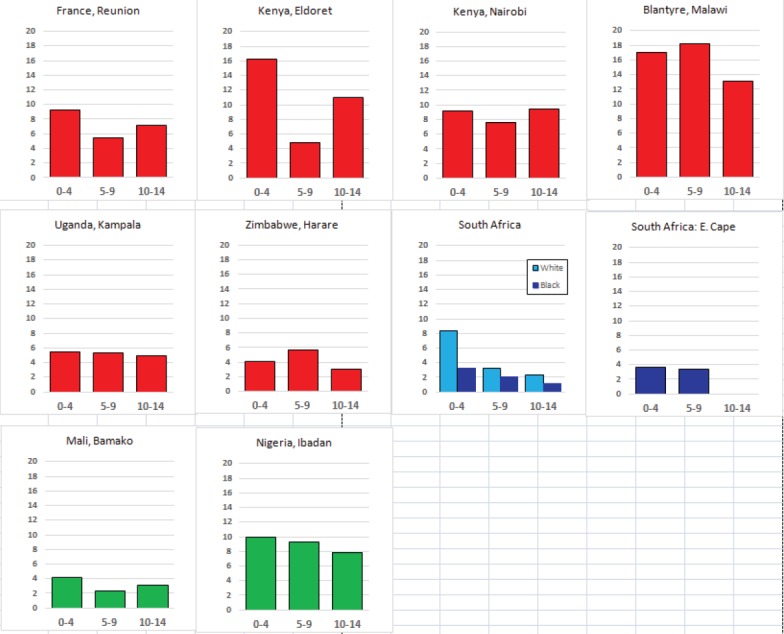
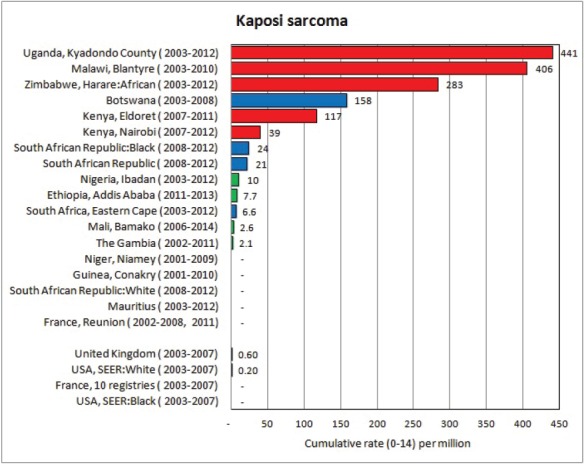
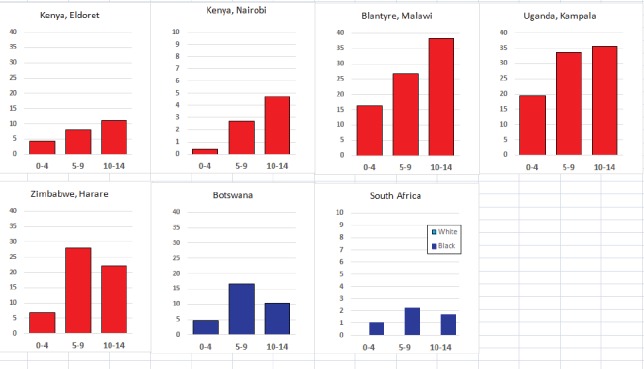
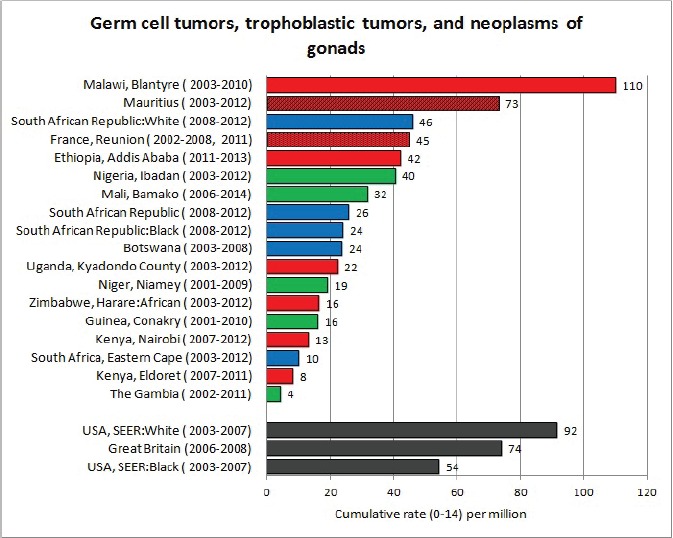
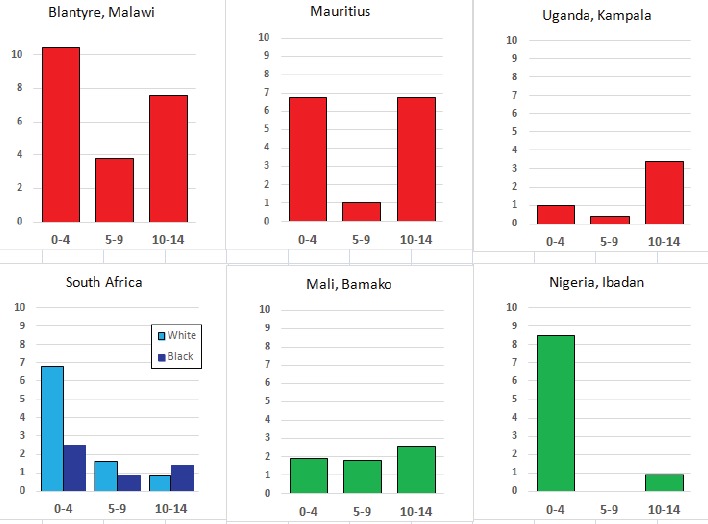
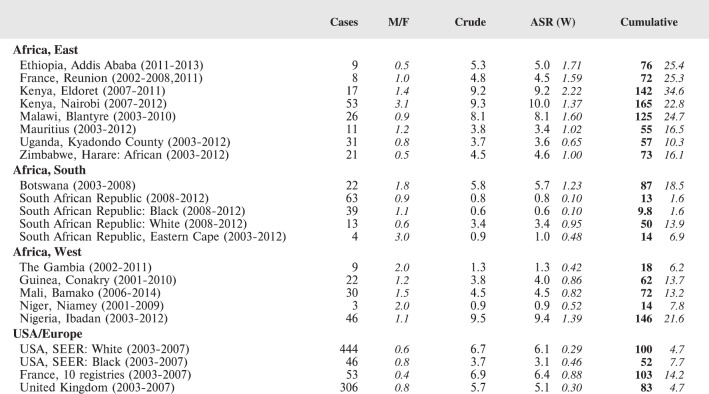
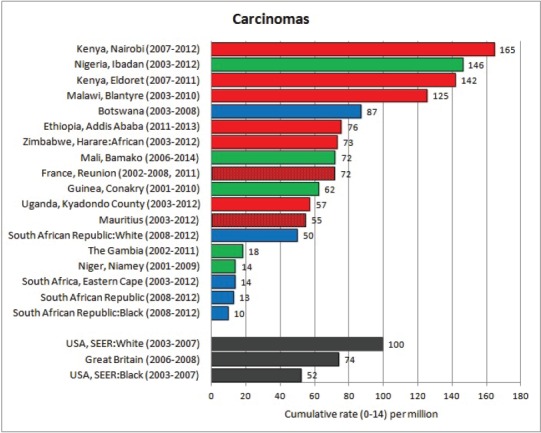
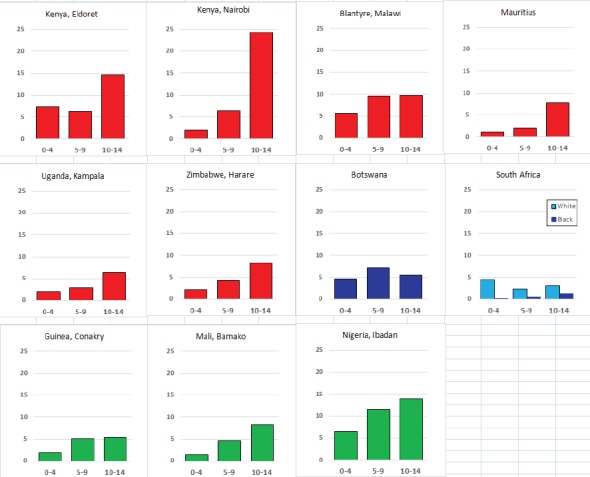
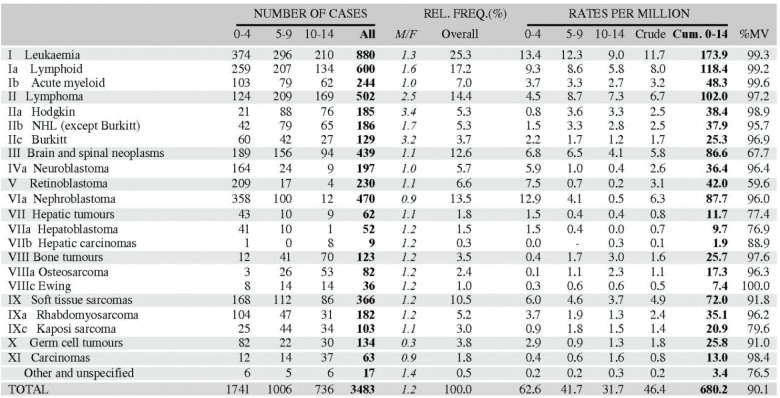
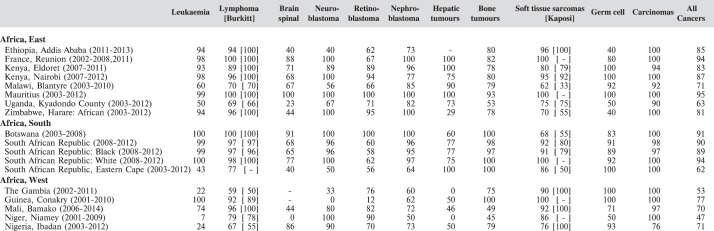
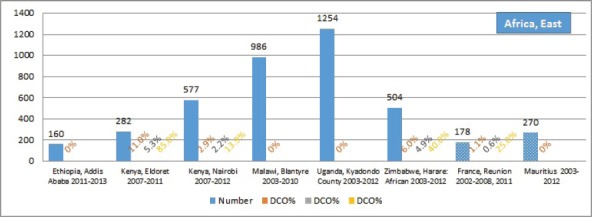
Measurement of incidence rates of childhood cancer in Africa is difficult. The study 'Cancer of Childhood in sub Saharan Africa' brings together results from 16 population-based registries which, as members of the African Cancer Registry Network (AFCRN), have been evaluated as achieving adequate coverage of their target population. The cancers are classified according to the third revision of the International Classification of Childhood Cancer (ICCC-3) and recorded rates in Africa are compared with those in childhood populations in the UK, France, and the USA. It is clear that, in many centres, lack of adequate diagnostic and treatment facilities leads to under-diagnosis (and enumeration) of leukaemias and brain cancers. However, for several childhood cancers, incidence rates in Africa are higher than those in high-income countries. This applies to infection-related cancers such as Kaposi sarcoma, Burkitt lymphoma, Hodgkin lymphoma and hepatocellular carcinoma, and also to two common embryonal cancers - retinoblastoma and nephroblastoma. These (and other) observations are unlikely to be artefact, and are of considerable interest when considering possible aetiological factors, including ethnic differences in risk (and hence genetic/familial antecedents). The data reported are the most extensive so far available on the incidence of cancer in sub Saharan Africa, and clearly indicate the need for more resources to be devoted to cancer registration, especially in the childhood age range, as part of an overall programme to improve the availability of diagnosis and treatment of this group of cancers, many of which have-potentially-an excellent prognosis.

Keywords: cancer; cancer registry; childhood; incidence; sub-Saharan Africa.


Figures

None
Map of the catchment area served by the cancer registry. Source unknown.
None
Map of the catchment area served by the cancer registry. Source unknown.
None
Map of the catchment area served by the cancer registry. Source unknown.
None
Map of the catchment area served by the cancer registry. Source unknown.
None
Map of the catchment area served by the cancer registry. Source unknown.
None
Map of the catchment area served by the cancer registry. Source unknown.
None
Map of the catchment area served by the cancer registry. Source unknown.
None
Map of the catchment area served by the cancer registry. Source unknown.
None
Map of the catchment area served by the cancer registry. Source unknown.
None
Map of the catchment area served by the cancer registry. Source unknown.
None
Map of the catchment area served by the cancer registry. Source unknown.
None
Map of the catchment area served by the cancer registry. Source unknown.
None
Map of the catchment area served by the cancer registry. Source unknown.
None
Map of the catchment area served by the cancer registry. Source unknown.
None
Map of the catchment area served by the cancer registry. Source unknown.
None
Map of the catchment area served by the cancer registry. Source unknown.
Table 7.
Table 7.. Crude, age-standardized (world) and cumulative (0–14) incidence Rates (per million) and standard errors – total.
Table 8.1.
Table 8.1.. Crude, age-standardised (world) and cumulative (0-14) incidence rates (per million) and standard errors – leukaemias.
Figure 8.1.
Figure 8.1.. Cumulative (0-14) incidence rate – leukaemias: lymphoid, acute myeloid, and others.
Table 8.1.1.
Table 8.1.1.. Crude, age-standardised (world) and cumulative (0-14) incidence rates (per million) and standard errors – lymphoid leukaemia.
Figure 8.1.1a.
Figure 8.1.1a.. Cumulative (0–14) incidence rate – lymphoid leukaemia.
Figure 8.1.1b.
Figure 8.1.1b.. Age-specific histogram – lymphoid leukaemia.
Table 8.1.2.
Table 8.1.2.. Crude, age-standardised (world) and cumulative (0–14) incidence rates (per million) and standard errors – Acute myeloid leukaemia.
Figure 8.1.2a.
Figure 8.1.2a.. Cumulative (0-14) incidence rate – acute myeloid leukaemia.
Figure 8.1.2b.
Figure 8.1.2b.. Age-specific histogram – acute myeloid leukaemia.
Table 8.2.
Table 8.2.. Crude, age-standardised (world), and cumulative (0–14) incidence rates (per million) and standard errors – lymphomas.
Figure 8.2.
Figure 8.2.. Cumulative (0–14) incidence rate per million – lymphomas: Hodgkin, NHL, BL and others.
Table 8.2.1a.
Table 8.2.1a.. Crude, age-standardised (world), and cumulative (0–14) incidence rate (per million) and standard errors – Hodgkinlymphoma.
Figure 8.2.1a.
Figure 8.2.1a.. Cumulative (0–14) incidence rate – Hodgkin lymphoma.
Figure 8.2.1b.
Figure 8.2.1b.. Age-specific histograms – Hodgkin lymphoma.
Table 8.2.2.
Table 8.2.2.. Crude, age-standardised (world) and cumulative (0–14) incidence rates (per million) and standard errors – Burkitt lymphoma.
Figure 8.2.2a.
Figure 8.2.2a.. Cumulative (0–14) incidence rate – Burkitt lymphoma.
Figure 8.2.2b.
Figure 8.2.2b.. Age-specific histograms – Burkitt lymphoma.
Table 8.2.3.
Table 8.2.3.. Crude, age-standardised (world) and cumulative (0–14) incidence rates (per million) and standard errors – NHL (except Burkitt).
Figure 8.2.3a.
Figure 8.2.3a.. Cumulative (0-14) incidence rate – NHL (except Burkitt).
Figure 8.2.3b.
Figure 8.2.3b.. Age-specific histograms – NHL (except Burkitt).
Table 8.3.
Table 8.3.. Crude, age-standardised (world) and cumulative (0–14) incidence rates (per million) and standard errors – brainand spinal neoplasms (malignant).
Figure 8.3a.
Figure 8.3a.. Cumulative (0–14) incidence rate – brain and spinal neoplasms (malignant).
Figure 8.3b.
Figure 8.3b.. Age-specific histograms – brain and spinal neoplasms (malignant).
Table 8.4.
Table 8.4.. Crude, age-standardised (world) and cumulative (0–14) incidence rates (per million) and standard errors – neuroblastoma.
Figure 8.4a.
Figure 8.4a.. Cumulative (0–14) incidence rate – neuroblastoma.
Figure 8.4b.
Figure 8.4b.. Age-specific histograms – neuroblastoma.
Table 8.5.
Table 8.5.. Crude, age-standardised (world) and cumulative (0–14) incidence rates (per million) and standard errors – retinoblastoma.
Figure 8.5a.
Figure 8.5a.. Cumulative (0–14) incidence rate – retinoblastoma.
Figure 8.5b.
Figure 8.5b.. Age-specific histograms – retinoblastoma.
Table 8.6.
Table 8.6.. Crude, age-standardised (world) and cumulative (0–14) incidence rates (per million) and standard errors—nephroblastoma.
Figure 8.6a.
Figure 8.6a.. Cumulative (0–14) incidence rate—nephroblastoma.
Figure 8.6b.
Figure 8.6b.. Age-specific histograms—nephroblastoma.
Table 8.7.
Table 8.7.. Crude, age-standardised (world) and cumulative (0–14) incidence rates (per million) and standarderrors—hepatic tumours.
Figure 8.7.
Figure 8.7.. Cumulative (0–14) incidence rate—hepatoblastoma, hepatocellular carcinoma and others.
Table 8.7.1.
Table 8.7.1.. Crude, age-standardised (world) and cumulative (0–14) incidence rates (per million) and standarderrors—hepatoblastoma.
Table 8.7.2.
Table 8.7.2.. Crude, age-standardised (world) and cumulative (0–14) incidence rates (per million) and standarderrors—hepatocellular carcinomas.
Table 8.8.
Table 8.8.. Crude, age-standardised (world) and cumulative (0–14) incidence rates (per million) and standard errors—bone tumours.
Figure 8.8.
Figure 8.8.. Cumulative (0–14) incidence rate—osteosarcoma, Ewing sarcoma and others.
Table 8.8.1.
Table 8.8.1.. Crude, age-standardised (world) and cumulative (0–14) incidence rates (per million) and standard errors— osteosarcoma.
Figure 8.8.1a.
Figure 8.8.1a.. Cumulative (0–14) incidence rate—osteosarcoma.
Figure 8.8.1b.
Figure 8.8.1b.. Age-specific histograms—osteosarcoma.
Table 8.8.2.
Table 8.8.2.. Crude, age-standardised (world) and cumulative (0–14) incidence rates (per million) and standard errors—Ewing sarcoma.
Table 8.9.
Table 8.9.. Crude, age-standardised (world) and cumulative (0–14) incidence rates (per million) and standard errors—soft-tissue sarcomas.
Figure 8.9.
Figure 8.9.. Cumulative (0–14) incidence rate—rhabdomyosarcoma, Kaposi sarcoma and others.
Table 8.9.1.
Table 8.9.1.. Crude, age-standardised (world) and cumulative (0–14) incidence rates (per million) and standard errors—rhabdomyosarcoma.
Figure 8.9.1a.
Figure 8.9.1a.. Cumulative (0–14) incidence rate—rhabdomyosarcoma.
Figure 8.9.1b.
Figure 8.9.1b.. Age-specific histograms—rhabdomyosarcoma.
Table 8.9.2.
Table 8.9.2.. Crude, age-standardised (world) and cumulative (0–14) incidence rates (per million) and standard errors—Kaposi sarcoma.
Figure 8.9.2a.
Figure 8.9.2a.. Cumulative (0–14) incidence rate—Kaposi sarcoma.
Figure 8.9.2b.
Figure 8.9.2b.. Age-specific histograms—Kaposi sarcoma.
Table 8.10.
Table 8.10.. Crude, age-standardised (world) and cumulative (0–14) incidence rates (per million) and standard errors—germ cell tumours.
Figure 8.10a.
Figure 8.10a.. Cumulative (0–14) incidence rate—germ cell tumours.
Figure 8.10b.
Figure 8.10b.. Age-specific histograms—germ cell tumours.
Table 8.11.
Table 8.11.. Crude, age-standardised (world) and cumulative (0–14) incidence rates (per million) and standard errors—carcinomas.
Figure 8.11a.
Figure 8.11a.. Cumulative (0–14) incidence rate—carcinomas.
Figure 8.11b.
Figure 8.11b.. Age-specific histograms—carcinomas.
Table 5.2.
Table 5.2.. Table of incidence rates from one registry.
Table 5.3.
Table 5.3.. The lowest and highest deciles of incidence rates (per million) of childhood cancer in Vol IX.
Table 5.4.
Table 5.4.. Percentage of microscopically verified cases – both sexes.
None
None
None

References

    1. Stiller CA, Parkin DM. Geographic and ethnic variations in the incidence of childhood cancer. Br Med Bull. 1996;52(4):682–703. doi: 10.1093/oxfordjournals.bmb.a011577. - DOI - PubMed
    1. Gakunga R, Parkin DM African Cancer Registry N. Cancer registries in Africa 2014: a survey of operational features and uses in cancer control planning. Int J Cancer. 2015;137(9):2045–2052. doi: 10.1002/ijc.29668. - DOI - PubMed
    1. Steliarova-Foucher E, Colombet M, et al. International incidence of childhood cancer, 2001-10: a population-based registry study. Lancet Oncol. 2017 doi: 10.1016/S1470-2045(17)30186-9. - DOI - PMC - PubMed
    1. Parkin DM, Kramárová E, Draper GJ, et al. IARC Scientific Publications 144; 1998. International incidence of childhood cancer, vol. II.
    1. Parkin DM FJ, Hamdi-Chérif M, Sitas F, et al. IARC Scientific Publications 153; 2003. Cancer in Africa: epidemiology and prevention; pp. 1–414. - PubMed

LinkOut - more resources