

Identification of genes associated with castration‑resistant prostate cancer by gene expression profile analysis
- PMID: 28901445
- PMCID: PMC5865838
- DOI: 10.3892/mmr.2017.7488
Identification of genes associated with castration‑resistant prostate cancer by gene expression profile analysis
Abstract
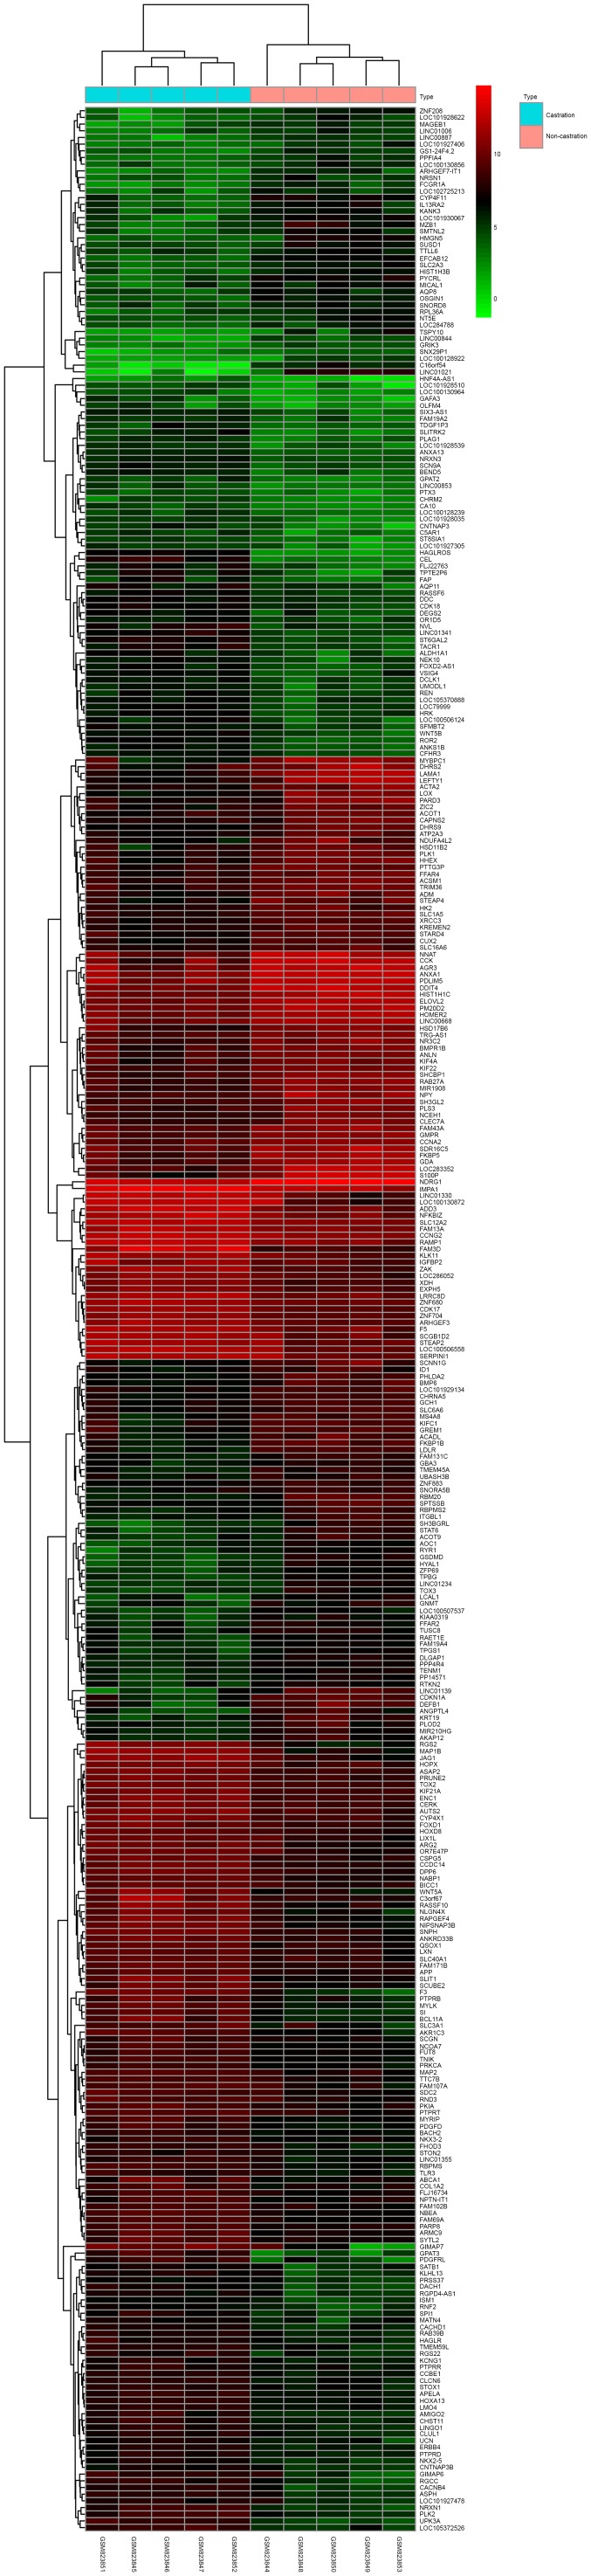
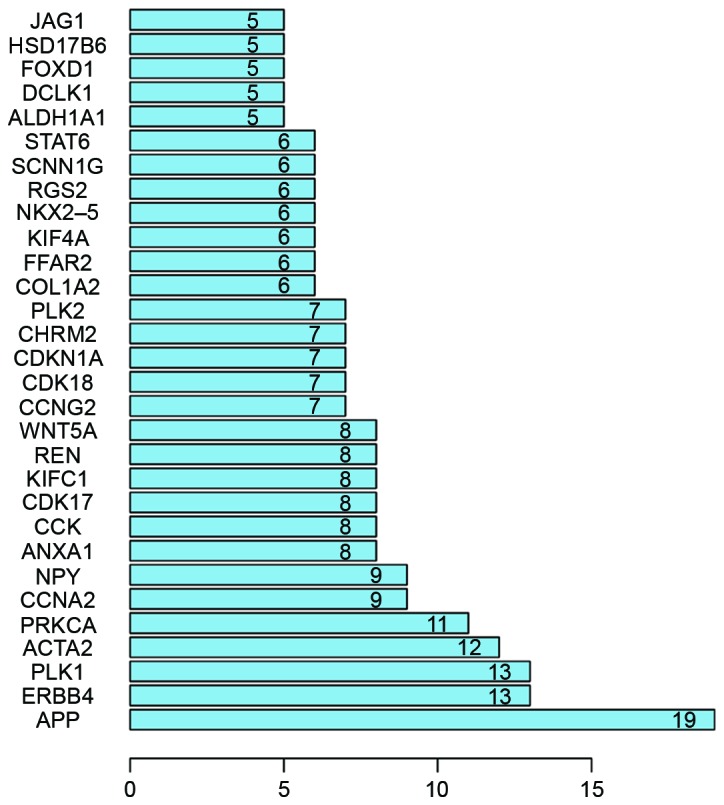
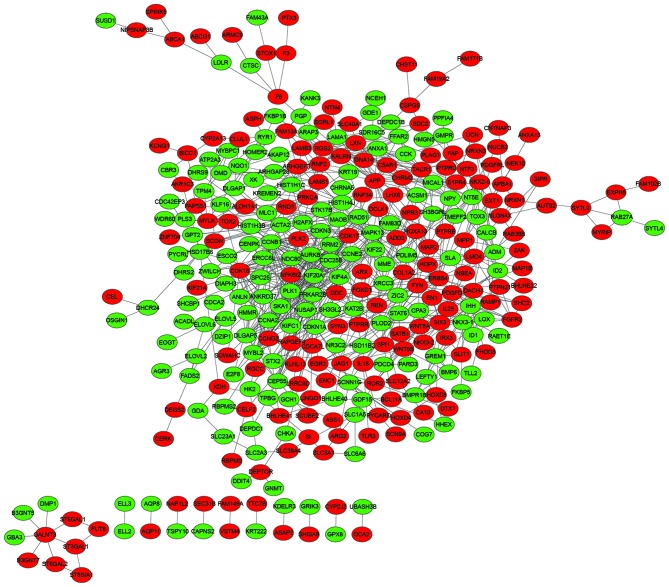
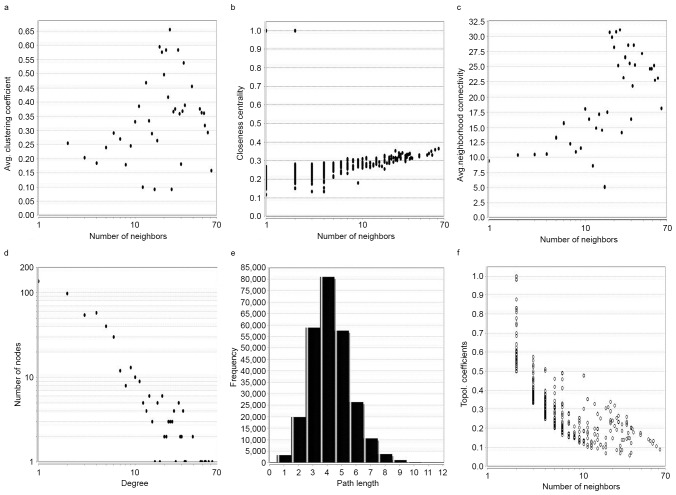
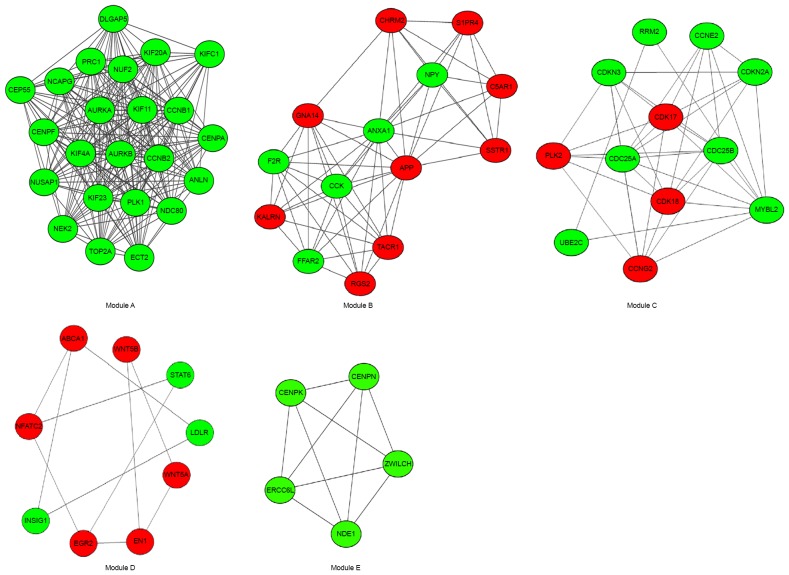
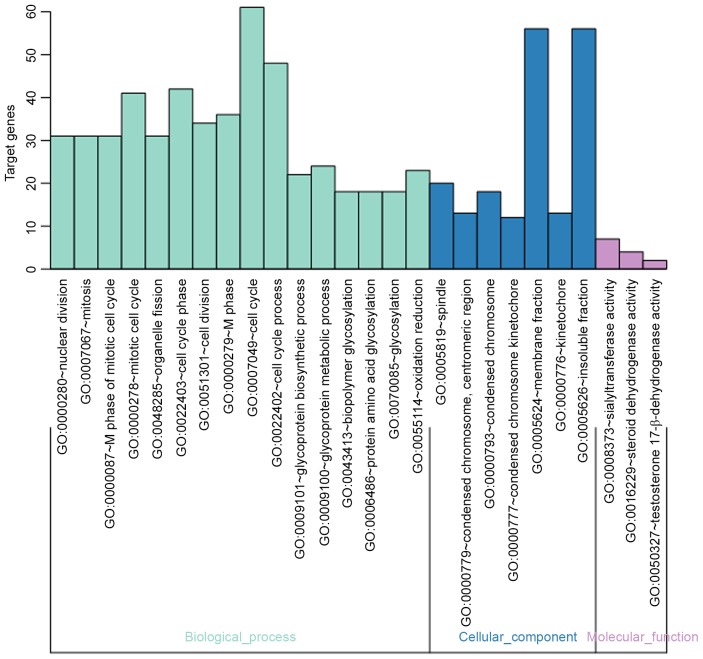
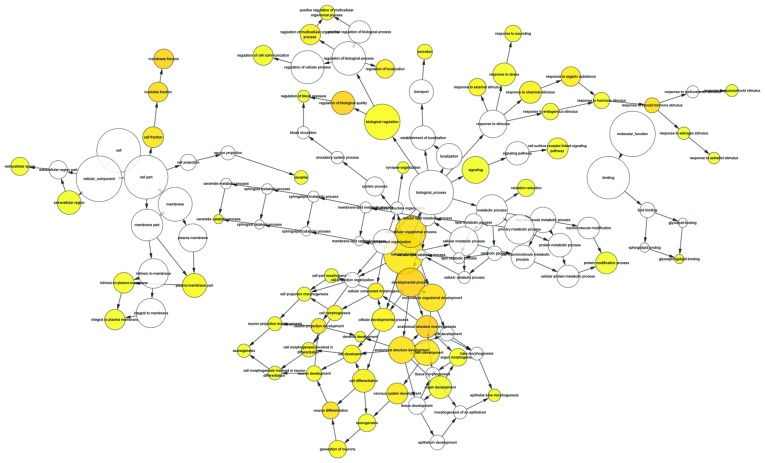
Prostate cancer (CaP) is a serious and common genital tumor. Generally, men with metastatic CaP can easily develop castration‑resistant prostate cancer (CRPC). However, the pathogenesis and tumorigenic pathways of CRPC remain to be elucidated. The present study performed a comprehensive analysis on the gene expression profile of CRPC in order to determine the pathogenesis and tumorigenic of CRPC. The GSE33316 microarray, which consisted of 5 non‑castrated samples and 5 castrated samples, was downloaded from the gene expression omnibus database. Subsequently, 201 upregulated and 161 downregulated differentially expressed genes (DEGs) were identified using the limma package in R and those genes were classified and annotated by plugin Mcode of Cytoscape. Gene ontology (GO) and Kyoto Encyclopedia of Genes and Genomes (KEGG) pathway enrichment analyses were performed using Database for Annotation, Visualization and Integrated Discovery and KEGG Orthology Based Annotation System 2.0 online tools to investigate the function of different gene modules. The BiNGO tool was used to visualize the level of enriched GO terms. Protein‑protein interaction network was constructed using STRING and analyzed with Cytoscape. In conclusion, the present study determined that aldo‑keto reductase 3, cyclin B2, regulator of G protein signaling 2, nuclear factor of activated T‑cells and protein kinase C a may have important roles in the development of CRPC.
Figures
Similar articles
-
Gene expression profiling analysis of castration-resistant prostate cancer.Med Sci Monit. 2015 Jan 16;21:205-12. doi: 10.12659/MSM.891193. Med Sci Monit. 2015. PMID: 25592164 Free PMC article.
-
Identification of PTPRR and JAG1 as key genes in castration-resistant prostate cancer by integrated bioinformatics methods.J Zhejiang Univ Sci B. 2020 Mar.;21(3):246-255. doi: 10.1631/jzus.B1900329. J Zhejiang Univ Sci B. 2020. PMID: 32133801 Free PMC article.
-
Screening of the prognostic targets for breast cancer based co-expression modules analysis.Mol Med Rep. 2017 Oct;16(4):4038-4044. doi: 10.3892/mmr.2017.7063. Epub 2017 Jul 21. Mol Med Rep. 2017. PMID: 28731166 Free PMC article.
-
Expression profiles analysis identifies the values of carcinogenesis and the prognostic prediction of three genes in adrenocortical carcinoma.Oncol Rep. 2019 Apr;41(4):2440-2452. doi: 10.3892/or.2019.7021. Epub 2019 Feb 19. Oncol Rep. 2019. PMID: 30816525
-
Integrated analysis of differentially expressed genes and pathways in triple‑negative breast cancer.Mol Med Rep. 2017 Mar;15(3):1087-1094. doi: 10.3892/mmr.2017.6101. Epub 2017 Jan 4. Mol Med Rep. 2017. PMID: 28075450 Free PMC article.
Cited by
-
Endocrine Disrupting Chemicals Influence Hub Genes Associated with Aggressive Prostate Cancer.Int J Mol Sci. 2023 Feb 6;24(4):3191. doi: 10.3390/ijms24043191. Int J Mol Sci. 2023. PMID: 36834602 Free PMC article.
-
Identification of Critical Molecular Factors and Side Effects Underlying the Response to Thalicthuberine in Prostate Cancer: A Systems Biology Approach.Avicenna J Med Biotechnol. 2023 Jan-Mar;15(1):53-64. doi: 10.18502/ajmb.v15i1.11425. Avicenna J Med Biotechnol. 2023. PMID: 36789117 Free PMC article.
-
Identification of a 12-Gene Signature and Hub Genes Involved in Kidney Wilms Tumor via Integrated Bioinformatics Analysis.Front Oncol. 2022 Apr 11;12:877796. doi: 10.3389/fonc.2022.877796. eCollection 2022. Front Oncol. 2022. PMID: 35480093 Free PMC article.
-
Stemness Related Genes Revealed by Network Analysis Associated With Tumor Immune Microenvironment and the Clinical Outcome in Lung Adenocarcinoma.Front Genet. 2020 Sep 16;11:549213. doi: 10.3389/fgene.2020.549213. eCollection 2020. Front Genet. 2020. PMID: 33193623 Free PMC article.
-
Prognostic Genes of Breast Cancer Identified by Gene Co-expression Network Analysis.Front Oncol. 2018 Sep 11;8:374. doi: 10.3389/fonc.2018.00374. eCollection 2018. Front Oncol. 2018. PMID: 30254986 Free PMC article.
References
-
- Guinney J, Wang T, Laajala TD, Winner KK, Bare JC, Neto EC, Khan SA, Peddinti G, Airola A, Pahikkala T, et al. Prediction of overall survival for patients with metastatic castration-resistant prostate cancer: Development of a prognostic model through a crowdsourced challenge with open clinical trial data. Lancet Oncol. 2017;18:132–142. doi: 10.1016/S1470-2045(16)30560-5. - DOI - PMC - PubMed
-
- Schmid S, Omlin A, Blum D, Strasser F, Gillessen S, Rothermundt C. Assessment of anticancer-treatment outcome in patients with metastatic castration-resistant prostate cancer-going beyond PSA and imaging, a systematic literature review. Ann Oncol. 2015;26:2221–2247. doi: 10.1093/annonc/mdv326. - DOI - PubMed
MeSH terms
Substances
LinkOut - more resources
Full Text Sources
Other Literature Sources
Miscellaneous
