. 2017 Sep;44(9):e279-e296.
doi: 10.1002/mp.12445.

Investigating simulation-based metrics for characterizing linear iterative reconstruction in digital breast tomosynthesis

Affiliations

Investigating simulation-based metrics for characterizing linear iterative reconstruction in digital breast tomosynthesis

Sean D Rose et al. Med Phys. 2017 Sep.

Abstract

Purpose: Simulation-based image quality metrics are adapted and investigated for characterizing the parameter dependences of linear iterative image reconstruction for DBT.

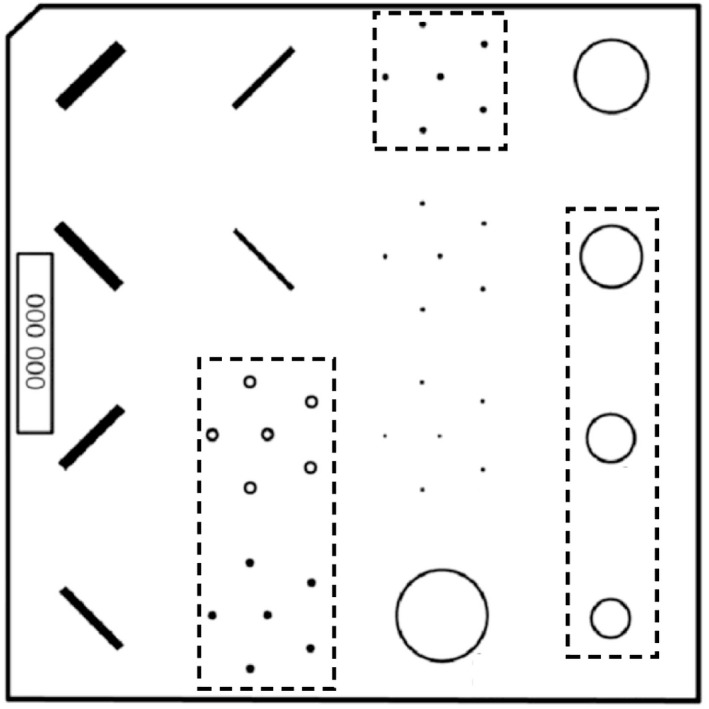
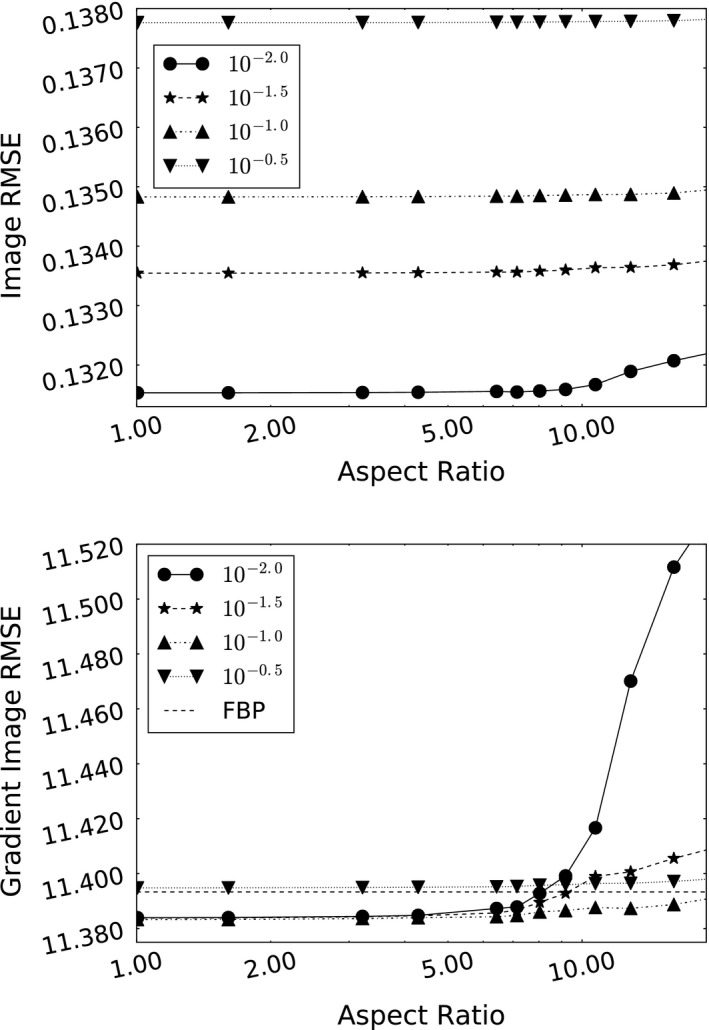
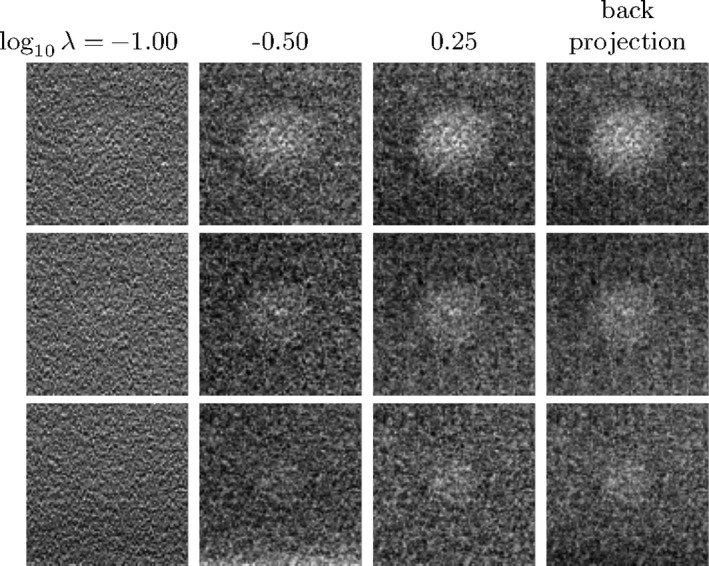
Methods: Three metrics based on a 2D DBT simulation are investigated: (1) a root-mean-square-error (RMSE) between the test phantom and reconstructed image, (2) a gradient RMSE where the comparison is made after taking a spatial gradient of both image and phantom, and (3) a region-of-interest (ROI) Hotelling observer (HO) for signal-known-exactly/background-known-exactly (SKE/BKE) and signal-known-exactly/background-known-statistically (SKE/BKS) detection tasks. Two simulation studies are performed using the aforementioned metrics, varying voxel aspect ratio, and regularization strength for two types of Tikhonov-regularized least-squares optimization. The RMSE metrics are applied to a 2D test phantom with resolution bar patterns at varying angles, and the ROI-HO metric is applied to two tasks relevant to DBT: lesion detection, modeled by use of a large, low-contrast signal, and microcalcification detection, modeled by use of a small, high-contrast signal. The RMSE metric trends are compared with visual assessment of the reconstructed bar-pattern phantom. The ROI-HO metric trends are compared with 3D reconstructed images from ACR phantom data acquired with a Hologic Selenia Dimensions DBT system.

Results: Sensitivity of the image RMSE to mean pixel value is found to limit its applicability to the assessment of DBT image reconstruction. The image gradient RMSE is insensitive to mean pixel value and appears to track better with subjective visualization of the reconstructed bar-pattern phantom. The ROI-HO metric shows an increasing trend with regularization strength for both forms of Tikhonov-regularized least-squares; however, this metric saturates at intermediate regularization strength indicating a point of diminishing returns for signal detection. Visualization with the reconstructed ACR phantom images appear to show a similar dependence with regularization strength.

Conclusions: From the limited studies presented it appears that image gradient RMSE trends correspond with visual assessment better than image RMSE for DBT image reconstruction. The ROI-HO metric for both detection tasks also appears to reflect visual trends in the ACR phantom reconstructions as a function of regularization strength. We point out, however, that the true utility of these metrics can only be assessed after amassing more data.

Keywords: Hotelling observer; digital breast tomosynthesis; image reconstruction; model observers; signal detection.


Conflict of interest statement

The authors have no relevant conflicts of interest to disclose.

Figures

Figure 1
Figure 1
Diagram illustrating system geometry and the scanning‐arc plane used for RMSE and the ROI‐Hotelling observer calculations.
Figure 2
Figure 2
Schematic illustrating ROIs within the scanning‐arc plane used in calculating the ROI‐HO template. (a) ROIrecon used for calculating reconstruction operator. (b) ROIHO used for computing signal detection signal‐to‐noise ratio.
Figure 3
Figure 3
Simulation phantom used for RMSE studies (top) and ROI for visualization (bottom). Coordinate axis directions are also shown. Attenuation coefficients for each part of the phantom were evaluated at 20 keV. The background is fatty tissue, while the bars on the left and lines on the right are fibroglandular. The lines on the right are interpreted as cross sections of disks in the plane parallel to the detector in 3D. The specks in the center are calcium and are displayed at five times actual size for ease of visualization. Display window: [0.15, 0.60] cm1.
Figure 4
Figure 4
Diagram of ACR phantom. Dashed ROIs are used for visualization in the ACR study.
Figure 5
Figure 5
Image RMSE (top) and gradient image RMSE (bottom) as a function of relative pixel size at four regularization strengths for LSQI reconstruction. Legends indicate value of regularization parameter λ.
Figure 6
Figure 6
FBP reference and LSQI reconstructions at three different regularization strengths at an aspect ratio of 10.7. LSQI display window: [0.15, 0.55] cm1. FBP display window: [‐0.05,0.06] cm1.
Figure 7
Figure 7
LSQI reconstructions at λ=102.0 and three aspect ratios. Aspect ratios are displayed above each image. Display window: [0.15, 0.55] cm1.
Figure 8
Figure 8
Image RMSE (top) and gradient image RMSE (bottom) as a function of relative pixel size at four regularization strengths for LSQD reconstruction. Legends indicate value of regularization parameter λ.
Figure 9
Figure 9
LSQD reconstructions at three different regularization strengths at an aspect ratio of 10.7. Display window: [0.15, 0.65] cm1. FBP display window: [‐0.05,0.06] cm1
Figure 10
Figure 10
LSQD reconstructions at λ=102.0 and three aspect ratios. Aspect ratios are displayed above each image. Display window: [0.15, 0.65] cm1
Figure 11
Figure 11
Hotelling observer efficiency ε for disk (top) and calcification (bottom) SKE/BKE detection tasks as a function of regularization strength for LSQI reconstruction. Legends indicate size of ROI (value of l) used for estimating the reconstruction operator.
Figure 12
Figure 12
Hotelling observer efficiency ε for disk (top) and calcification (bottom) SKE/BKE detection tasks with variable background as a function of regularization strength for LSQD reconstruction.
Figure 13
Figure 13
Hotelling observer efficiency ε for disk and calcification SKE/BKE detection tasks as a function of spectral filter cutoff frequency for FBP reconstruction. Note the x‐axis is inverted so regularization strength increases from left to right.
Figure 14
Figure 14
Hotelling observer relative efficiency ϵr for disk (top) and calcification (bottom) SKE/BKS detection tasks as a function of regularization strength for LSQI reconstruction. Dashed lines show HO efficiency ε for the corresponding SKE/BKE task.
Figure 15
Figure 15
Hotelling observer relative efficiency ϵr for disk (top) and calcification (bottom) SKE/BKS detection tasks as a function of regularization strength for LSQD reconstruction. Dashed lines show HO efficiency ε for the corresponding SKE/BKE task.
Figure 16
Figure 16
ROIs of LSQI reconstructions containing 0.25, 0.5, and 0.75 cm disks of ACR phantom. Regularization increases from left to right. Back projection image is shown for reference.
Figure 17
Figure 17
ROIs of LSQI reconstructions containing 0.54, 0.40, and 0.32 mm specks of ACR phantom. Regularization increases from left to right. Back projection image is shown for reference.
Figure 18
Figure 18
ROIs of LSQD reconstructions containing 0.25, 0.5, and 0.75 cm disks of ACR phantom. Regularization increases from left to right.
Figure 19
Figure 19
ROIs of LSQD reconstructions containing 0.54, 0.40, and 0.32 mm specks of ACR phantom. Regularization increases from left to right.
Figure 20
Figure 20
ROIs of LSQI reconstructions of altered ACR phantom data with added nonuniform background. ROIs contain 0.25, 0.5, and 0.75 cm disks of ACR phantom. Regularization increases from left to right. Back projection image is shown for reference.
Figure 21
Figure 21
ROIs of LSQI reconstructions of altered ACR phantom data with added nonuniform background. ROIs contain 0.54, 0.40, and 0.32 mm specks of ACR phantom. Regularization increases from left to right. Back projection image is shown for reference.
Figure 22
Figure 22
ROIs of LSQD reconstructions of altered ACR phantom data with added nonuniform background. ROIs contain 0.25, 0.5, and 0.75 cm disks of ACR phantom. Regularization increases from left to right.
Figure 23
Figure 23
ROIs of LSQD reconstructions of altered ACR phantom data with added nonuniform background. ROIs contain 0.54, 0.40, and 0.32 mm specks of ACR phantom. Regularization increases from left to right.

Similar articles

Cited by

References

    1. Sechopoulos I. A review of breast tomosynthesis. Part II. Image reconstruction. Med Phys. 2013;40:14302–16003. - PMC - PubMed
    1. Wu T, Moore RH, Rafferty EA, Kopans DB. A comparison of reconstruction algorithms for breast tomosynthesis. Med Phys. 2004;31:2636–2647. - PubMed
    1. Hu Y‐H, Zhao B, Zhao W. Image artifacts in digital breast tomosynthesis: investigation of the effects of system geometry and reconstruction parameters using a linear system approach. Med Phys. 2008;35:5242–5252. - PMC - PubMed
    1. Sechopoulos I, Ghetti C. Optimization of the acquisition geometry in digital tomosynthesis of the breast. Med Phys. 2009;36:1199–1207. - PubMed
    1. Saunders RS, Samei E, Lo JY, Baker JA. Can compression be reduced for breast tomosynthesis? Monte carlo study on mass and microcalcification conspicuity in tomosynthesis. Radiology 2009;251:673–682. - PubMed