. 2017 Sep 21;549(7672):345-350.
doi: 10.1038/nature23888. Epub 2017 Sep 13.

Rabies screen reveals GPe control of cocaine-triggered plasticity

Affiliations

Rabies screen reveals GPe control of cocaine-triggered plasticity

Kevin T Beier et al. Nature. .

Abstract

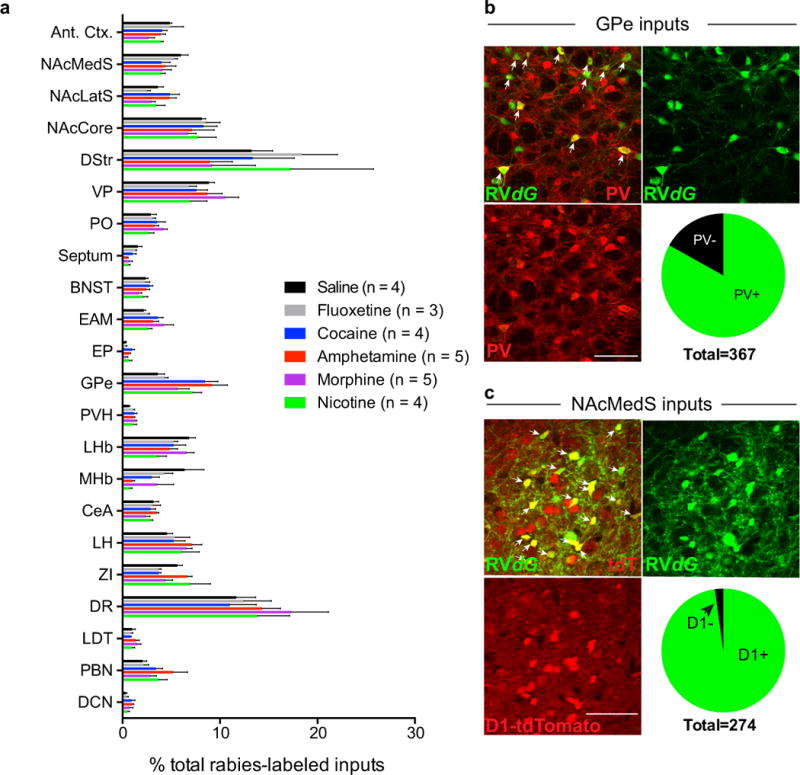
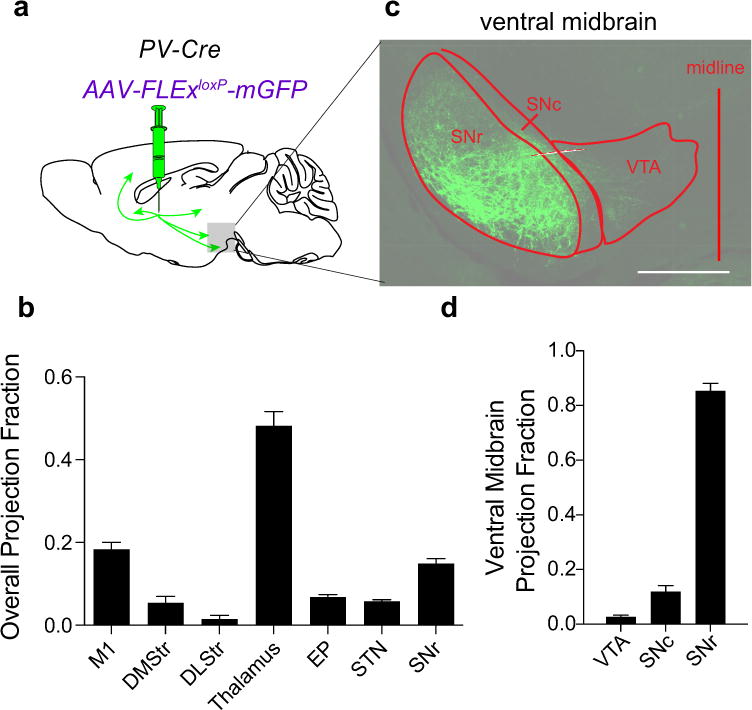
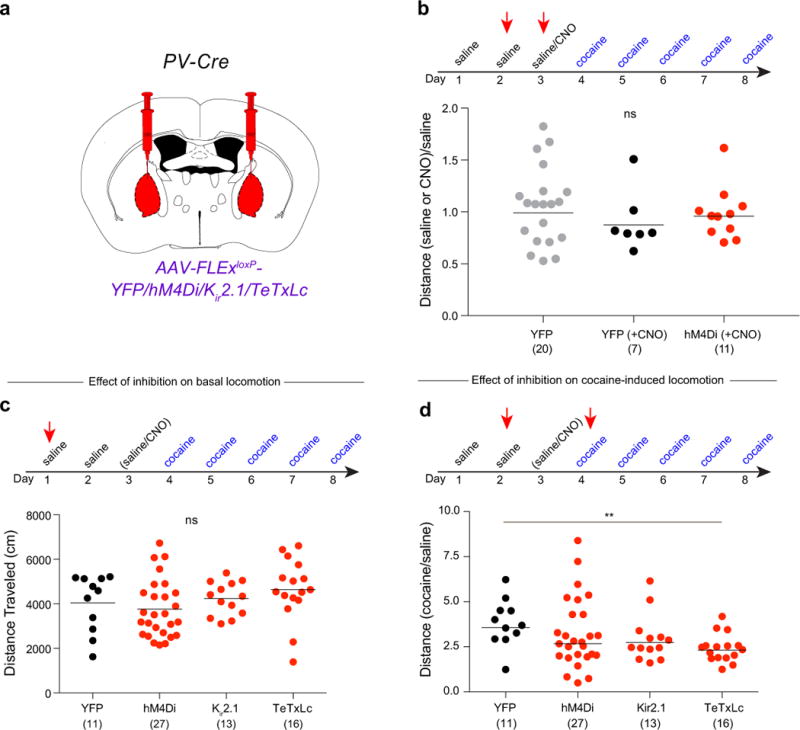
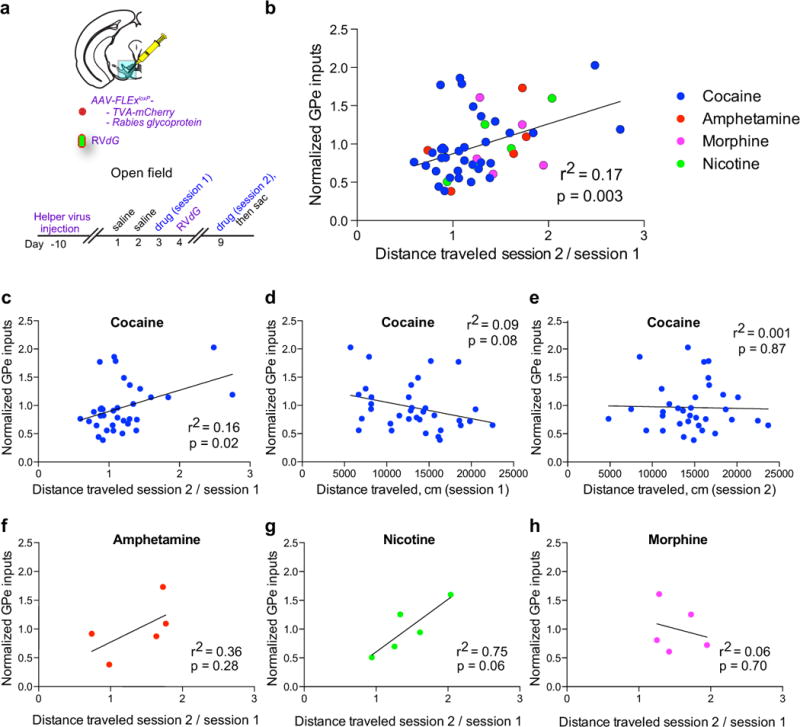
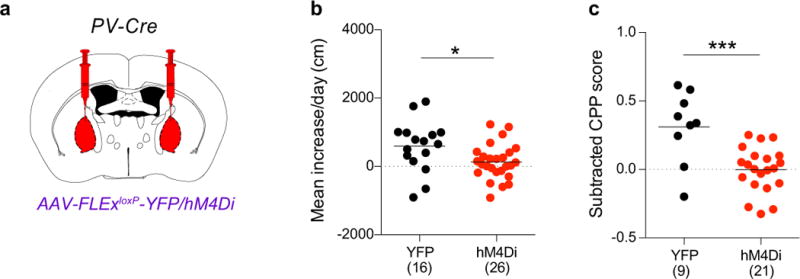
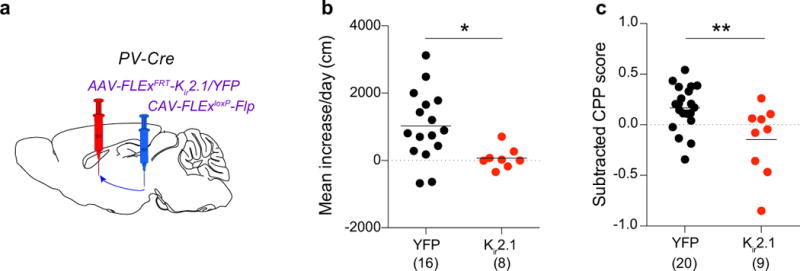
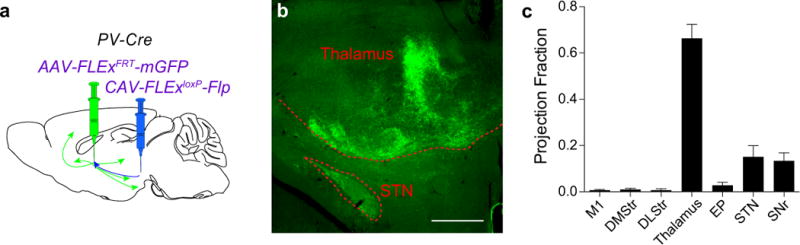
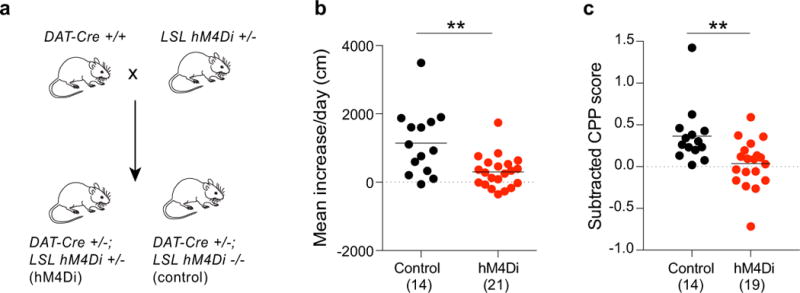
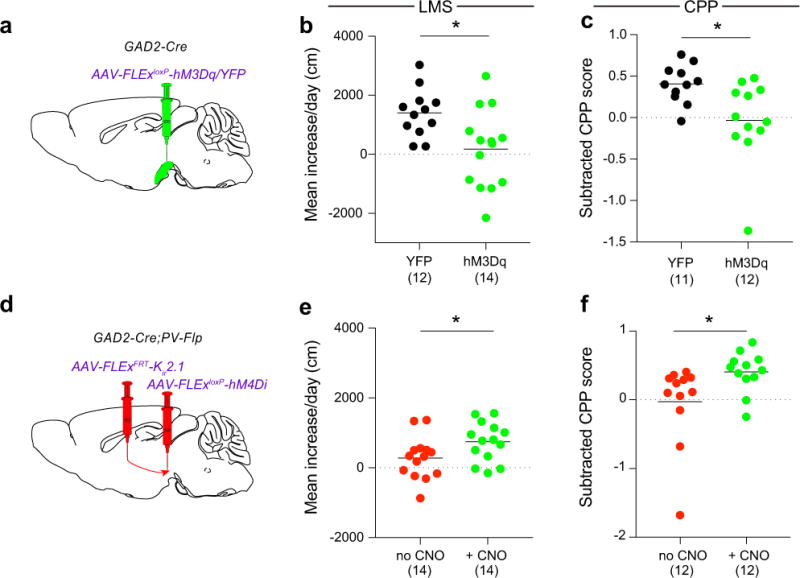
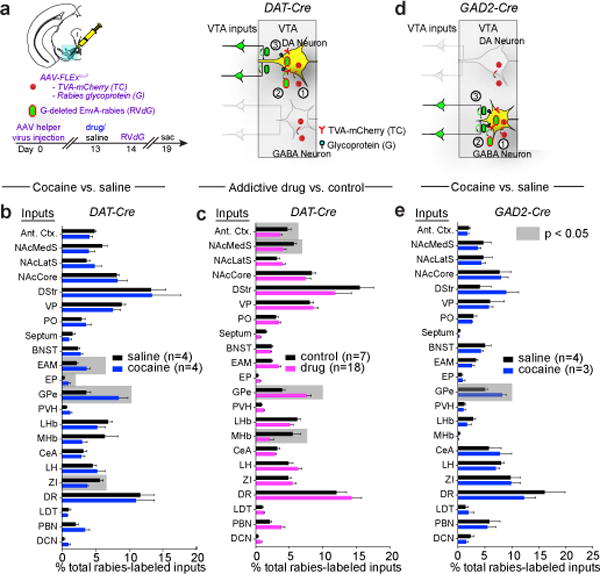
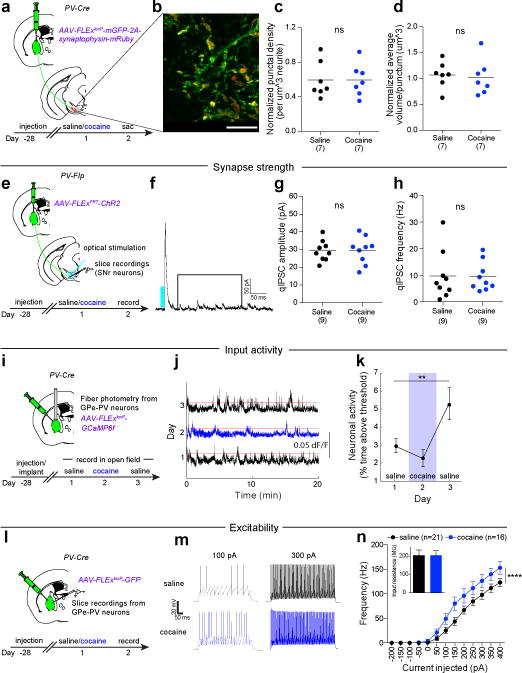
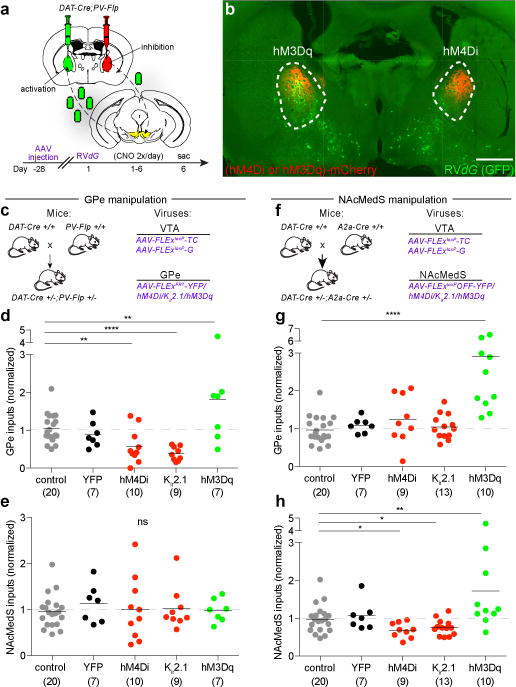
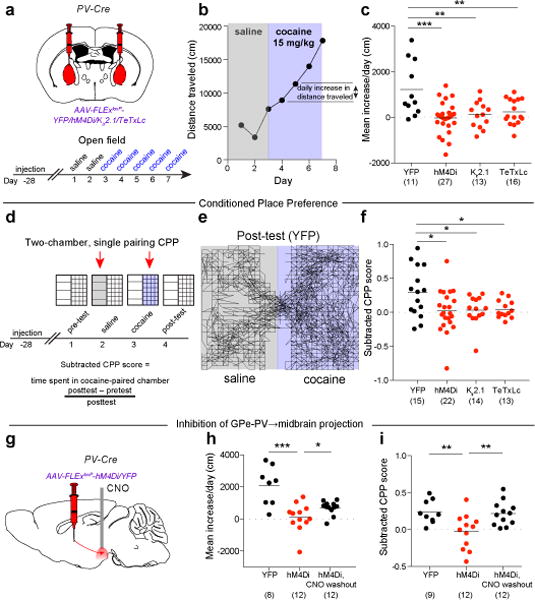
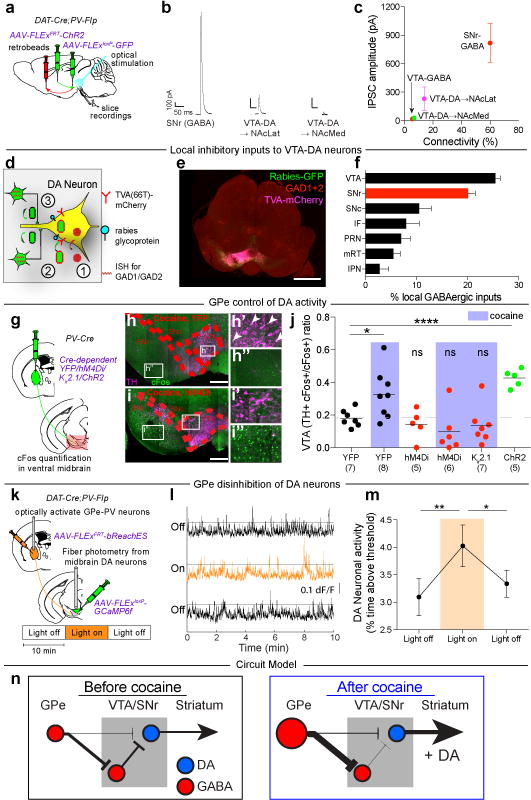
Identification of neural circuit changes that contribute to behavioural plasticity has routinely been conducted on candidate circuits that were preselected on the basis of previous results. Here we present an unbiased method for identifying experience-triggered circuit-level changes in neuronal ensembles in mice. Using rabies virus monosynaptic tracing, we mapped cocaine-induced global changes in inputs onto neurons in the ventral tegmental area. Cocaine increased rabies-labelled inputs from the globus pallidus externus (GPe), a basal ganglia nucleus not previously known to participate in behavioural plasticity triggered by drugs of abuse. We demonstrated that cocaine increased GPe neuron activity, which accounted for the increase in GPe labelling. Inhibition of GPe activity revealed that it contributes to two forms of cocaine-triggered behavioural plasticity, at least in part by disinhibiting dopamine neurons in the ventral tegmental area. These results suggest that rabies-based unbiased screening of changes in input populations can identify previously unappreciated circuit elements that critically support behavioural adaptations.


Figures

Extended Data Figure 1
Extended Data Figure 1. Changes to VTA-DA inputs induced by drugs of abuse
a, Quantification of monosynaptic inputs to VTA-DA neurons labeled in animals receiving single dose administration of either cocaine, amphetamine, nicotine, morphine, saline, or fluoxetine one day prior to injection of RVdG into the VTA. Data were combined to generate Fig. 1c. b, Sample images of GPe neurons labeled by RVdG and co-stained for PV. Pie graph shows proportion of labeled cells that co-stained for PV. c, Sample images of NAcMedS neurons labeled by RVdG in DAT-Cre;D1-tdTomato mice. Pie graph shows proportion of labeled cells that were D1+ as defined by presence of tdTomato (scale bars = 50 μm).
Extended Data Figure 2
Extended Data Figure 2. Axonal projections of GPe-PV neurons
a, AAV-FLExloxP-mGFP was injected into the GPe of PV-Cre animals, and mGFP+ axons were quantified throughout the brain. b, Quantification of fraction of mGFP+ axons in the indicated brain regions. c, Sample image of mGFP+ axons in the ventral midbrain (scale bar = 500 μm). d, Quantification of fraction of mGFP+ axons in the indicated ventral midbrain brain regions. The schematics of the mouse brain in this figure were adapted from ref. .
Extended Data Figure 3
Extended Data Figure 3. Inhibition of GPe-PV neuron activity modestly affects cocaine-induced locomotion
a, Cre-dependent AAVs expressing YFP, hM4Di, Kir2.1, or TeTxLc were injected into the GPe of PV-Cre animals. b, Quantification of effects of CNO on basal locomotion in animals expressing YFP or hM4Di (compared to YFP + saline: YFP + CNO, p = 0.36; hM4Di + CNO, p = 0.59). c, Quantification of basal locomotion during GPe-PV neuron inhibition (hM4Di, p = 0.54; Kir2.1, p = 0.66; TeTxLc, p = 0.27). d, Quantification of cocaine-induced locomotion during GPe-PV neuron inhibition (hM4Di, p = 0.37; Kir2.1, p = 0.12; TeTxLc, p = 0.002). The schematics of the mouse brain in this figure were adapted from ref. .
Extended Data Figure 4
Extended Data Figure 4. Labeled GPe inputs to the VTA correlated with LMS
a, AAV-FLExloxP-TC and AAV-FLExloxP-G were injected into the VTA of DAT-Cre mice. Eleven days later, animals were habituated for two days to an open field chamber, and given a drug injection the following day. RVdG was injected one day after the drug. Five days after RVdG injection, the animal was given a second injection of the same drug in the open field. b, Normalized labeled GPe inputs plotted against the relative locomotion in session 2 vs. session 1 for cocaine (n = 34), amphetamine (n = 5), nicotine (n = 5), and morphine (n = 5). Regression line is plotted for all drugs combined. c-e, Labeled GPe inputs after a single dose of cocaine significantly correlated with LMS (c), but not total locomotion after the first (d) or second (e) dose of cocaine. f-h, Plots of labeled GPe inputs vs. LMS for (f) amphetamine (1 mg/kg), (g) nicotine (0.5 mg/kg), or (h) morphine (10 mg/kg). The schematics of the mouse brain in this figure were adapted from ref. .
Extended Data Figure 5
Extended Data Figure 5. Inhibition of the GPe prevents morphine LMS and CPP
a, A Cre-dependent AAV expressing either YFP or hM4Di was injected into the GPe of PV-Cre animals. b, c, Quantification of LMS (b; p = 0.022) and CPP (c; p = 0.0005) in animals in which YFP or hM4Di (activated by CNO) were expressed in GPe-PV neurons. The schematics of the mouse brain in this figure were adapted from ref. .
Extended Data Figure 6
Extended Data Figure 6. Inhibition of GPe-PV→midbrain projection neurons blocks cocaine CPP and LMS
a, CAV-FLExloxP-Flp was injected into the ventral midbrain, and AAV-FLExFRT-Kir2.1 or AAV-FLExFRT-YFP was injected into the GPe of PV-Cre mice. b, c, Quantification of LMS (b; p = 0.019) and CPP (c; p = 0.0067) in animals in which YFP or Kir2.1 were expressed in GPe-PV neurons projecting to the ventral midbrain. The schematics of the mouse brain in this figure were adapted from ref. .
Extended Data Figure 7
Extended Data Figure 7. GPe-PV→midbrain neurons collateralize to multiple subcortical targets
a, CAV-FLExloxP-Flp was injected into the ventral midbrain, and AAV-FLExFRT-mGFP was injected into in the GPe of PV-Cre mice. b, Representative image of mGFP+ collaterals in the thalamus and subthalamic nucleus (STN) (scale bar = 500 μm). c, Quantification of projection fraction of collaterals to indicated target regions. The schematics of the mouse brain in this figure were adapted from ref. .
Extended Data Figure 8
Extended Data Figure 8. DA neuron activity is required for the development of LMS and CPP
a, Breeding scheme for experiments. LSL = loxP stop loxP. b, c, Quantification of LMS (b; p = 0.001) and CPP (c; p = 0.005) in control animals or animals expressing hM4Di in DA neurons receiving CNO.
Extended Data Figure 9
Extended Data Figure 9. Map of anatomical location of ventral midbrain cells from which whole cell recordings were made
Individual dots indicate location of cells in which ChR2-evoked IPSCs due to ChR2 expression in GPe-PV neurons could be detected (connected) or not (not connected) in NAcLat-projecting (a) or NAcMed-projecting (b) VTA-DA neurons, and SNr-GABA (c) or VTA-GABA (d) cells. The schematics of the mouse brain in this figure were adapted from ref. .
Extended Data Figure 10
Extended Data Figure 10. GPe-PV neurons mediate their effects through SNr-GABA neurons
a, Procedure to test LMS and CPP during SNr-GABA activation. b, c, Activating SNr-GABA neurons with CNO prevented LMS (b; p = 0.010) and CPP (c; p = 0.015). d, Injection strategy to test if SNr-GABA neurons are downstream of GPe-PV neurons. e, f, While expression of Kir2.1 in GPe-PV neurons prevented LMS and CPP, this suppression was overcome by concurrent inhibition of SNr-GABA neurons (e; p = 0.035, f; p = 0.036). The schematics of the mouse brain in this figure were adapted from ref. .
Figure 1
Figure 1. Cocaine-induced changes to VTA neuron inputs
a, Strategy for labeling inputs to VTA-DA neurons. b, Fraction of total GFP+ inputs from each site relative to total quantified inputs. Highlighted regions represent p < 0.05 (p = 0.04, 0.04, 0.02, 0.02 for EAM, EP, GPe, and ZI, respectively). c, Combined data for administration of drug of abuse (n = 4, 5, 5, 4 for cocaine, amphetamine, morphine, and nicotine, respectively) or control (saline, n = 4; fluoxetine, n = 3: p = 0.005, 0.007, 0.05, 0.05 for GPe, MHb, NAcMedS, and Ant. Ctx., respectively). d, e, Strategy (d) and quantification (e) of labeling inputs to ventral midbrain GABA neurons (GPe, p = 0.01). In this and subsequent figures, unless otherwise noted, all statistical analyses used paired t-tests, and error bars represent SEM. See Methods for abbreviations of anatomical terms. The schematics of the mouse brain in this figure were adapted from ref. .
Figure 2
Figure 2. Cocaine triggers increase in GPe-PV neuron activity and excitability
a, AAV-FLExloxP-mGFP-2A-synaptophysin-mRuby was injected in GPe of PV-Cre mice to quantify mRuby+ puncta in SNr. b, mGFP+ neurites and mRuby+ puncta from GPe-PV neurons in SNr (scale = 10 μm). c, d, No change in density (c; p = 0.99) or volume (d; p = 0.76) of mRuby puncta was observed. e, AAV-FLExFRT-ChR2 was injected into GPe of PV-Flp mice, and recordings conducted from SNr-GABA neurons in slices from cocaine or saline-treated animals. f, Trace from SNr neuron highlighting the time window for analysis. g, h, No change in quantal IPSC amplitude (g; p = 0.94) or frequency (h; p = 0.94) was observed. i, AAV-FLExloxP-GCaMP6f was injected into GPe of PV-Cre animals to measure PV neuron activity using fiber photometry. j, Traces showing ΔF/F following the first saline, cocaine, and second saline injections. Red = activity threshold of six times the median absolute deviation. k, Percent time activity surpassed threshold (one-way ANOVA, p = 0.018; post-hoc tests day 1 vs. 2, p = 0.17; day 1 vs. 3, p = 0.0049). l, AAV-FLExloxP-GFP was injected into GPe of PV-Cre mice, and recordings made from GFP+ cells. m, Traces from depolarizing current injections. n, Frequency of action potentials over range of current steps (p < 0.0001 for saline vs. cocaine, two-way ANOVA). For this and all subsequent figures, ns p > 0.05, * p ≤ 0.05, ** p ≤ 0.01, *** p ≤ 0.001, **** p ≤ 0.0001. Dot plots include horizontal line representing mean. The schematics of the mouse brain in this figure were adapted from ref. .
Figure 3
Figure 3. Bidirectional modulation of rabies labeling by activity manipulations
a, A mixture of AAV-FLExloxP-TC and AAV-FLExloxP-G was injected into VTA while an AAV expressing a Flp-dependent YFP, hM4Di, Kir2.1, or hM3Dq was injected into GPe. b, Image of rabies labeling in GPe (scale = 1 mm). c, Experimental strategy for d-e. d, Quantification of labeled inputs in GPe when GPe was manipulated. y-axis = labeled GPe inputs/(NAcLat + NAcCore inputs). Combined controls (uninjected and YFP) were assigned a value of 1. GPe inhibition reduced (hM4Di, p = 0.004; Kir2.1, p < 0.0001) while activation increased (hM3Dq, p = 0.016) labeled inputs. e, Quantification of labeled inputs in NAcMedS following GPe activity manipulations (hM4Di, p = 0.98; Kir2.1, p = 0.90; hM3Dq, p = 0.88). f, Experimental strategy for g-h. g, NAcMedS-D1 inhibition had no effect on labeling of GPe inputs (hM4Di, p = 0.13; Kir2.1, p = 0.65) while activation increased labeling (hM3Dq, p < 0.001). h, NAcMedS-D1 inhibition decreased (hM4Di, p = 0.02; Kir2.1, p = 0.03) while activation increased (hM3Dq, p = 0.007) labeling of NAcMedS inputs. The schematics of the mouse brain in this figure were adapted from ref. .
Figure 4
Figure 4. GPe-PV neuron activity is required for cocaine-induced LMS and CPP
a, Cre-dependent AAVs were injected into GPe of PV-Cre animals. b, Plot of locomotor activity for a single animal. c, GPe-PV inhibition blocked cocaine-induced LMS (hM4Di, p = 0.0002; Kir2.1, p = 0.007; TeTxLc, p = 0.008). d, Procedure to test CPP during GPe-PV inhibition. e, Trace from YFP animal during post-test. f, GPe-PV inhibition prevented CPP (hM4Di, p = 0.019; Kir2.1, p = 0.030; TeTxLc, p = 0.029). g, Slow-release CNO microspheres were injected into ventral midbrain in animals expressing hM4Di or YFP in GPe-PV neurons. h, i, Both LMS (h; p = 0.0005) and CPP (i; p = 0.0094) were blocked in hM4Di-expressing animals. When tested again after CNO washout, these same animals developed LMS (h; p = 0.047) and CPP (i; p = 0.0078). The schematics of the mouse brain in this figure were adapted from ref. .
Figure 5
Figure 5. GPe-PV neurons disinhibit VTA-DA neurons
a, AAV-FLExFRT-ChR2 was injected into GPe, AAV-FLExloxP-GFP injected in VTA, and retrobeads injected into NAcLatS or NAcMedS of DAT-Cre;PV-Flp or GAD2-Cre;PV-Flp mice. Whole-cell recordings were made from identified midbrain neurons in acute slices. b, Example light-evoked IPSCs. c, Quantification of percent connectivity and IPSC amplitude for each cell type. d, AAV-FLExloxP-TC66T and AAV-FLExloxP-G were injected into VTA of DAT-Cre mice, followed two weeks later by RVdG. e, Sample labeling of midbrain section (scale = 1 mm). f, Quantification of labeled local inhibitory inputs. g, Cre-dependent AAVs expressing YFP, hM4Di, Kir2.1, or ChR2 were injected into GPe of PV-Cre mice followed by quantification of Fos labeling. h, i, Sections of ventral midbrain showing Fos labeling (green) and tyrosine hydroxylase (TH) labeling (magenta) in animals receiving cocaine injections and expressing YFP (h) or hM4Di (i) in GPe. Arrows indicate Fos+ neurons co-expressing TH (scale = 200 μm). j, Quantification of activated DA neurons (Fos+ TH+) relative to all activated ventral midbrain neurons (Fos+) (cocaine-YFP, p = 0.029; ChR2, p < 0.0001). k, Flp-dependent bReachES was injected in GPe and a Cre-dependent GCaMP6f was injected in VTA of DAT-Cre;PV-Flp mice. l, Fiber photometry traces during consecutive 10 min epochs. m, VTA-DA neurons were more active during light-on than light-off (one-way ANOVA, p = 0.014; post-hoc tests 0-10 vs. 10-20 min, p = 0.008; 10-20 vs. 20-30 min, p = 0.039). n, Proposed circuit diagram before and after cocaine. Size of cell body and arrows represent activity strength. The schematics of the mouse brain in this figure were adapted from ref. .

References

    1. Boyden ES, Zhang F, Bamberg E, Nagel G, Deisseroth K. Millisecond-timescale, genetically targeted optical control of neural activity. Nat Neurosci. 2005;8:1263–1268. - PubMed
    1. Armbruster BN, Li X, Pausch MH, Herlitze S, Roth BL. Evolving the lock to fit the key to create a family of G protein-coupled receptors potently activated by an inert ligand. Proc Natl Acad Sci U S A. 2007;104:5163–5168. - PMC - PubMed
    1. Lin D, et al. Functional identification of an aggression locus in the mouse hypothalamus. Nature. 2011;470:221–226. - PMC - PubMed
    1. Ye L, et al. Wiring and molecular features of prefrontal ensembles representing distinct experiences. Cell. 2016;165:1776–1788. - PMC - PubMed
    1. Watabe-Uchida M, Zhu L, Ogawa SK, Vamanrao A, Uchida N. Whole-brain mapping of direct inputs to midbrain dopamine neurons. Neuron. 2012;74:858–873. - PubMed

Publication types