. 2017 Sep 28;549(7673):482-487.
doi: 10.1038/nature23909. Epub 2017 Sep 13.

Reversing behavioural abnormalities in mice exposed to maternal inflammation

Affiliations

Reversing behavioural abnormalities in mice exposed to maternal inflammation

Yeong Shin Yim et al. Nature. .

Abstract

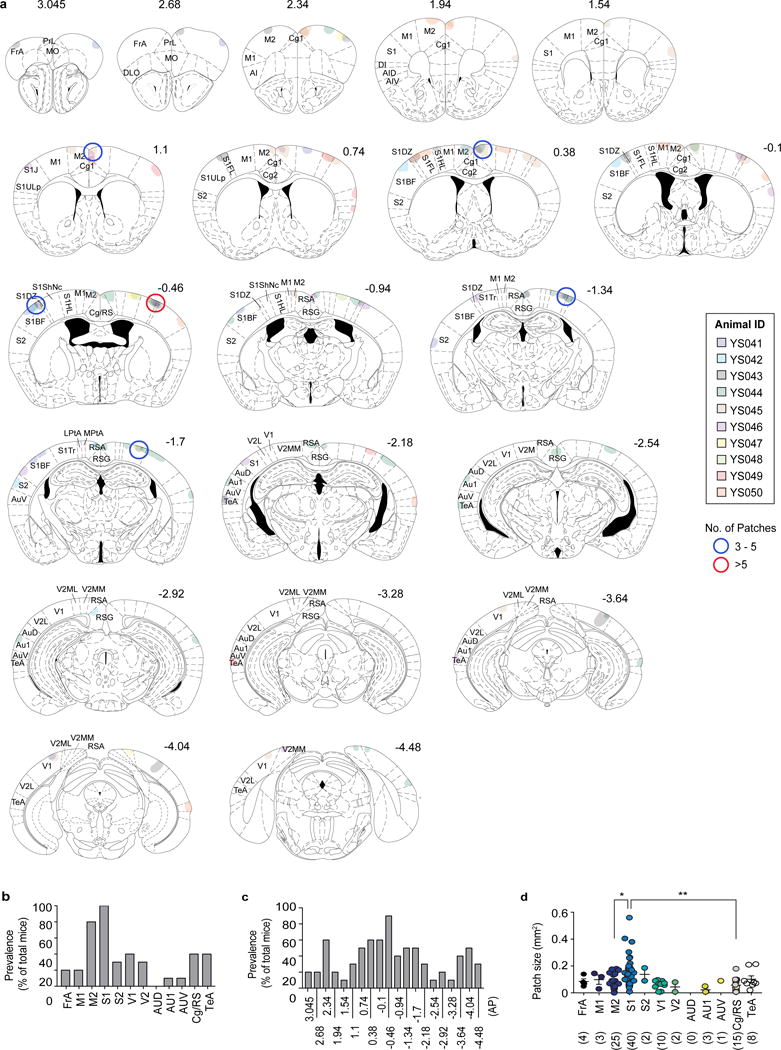
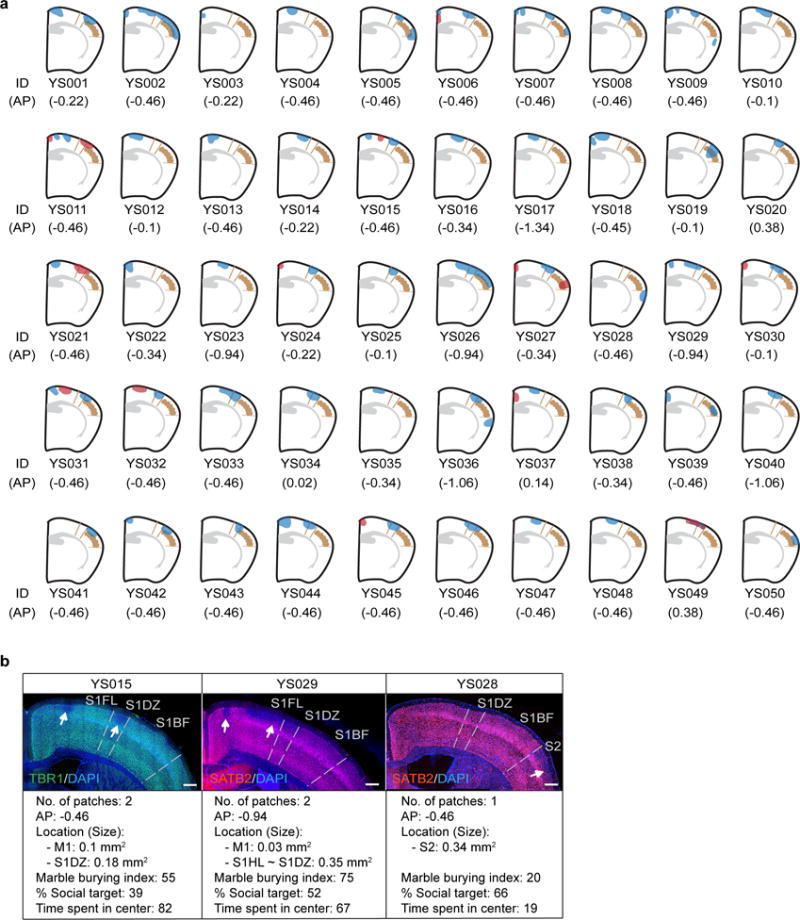
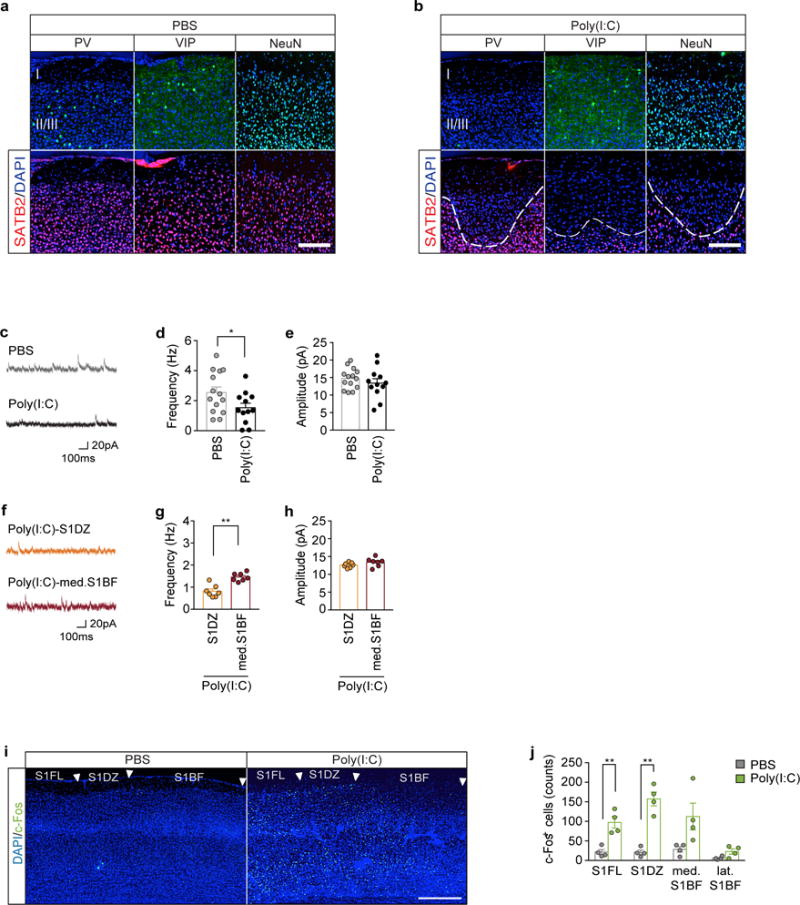
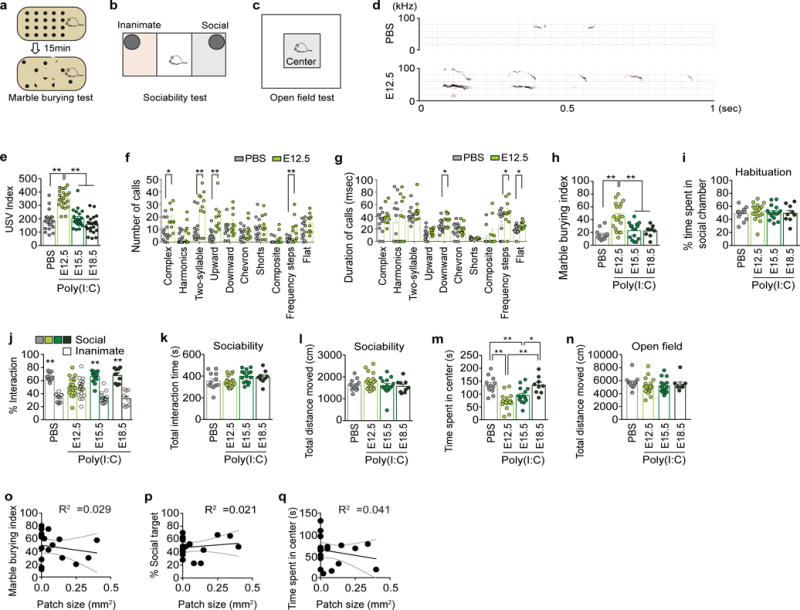
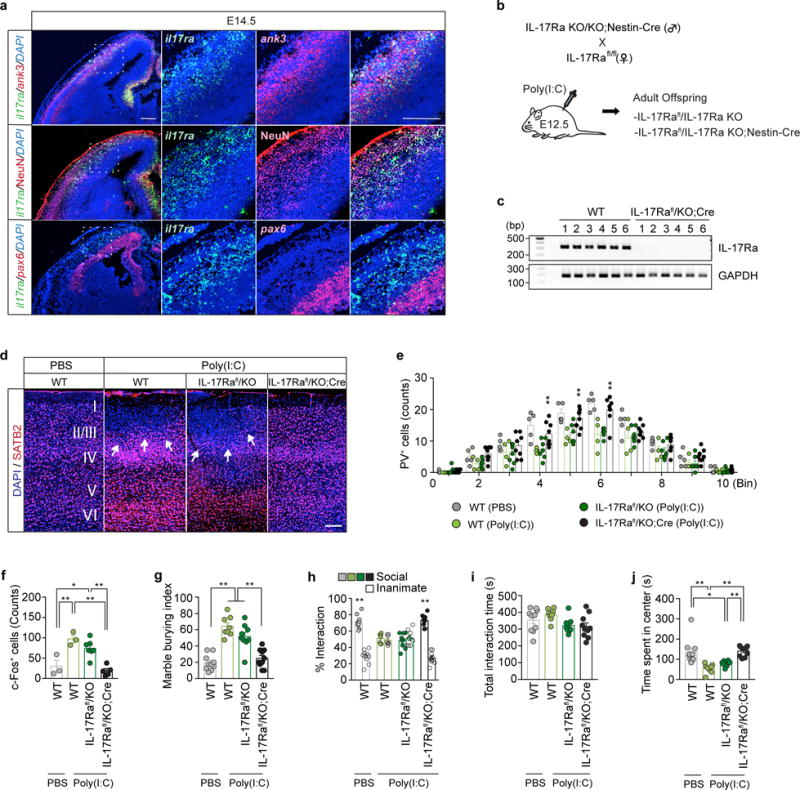
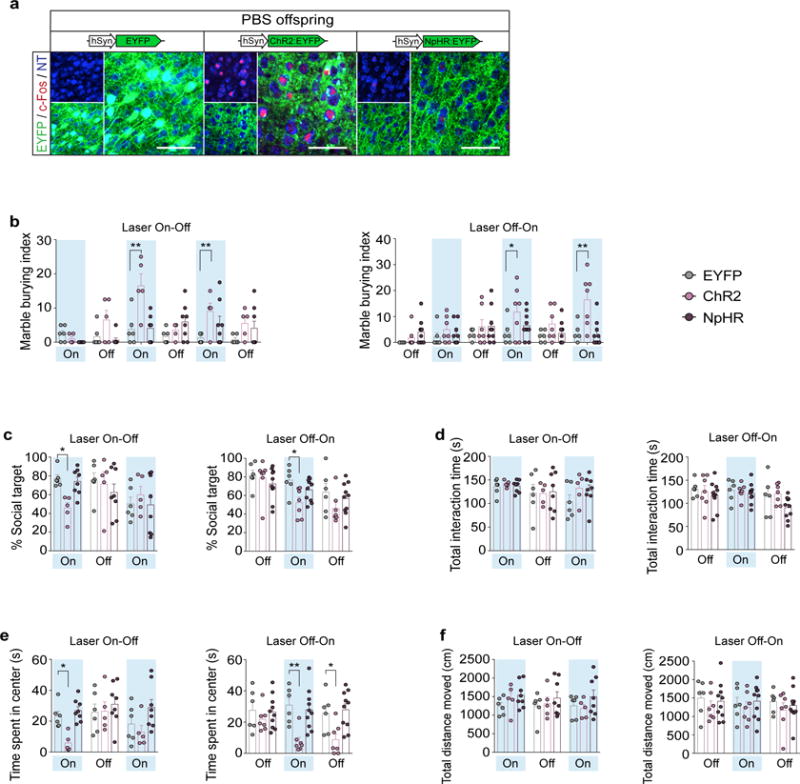
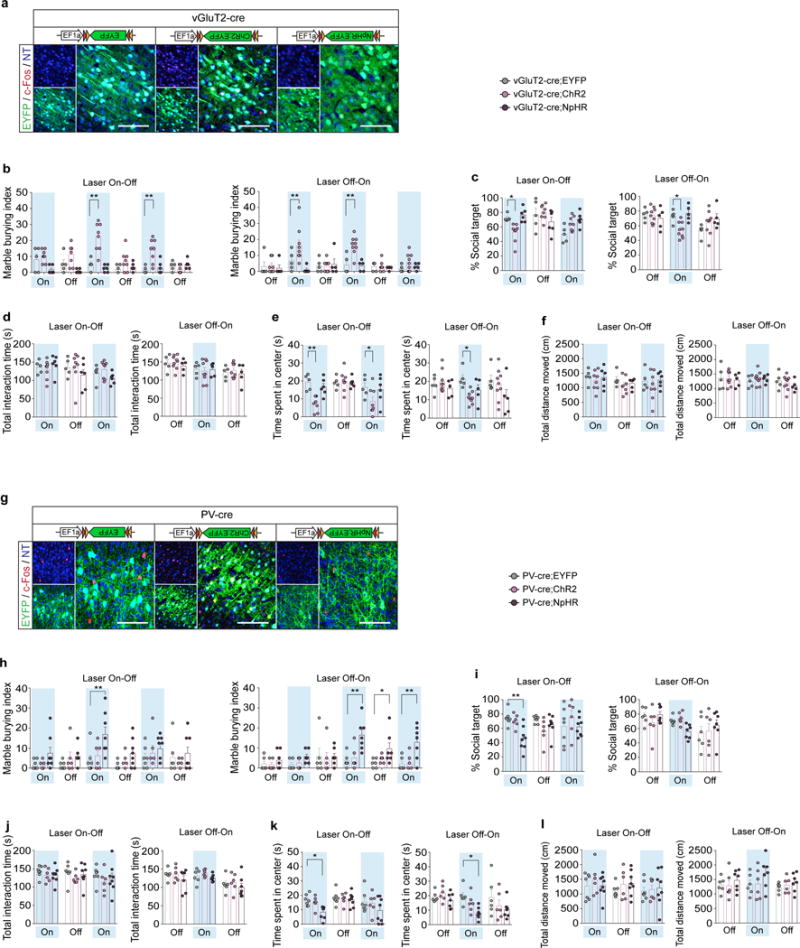
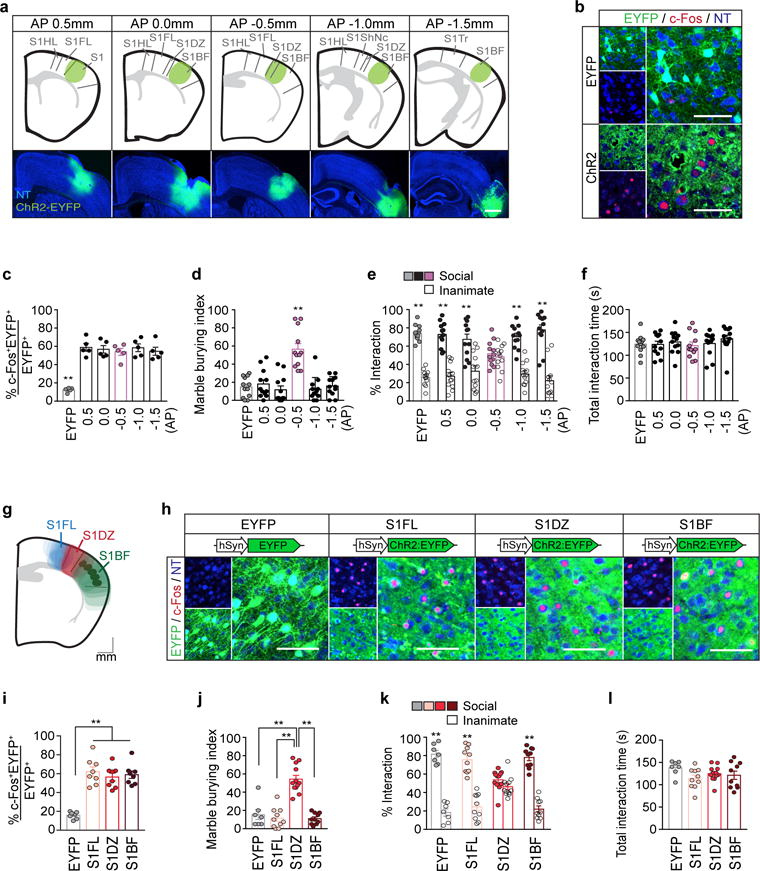
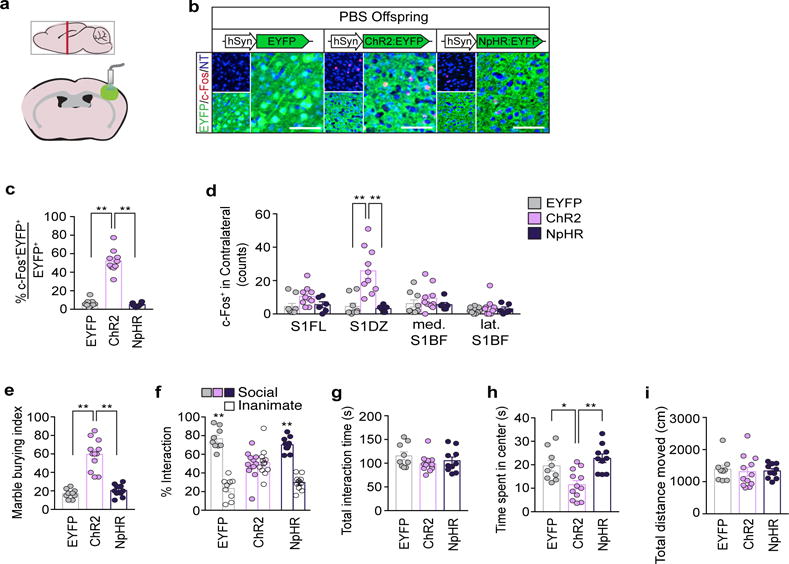
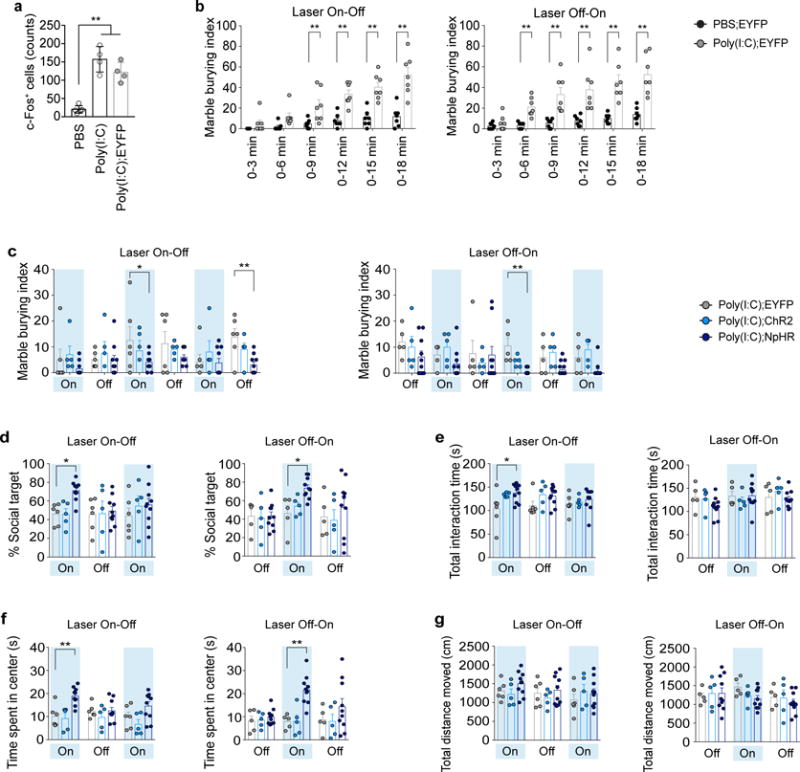
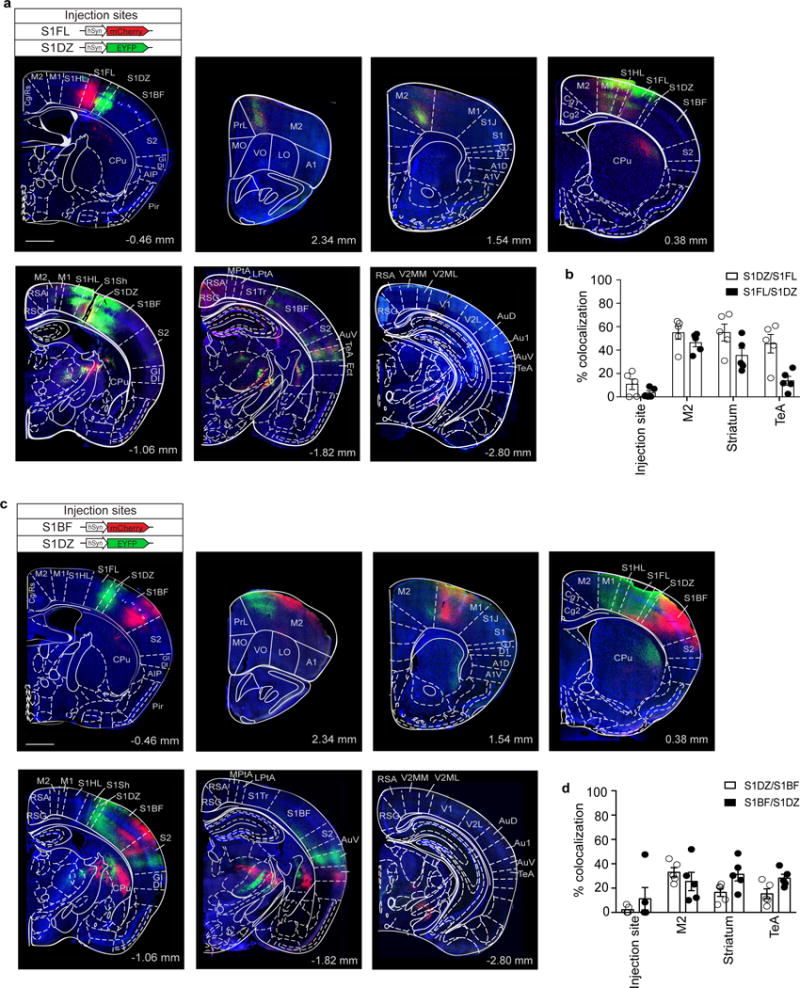
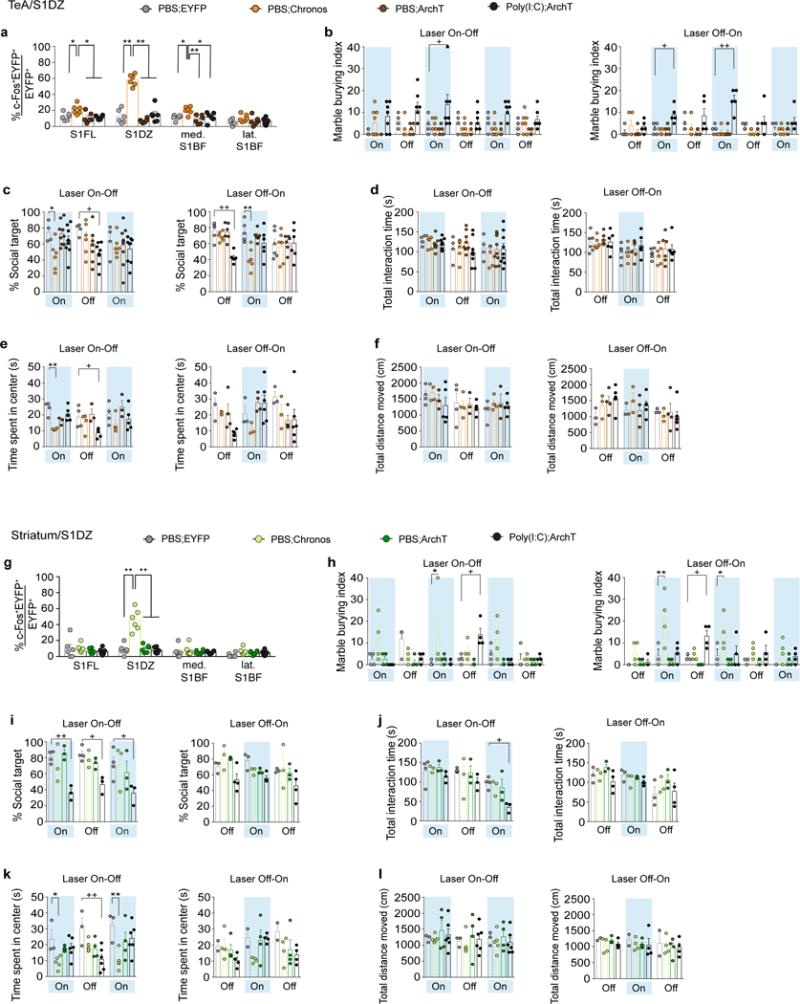
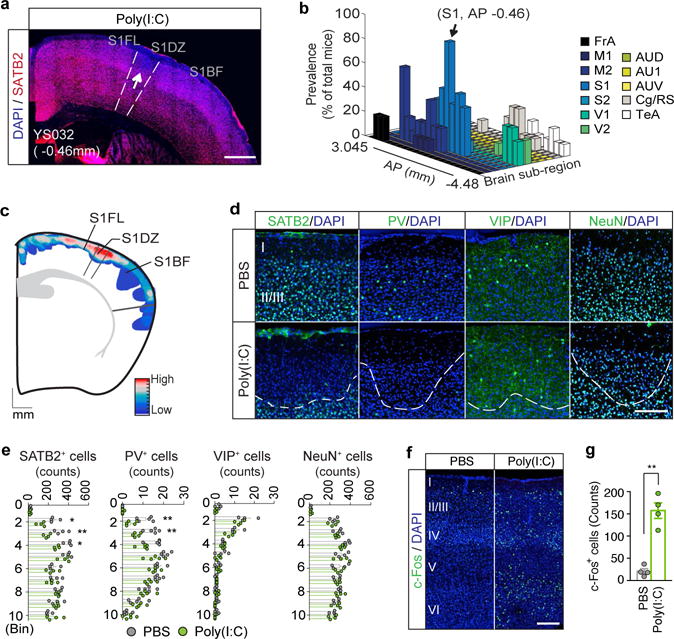
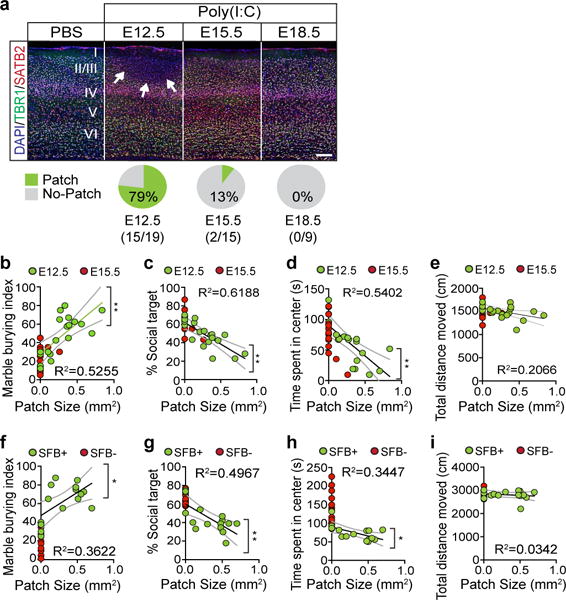
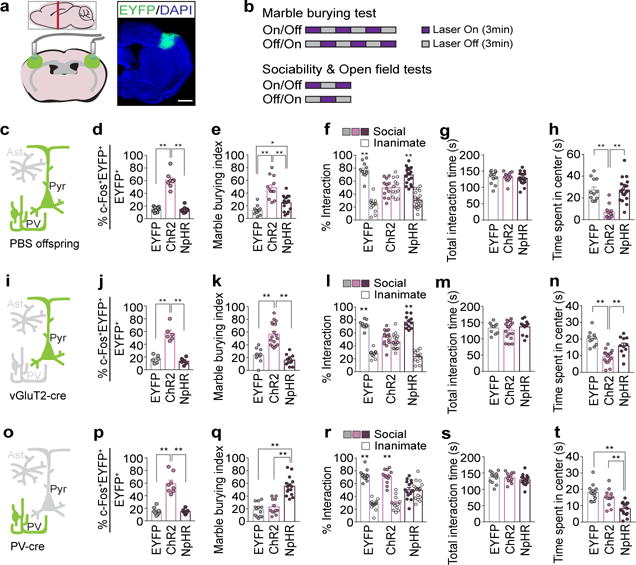
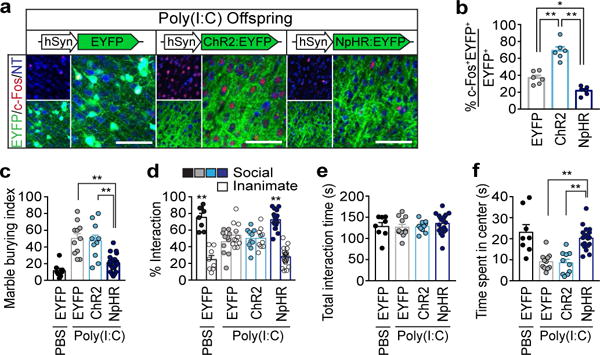
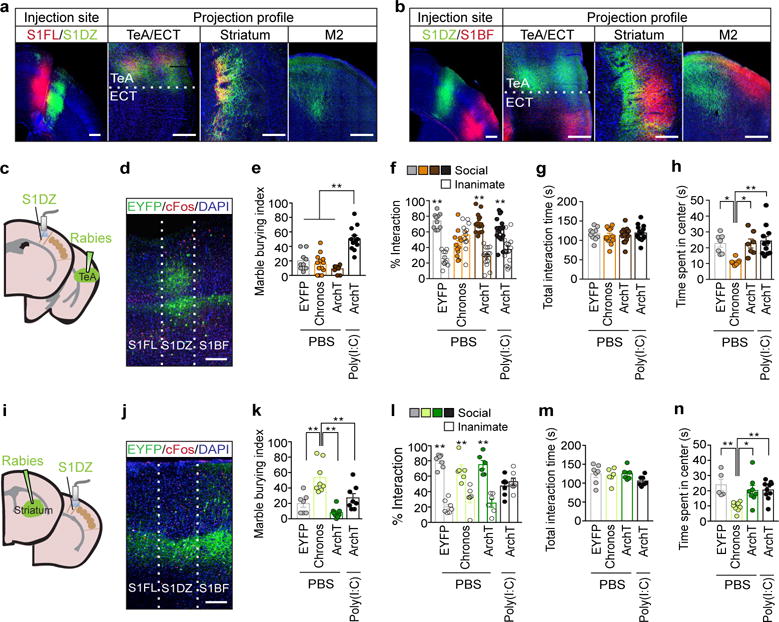
Viral infection during pregnancy is correlated with increased frequency of neurodevelopmental disorders, and this is studied in mice prenatally subjected to maternal immune activation (MIA). We previously showed that maternal T helper 17 cells promote the development of cortical and behavioural abnormalities in MIA-affected offspring. Here we show that cortical abnormalities are preferentially localized to a region encompassing the dysgranular zone of the primary somatosensory cortex (S1DZ). Moreover, activation of pyramidal neurons in this cortical region was sufficient to induce MIA-associated behavioural phenotypes in wild-type animals, whereas reduction in neural activity rescued the behavioural abnormalities in MIA-affected offspring. Sociability and repetitive behavioural phenotypes could be selectively modulated according to the efferent targets of S1DZ. Our work identifies a cortical region primarily, if not exclusively, centred on the S1DZ as the major node of a neural network that mediates behavioural abnormalities observed in offspring exposed to maternal inflammation.


Conflict of interest statement

The authors declare no competing financial interests.

Figures

Extended Data Fig. 1
Extended Data Fig. 1. Distribution of cortical patches in the cortex of MIA offspring
a, The locations of the cortical patches of 10 individual MIA animals were matched to their corresponding AP levels in the Paxinos brain atlas. Different colors represent the patches from different mice. The sub-regions, in which the cortical patches were observed in more than 3 or 5 animals, are circled in blue or red, respectively. The mouse brain in this figure has been reproduced with permission from Paxinos. b, Prevalence of cortical patches in different cortical sub-regions of the MIA offspring described in (a) (n=10-mice/2-independent experiments). c, Prevalence of cortical patches at different AP levels of the brain in the MIA offspring described in (a) (n=10-mice/2-independent experiments). Individual AP levels correspond to those in the schematic images of Extended Data Fig. 1. d, The size and frequencies of cortical patches found in different cortical sub-regions of the MIA offspring described in (a) (n=10-mice/2-independent experiments). PrL: Prelimbic, MO: Medial orbital, DLO: Dorsolateral orbital, DI: Dysgranular insular, FrA: Frontal association cortex, M1: Primary motor cortex, M2: Secondary motor cortex, S1: Primary somatosensory cortex, S2: Secondary somatosensory cortex, V1: Primary visual cortex, V2: Secondary visual cortex, AUD: Secondary auditory cortex, dorsal area, AU1: Primary auditory cortex, AUV: Secondary auditory cortex, ventral area, Cg/RS: Cingulate/Retrosplenial cortex, and TeA: Temporal association cortex. * p<0.05, ** p<0.01 as calculated by Kruskal-Wallis one-way ANOVA with Dunn post-hoc test (d). Graphs indicate mean ± s.e.m.
Extended Data Fig. 2
Extended Data Fig. 2. Distribution of cortical patches located within 0.38 ~ −1.34 AP in the brains of MIA offspring
a, Schematics of the cortical patches located within 0.38~ −1.34 AP in the brains of MIA offspring plotted onto the atlas plane near ~ −0.5 AP. The size of the cortical patches in the schematic is scaled to reflect the actual size as accurately as possible. Blue indicates the cortical patches from one hemisphere and red from the other. The mouse brain in this figure has been reproduced with permission from Paxinos. b, Representative images of the cortical patches in the brains of MIA offspring (a) stained with TBR1 or SATB2 and counterstained with DAPI. The number, locations, and sizes of the cortical patches observed at a given AP level along with each animal’s behavioral performance on the marble burying (marble burying index), sociability (% Social target), and the time spent in the center (s) of an open field are indicated. White arrows indicate cortical patches. Scale bar represents 300μm.
Extended Data Fig. 3
Extended Data Fig. 3. MIA offspring display reduced inhibitory drive onto pyramidal neurons in S1 cortical patches
a, Images cropped in layer I, II, and III of S1 and stained for SATB2 (red) with PV, VIP, or NeuN (green) in offspring from PBS (a) or Poly(I:C) (b) injected dams. Brain slices are counterstained with DAPI (blue). White dotted lines indicate the boundary of cortical patches in MIA offspring. Scale bar represents 100μm. For images shown in Fig. 1d. c. Representative traces of mIPSCs from pyramidal neurons in S1DZ of PBS or MIA offspring. d–e, Average population data depicting the frequency (d) and amplitude (e) of pharmacologically isolated mIPSCs from S1DZ pyramidal neurons described in (c) (n=14-biological independent samples/6-mice/6-independent experiments and 12-biological independent samples/6-mice/6-independent experiments from PBS and MIA offspring, respectively). f, Representative traces of mIPSCs from pyramidal neuron in S1DZ or med. S1BF of MIA offspring. g–h, Average population data depicting the frequency (g) and amplitude (h) of pharmacologically isolated mIPSCs from S1 pyramidal neurons described in (f) (n=7-biological independent samples/3-mice/3-independent experiments and 7-biological independent samples/3-mice/3-independent experiments for S1DZ and med. S1BF from MIA offspring, respectively). i, Representative image of the S1, stained for DAPI (blue) and c-Fos (green) from adult offspring of PBS- or poly(I:C)-treated mother. Arrows indicate the boundaries of different subregions in the S1. Scale bar represents 300μm. S1FL: Primary somatosensory, forelimb, S1DZ: Primary somatosensory, dysgranular zone, S1BF: Primary somatosensory, barrel field. j, Quantification of c-Fos+ cells throughout the S1 (n=4 PBS and 4 Poly(I:C) mice/4-independent experiments). * p<0.05, **p<0.01 as calculated by two-tailed unpaired t-test (d,e,g,h,j). Graphs indicate mean ± s.e.m.
Extended Data Fig. 4
Extended Data Fig. 4. The development of MIA-associated behaviors depends on the time point at which MIA is induced
a–c, Schematics of the marble burying test (a), sociability test (b), and open field test (c). d. Representative spectrographs of the USVs for PBS and E12.5. e, The ultrasonic vocalization (USV) index represents the number of USVs made by the pups (n=20, 24, 21, and 22 mice for PBS, E12.5, E15.5, or E18.5 groups/5-independent experiments). f–g, The sonograms of USVs emitted by the pups are classified into ten distinct categories and analyzed for the number of calls made and the duration of the calls (msec) within the 1st minute of the recording (n=13 and 10 for pups from PBS- and Poly(I:C)-injected mothers, respectively, at E12.5/3-independent experiments). h–n, The marble burying index (the percentage of marbles buried during the 15-min marble burying test) (h), % time spent in social chamber during habituation period of the sociability test (i), % interaction during the sociability test (the percentage of time spent investigating the social or inanimate stimulus out of the total exploration time of both objects during the 10-min sociability test) (j), the total interaction time (the total exploration time of both objects during the 10-min sociability test) (k), the total distance moved during the sociability test (l), the time spent in the center of an open field (m), and the total distance moved during the open field test (n) of the adult offspring described in (e) (n= 12/19/15/9-mice, 7/7/7/5-independent experiments for PBS/E12.5/E15.5/E18.5 groups). o–q, The size of cortical patches found outside of S1 (within AP 0.38~−1.34mm) in offspring from dams injected with poly(I:C) at E12.5 is plotted against the severity of the featured MIA phenotypes on the marble burying test (o), sociability test as % social target (the percentage of time spent investigating the social stimulus out of the total exploration time of both objects) (p), and open field test (q). Black solid lines represent the regression line and gray dotted lines represent 95% confidence intervals (n=19-mice/7-independent experiments) for E12.5 group. * p<0.05, ** p<0.01 as calculated by two-tailed unpaired t-test (f,g), two-way ANOVA with Tukey post-hoc tests (j), one-way ANOVA with Tukey post-hoc tests (e,h,i,k,l,m,n), and Linear regression (o,p,q). Graphs indicate mean ± s.e.m.
Extended Data Fig. 5
Extended Data Fig. 5. IL-17Ra expression is required in the fetal brain to induce behavioral abnormalities upon MIA
a, Representative images of the embryonic cortex at E14.5 stained for il17ra (green) and ank3, NeuN or pax6 (red) in offspring from poly(I:C)-injected dams. Brain slices were counterstained with DAPI (blue). Scale bar represents 200μm. (n=3-mice/2-independent experiments) b, Schematic showing the breeding scheme. Homozygous IL-17Ra KO animals carrying Nestin-Cre transgene were crossed to homozygous IL-17Ra conditional line (IL-17Rafl/fl). c, il17ra and gapdh mRNA expression levels in S1 of WT or IL-17Rafl/KO;Cre mice were measured using conventional RT-PCR. Image indicates mRNA expression levels found in individual animals (n=6-mice/2-independent experiments). d, Representative images of SATB2 (red) expression in S1 of offspring with indicated genotypes (WT, IL-17Rafl/KO, or IL-17Rafl/KO;Cre) from mothers injected with PBS or poly(I:C). Scale bar represents 100μm (n=5, 4, 7, and 8 mice from WT (PBS), WT (Poly(I:C)), IL-17Rafl/KO (Poly(I:C)), and IL-17Rafl/KO;Cre (Poly(I:C))/4-independent experiments). e, Quantification of PV positive cells in regions centered on S1 cortical patches around AP-0.46mm, divided into ten equal bins representing different depths of the cortex, of MIA offspring or in corresponding regions of PBS offspring with indicated genotypes (n=5, 4, 7, and 8 mice from WT (PBS), WT (Poly(I:C)), IL-17Rafl/KO (Poly(I:C)), and IL-17Rafl/KO;Cre (Poly(I:C))/4-independent experiments). f, Quantification of c-Fos+ cells in the S1 at around AP-0.46mm (n=3, 3, 7, and 5 mice, from WT (PBS), WT (Poly(I:C)), IL-17Rafl/KO (Poly(I:C)), and IL-17Rafl/KO;Cre (Poly(I:C))/4-independnt experiments). g–j, The marble burying index (g), the % interaction (h) and the total interaction time (i) during the sociability test, and the time spent in the center of an open field (j) of the adult offspring described in (b) (n= 10, 8, 9, and 10 mice for WT (PBS), WT (Poly(I:C)), IL-17Rafl/KO (Poly(I:C)), and IL-17Rafl/KO;Cre (Poly(I:C)) groups/5-independent experiments). * p<0.05, ** p<0.01 as calculated by two-way repeated measures ANOVA with Tukey post-hoc tests for statistical comparison between the WT (Poly(I:C)) and IL-17Rafl/KO;Cre (Poly(I:C)) (e), one-way ANOVA with Tukey post-hoc tests (f,g,i,j), and two-way ANOVA with Tukey post-hoc tests (h). Graphs indicate mean ± s.e.m.
Extended Data Fig. 6
Extended Data Fig. 6. Increasing neural activity in WT animals induces MIA behavioral phenotypes
a, Representative images of c-Fos expression upon photostimulation of the S1DZ in WT offsprings from mothers injected with PBS at E12.5 (PBS offspring). In these animals, AAV2-EF1α-DIO-EYFP, ChR2-EYFP, or NpHR-EYFP viruses were targeted to the S1DZ. Coronal sections of the brains were stained for c-Fos (red) and EYFP (green), and counterstained with neurotrace (NT, blue). Scale bar represents 100um. b–f, The marble burying index (the percentage of marbles buried during the 18-min marble burying test) (b), the % social target (the percentage of time spent investigating the social stimulus out of the total exploration time of both objects) (c), the total interaction time during the sociability test (d), the time spent in the center of an open field (e), and the total distance moved during the open field test (f) are plotted as averages from each individual 3-min sessions. Light blue indicates the laser ‘On’ sessions (‘Laser On-Off’: n=6, 5, and 8 mice/4-independent experiments; ‘Laser Off-On’: n=6, 7, and 10 mice/4-independent experiments from the AAV2-hSyn-EYFP, ChR2-EYFP, or NpHR-EYFP injected PBS offspring). * p<0.05, ** p<0.01 as calculated by two-way repeated measures ANOVA with Tukey post-hoc tests. Graphs indicate mean ± s.e.m.
Extended Data Fig. 7
Extended Data Fig. 7. Increasing neural activity in vGluT2-positive neurons or decreasing neural activity in PV-positive neurons of WT animals creates MIA behavioral phenotypes
a,g, Representative images of c-Fos expression upon photostimulation of the S1DZ in vGluT2-Cre (a) or PV-Cre (g) animals injected with AAV2-EF1α-DIO-EYFP, ChR2-EYFP, or NpHR-EYFP viruses. Coronal sections of the brains were stained for c-Fos (red) and EYFP (green), and counterstained with neurotrace (NT, blue). Scale bar represents 100um. b–l, The marble burying index, the % social target, the total interaction time during the sociability test, the time spent in the center of an open field, and the total distance moved during the open field test with vGluT2-cre (b–f) and PV-cre (h–l) animals are plotted as averages from each individual 3-min sessions. Light blue indicates the laser ‘On’ sessions (‘Laser On-Off’: n=5, 8, and 6 mice, 4-independent experiments; ‘Laser Off-On’: n=5, 9, and 5 mice, 5-independent experiments for vGluT2-Cre animals injected with AAV2-EF1α-DIO-EYFP, ChR2-EYFP, or NpHR-EYFP; ‘Laser On-Off’: n=7, 6, and 8 mice, 6-independent experiments; ‘Laser Off-On’: n=6, 6, and 7 mice, 5-independent experiments for PV-Cre animals injected with AAV2-EF1α-DIO-EYFP, ChR2-EYFP, or NpHR-EYFP). * p<0.05, ** p<0.01 as calculated by two-way repeated measures ANOVA with Tukey post-hoc tests. Graphs indicate mean ± s.e.m.
Extended Data Fig. 8
Extended Data Fig. 8. The ability to create MIA behavioral phenotypes by increasing neural activity in WT animals is specific with respect to the AP level and the sub-region of the primary somatosensory cortex
a, Schematics (top) and representative images (bottom) of the five sites in the S1 of WT animals injected with either AAV2-hSyn-EYFP or AAV2-hSyn-ChR2-EYFP virus (green) (AP= +0.5, +0.0, −0.5, −1.0, or −1.5mm). The mouse brain in this figure has been reproduced with permission from Paxinos. Scale bar represents 300μm. b, Representative images of c-Fos expression upon photostimulation of the injection sites in animals as prepared in (a). Coronal sections of the brains were stained for c-Fos (red) and EYFP (green), and counterstained with neurotrace (NT, blue). Scale bar represents 100μm. c, The percentage of EYFP+ neurons expressing c-Fos upon photostimulation of the injection site (n=5 for WT animals injected with AAV2-hSyn-EYFP at AP=−0.5mm and n=5, 5, 5, 5, and 5 for animals injected with AAV2-hSyn-ChR2-EYFP at AP=0.5, 0.0, −0.5, −1.0, or −1.5mm, 3-independent experiments, respectively). d–f, The marble burying index (d), the % interaction (during the 1st laser-on session) of the sociability test (e), and the total interaction time (during the 1st laser-on session) of the sociability test (f) for animals prepared as in (a) (n=12 for WT animals injected with AAV2-hSyn-EYFP at AP=−0.5mm and n=12, 12, 12, 12, and 12 for those injected with AAV2-hSyn-ChR2-EYFP at AP=0.5, 0.0, −0.5, −1.0, or −1.5mm, 6-independent experiments, respectively). g, A schematic showing the superimposed virus injection sites from individual WT animals, in which AAV2-hSyn-ChR2-EYFP was delivered into the S1FL (blue), S1DZ (red), or S1BF (green). The mouse brain in this figure has been reproduced with permission from Paxinos. h, Representative images of c-Fos expression upon photostimulation of the injection sites shown in (g). Coronal sections of the brains were stained for c-Fos (red) and EYFP (green), and counterstained with neurotrace (NT, blue). Scale bar represents 100μm. i, The percentage of EYFP+ neurons co-expressing c-Fos upon photostimulation of the injection site (n=7 mice for EYFP and 8 mice for S1FL, S1DZ, and S1BF; 3-independent experiments). j–l, The marble burying index (j), the % interaction (during the 1st laser-on session) of the sociability test (k), and the total interaction time (during the 1st laser-on session) of the sociability test (l) for animals prepared as in (g) (n=7 for WT animals injected with AAV2-hSyn-EYFP into S1DZ and n=10, 12, and 10 for WT animals injected with AAV2-hSyn-ChR2-EYFP into S1FL, S1DZ, or S1BF; 3-independent experiments). S1HL: Primary somatosensory, hindlimb, S1FL: Primary somatosensory, forelimb, S1: Primary somatosensory cortex, S1DZ: Primary somatosensory, dysgranular zone, S1BF: Primary somatosensory, barrel field, S1ShNc: Primary somatosensory, shoulder and neck, S1Tr: Primary somatosensory, trunk. * p<0.05, ** p<0.01 as calculated by two-way ANOVA with Tukey post-hoc tests (e,k) and one-way ANOVA with Tukey post-hoc tests (c,d,f,i,j,l). Graphs indicate mean ± s.e.m.
Extended Data Fig. 9
Extended Data Fig. 9. Unilateral increase in neural activity of the S1DZ region creates MIA behaviors in WT animals
a, Schematic showing the unilateral virus injection and optic-fiber implantation in the S1DZ of WT animals injected with AAV2-hSyn-EFYP, ChR2-EYFP, or NpHR-EFYP. The mouse brain in this figure has been reproduced with permission from Paxinos. b, Representative images of c-Fos expression upon photostimulation of the injection sites shown in (a). Coronal sections of the brains were stained for c-Fos (red) and EYFP (green), and counterstained with DAPI (blue). Scale bar represents 100μm. c, The percentage of EYFP+ neurons co-expressing c-Fos upon photostimulation of the injection site (n=9, 10, and 6 mice for WT animals injected with AAV2-hSyn-EYFP, ChR2-EYFP, or NpHR-EYFP into S1DZ; 3-independent experiments). d, The number of c-Fos+ cells in the contralateral hemisphere of the injection site for the animals described in (c). e–h, The marble burying index (e), the % interaction (during the 1st laser-on session) of the sociability test (f), the total interaction time (during the 1st laser-on session) of the sociability test (g), the time spent in the center of an open field (during the 1st laser-on session) (h), and the total distance moved during the open field test (during the 1st laser-on session) (i) of animals prepared as in (a) (n=9, 12, and 10 for WT animals injected with AAV2-hSyn-EYFP, ChR2-EYFP, or NpHR-EYFP into S1DZ; 3-independent experiments). * p<0.05, ** p<0.01 as calculated by two-way ANOVA with Tukey post-hoc tests (f) and one-way ANOVA with Tukey post-hoc tests (c,d,e,g,h,i). Graphs indicate mean ± s.e.m.
Extended Data Fig. 10
Extended Data Fig. 10. Reducing neural activity in the cortical region centered on the S1DZ corrects the behavioral abnormalities of MIA offspring
a, Quantification of c-Fos+ cells in the S1DZ of adult offspring from mothers injected with PBS or Poly(I:C), and of adult Poly(I:C) offspring, in which AAV2-hSyn-EYFP was injected into the S1DZ (n=5, 4, and 4 mice for PBS, Poly(I:C), and Poly(I:C);EYFP groups, respectively; 3-independent experiments). b, AAV2-hSyn-EYFP was targeted into the S1DZ of adult offspring from either PBS or Poly(I:C) treated mothers. The accumulation of marble burying index over their behavioral session is plotted based on the laser schemes (‘Laser On-Off’: n=7 and 7; ‘Laser Off-On’: n=7 and7 for AAV2-hSyn-EYFP injected PBS and Poly(I:C) offspring; 3-independent experiments, respectively). c–g, AAV2-hSyn-EYFP, ChR2-EYFP, or NpHR-EYFP viruses were targeted to the S1DZ of MIA offspring (poly(I:C)). The marble burying index (c), the % social target (d) and the total interaction time (e) of the sociability test, the time spent in the center of an open field (f), and the total distance moved during the open field test (g) are plotted as averages from each individual 3-min sessions. Light blue indicates the laser ‘On’ sessions (‘Laser On-Off’: n=6, 5, and 10; ‘Laser Off-On’: n=5, 5, and10 for AAV2-hSyn-EYFP, ChR2-EYFP, or NpHR-EYFP injected MIA offspring; 5-independent experiments). * p<0.05, ** p<0.01 as calculated by one-way ANOVA with Tukey post-hoc tests (a) and two-way repeated measures ANOVA with Tukey post-hoc tests (b,c,d,e,f,g). Graphs indicate mean ± s.e.m.
Extended Data Fig. 11
Extended Data Fig. 11. The S1FL, S1DZ, and S1BF exhibit distinct efferent targets
a,c, AAV2-hSyn-mCherry and AAV2-hSyn-EYFP were injected into the S1FL and S1DZ (a) or S1BF and S1DZ (c), respectively. The two cortical regions project to distinct sub-regions of the M2, the striatum, and the associative cortices. Representative images are aligned to their corresponding AP levels in the Paxinos brain atlas (n=5). Scale bar represents 1mm. b,d, Quantification of percentage of co-localized projection fibers, represented as % co-localization, from S1FL with those from S1DZ within the regions of interest (ROI; n= 5) (b) and from S1BF with those from S1DZ within the regions of interest (ROI;n=5) (d). S1DZ/S1FL (S1DZ/S1BF) reflects the percentage S1FL (S1BF) projection fibers within the ROI co-localized with those from S1DZ, while S1FL/S1DZ (S1BF/S1DZ) reflects vice versa. The mouse brain in this figure has been reproduced with permission from Paxinos. Graph indicates mean ± s.e.m.
Extended Data Fig. 12
Extended Data Fig. 12. Distinct populations of S1DZ neurons projecting to TeA or Striatum selectively modulate marble burying and sociability phenotypes
a, Percentage of EYFP/c-Fos co-expressing neurons upon stimulation of animals described in Fig. 5c (n=6/6/6/6-mice, 3-independent experiments (PBS;RV-EYFP/Chronos/ArchT, MIA;RV-ArchT)). b–f, Performance on the marble burying test (b) (‘Laser On-Off’: n=4/8/5/7-mice for PBS;EYFP/PBS;Chronos/PBS;ArchT/MIA;ArchT, 4/7/5/7-independent experiments and ‘Laser Off-On’: n=5/5/5/5-mice for PBS;EYFP/PBS;Chronos/PBS;ArchT/MIA;ArchT, 5/5/5/5-independent experiments), the % social target (c) and the total interaction time during the sociability test (d) (‘Laser On-Off’: n=4/6/9/9-mice for PBS;EYFP/PBS;Chronos/PBS;ArchT/MIA;ArchT, 4/5/7/7-independent experiments and ‘Laser Off-On’: n=6/6/6/6-mice for PBS;EYFP/PBS;Chronos/PBS;ArchT/MIA;ArchT, 5/5/5/5-independent experiments), and the time spent in center (e) and the total distance moved during the open field test (f) (‘Laser On-Off’: n=4/4/3/5-mice for PBS;EYFP/PBS;Chronos/PBS;ArchT/MIA;ArchT, 4/4/3/5-independent experiments and ‘Laser Off-On’: n=3/3/4/6-mice for PBS;EYFP/PBS;Chronos/PBS;ArchT/MIA;ArchT, 3/3/4/5-independent experiments). g, Percentage of EYFP/c-Fos co-expressing neurons upon stimulation of animals described in Fig. 5i (n=6/6/6/6-mice, 3-independent experiments (PBS;RV-EYFP/Chronos/ArchT, MIA;RV-ArchT)). h–l, Performance on the marble burying test (h) (‘Laser On-Off’: n=4/4/4/4-mice for PBS;EYFP/PBS;Chronos/PBS;ArchT/MIA;ArchT, 4-independent experiments and ‘Laser Off-On’: n=3/4/4/4-mice for PBS;EYFP/PBS;Chronos/PBS;ArchT/MIA;ArchT, 3-independent experiments), the % social target (i) and the total interaction time during the sociability test (j) (‘Laser On-Off’: n=4/3/3/3-mice for PBS;EYFP/PBS;Chronos/PBS;ArchT/MIA;ArchT, 3-independent experiments and ‘Laser Off-On’: n=3/3/3/4-mice for PBS;EYFP/PBS;Chronos/PBS;ArchT/MIA;ArchT, 3-independent experiments), and the time spent in center (k) and the total distance moved during the open field test (l) (‘Laser On-Off’: n=3/5/4/6-mice for PBS;EYFP/PBS;Chronos/PBS;ArchT/MIA;ArchT, 3/5/4/5-independent experiments and ‘Laser Off-On’: n=2/4/4/4-mice for PBS;EYFP/PBS;Chronos/PBS;ArchT/MIA;ArchT, 2/4/4/4-independent experiments).
Figure 1
Figure 1. Cortical patches observed in offspring of dams following MIA
a, Representative S1 image of adult MIA offspring. Arrow indicates cortical patch. Scale bar, 500μm. b, Prevalence of cortical patches (n=10-mice/2-independent experiments) in MIA offspring. c, Superimposed image of cortical patches within AP 0.38–1.34mm (n=50-mice/12-independent experiments). The mouse brain in this figure has been reproduced with permission from Paxinos. Scale indicates frequencies of patches (high=red; low=blue). d, Representative images of S1. White dotted-lines indicate boundary of cortical patches. Scale bar, 100μm. e, Quantification of SATB2+/PV+/VIP+/NeuN+ cells in S1cortical patches (n=4/4-mice (PBS/Poly(I:C)), 3-independent experiments for SATB2/VIP/NeuN; n=5/5-mice (PBS/Poly(I:C)), 3-independent experiments for PV). f, Representative images of c-Fos expression in S1. Scale bar, 100μm. g, Quantification of c-Fos expression in S1 (n=4/4-mice (PBS/Poly(I:C)); 3-independent experiments). *p<0.05,**p<0.01 as calculated by two-way repeated measures ANOVA with Tukey (e) and two tailed unpaired t-test (g). Graphs indicate mean±s.e.m.
Figure 2
Figure 2. The presence and size of cortical patches are predictive of MIA-induced behaviors and their severity in offspring
a, Top: Representative S1 images of adult offspring from PBS- (E12.5;n=12-mice/7-independent experiments) and poly(I:C)-injected dams (E12.5/E15.5/E18.5; n=19/15/9-mice, 7/7/5-independent experiments). Bottom: Percentage of offspring with cortical patches in S1. Arrows indicate cortical patch. Scale bar, 100μm. bi, Cortical patch size plotted against behavioral severity on marble burying (b,f), sociability (c,g), and open field tests (d,h), and total distance moved during sociability (e,i) for offspring exposed to MIA at E12.5/E15.5 (be) (n=19/15-mice, 7-independent experiments) or offspring from SFB+ Taconic-dam/SFB Jackson-dam (f-i) (n=16/14-mice, 2-independent experiments). Green solid lines represent regression line; gray dotted lines indicate 95% confidence intervals for E12.5 (be) or SFB+ (fi) groups. *p<0.05,**p<0.01 as calculated by Linear regression (bi).
Figure 3
Figure 3. Increasing neural activity in the S1DZ region induces MIA behavioral phenotypes in WT mice
a, Schematics (left) and representative image (right) of EYFP-expressing virus injection site in the S1DZ-centered cortical region. The mouse brain in this figure has been reproduced with permission from Paxinos. Scale bar, 1mm. b, Optical stimulation protocol. Laser was given in a counterbalanced manner. c,i,o, Schematic of labeled cells (green) in PBS offspring (c), vGluT2-Cre (i), or PV-cre mice (o) (Pyr:Pyramidal neuron, PV:Parvalbumin-positive neuron, Ast:Astrocyte). d,j,p, Percentage of EYFP+ neurons co-expressing c-Fos upon photostimulation (n=8/8/8-mice, 4-independent experiments (PBS offspring;AAV2-hSyn-EYFP/ChR2/NpHR); n=6/6/6-mice, 3-independent experiments (vGluT2-Cre;AAV2-EF1a-DIO-EYFP/ChR2/NpHR); n=8/8/8-mice, 4-independent experiments (PV-cre;AAV2-EF1a-DIO-EYFP/ChR2/NpHR)). e-h,k-n,q-t, Marble burying index (18-min) (e,k,q), % interaction (f,l,r) and total interaction time (g,m,s) during 1st laser-on session of the sociability test, and time spent in center during 1st laser-on session of the open field test (h,n,t) (n=12/12/18-mice, 5-independent experiments (PBS offspring;AAV2-hSyn-EYFP/ChR2/NpHR); n=10/17/11-mice, 5-independent experiments (vGluT2-Cre;AAV2-EF1a-DIO-EYFP/ChR2/NpHR); n=13/12/15-mice, 6-independent experiments (PV-cre;AAV2-EF1a-DIO-EYFP/ChR2/NpHR)). *p<0.05,**p<0.01 as calculated by two-way ANOVA (f,l,r) and one-way ANOVA (d,e,g,h,j,k,m,n,p,q,s,t) with Tukey post-hoc tests. Graphs indicate mean±s.e.m.
Figure 4
Figure 4. Reducing neural activity in the S1DZ region corrects behavioral abnormalities in MIA offspring
a, Representative images of c-Fos expression upon photostimulation of the S1DZ region in MIA offspring. Scale bar, 100μm. b, Percentage of EYFP/c-Fos co-expressing neurons upon stimulation (n=6/6/6-mice; 3-independent experiments (MIA;AAV2-hSyn-EYFP/ChR2/NpHR)). cf, Performance on marble burying test (c), % interaction (d) and total interaction time (e) during the sociability test, and time spent in center during the open field assay (f) (n=8/11/10/20-mice; 5/5/5/7-independent experiments (PBS;AAV2-hSyn-EYFP/MIA;AAV2-hSyn-EYFP/ChR2/NpHR)). *p<0.05,**p<0.01 as calculated by two-way ANOVA (d) and one-way ANOVA (b,c,e,f) with Tukey post-hoc tests. Graphs indicate mean±s.e.m.
Figure 5
Figure 5. Distinct populations of S1DZ neurons selectively modulate marble burying and sociability phenotypes
a–b, Anterograde-tracing using AAV2-hSyn-mCherry (S1FL/S1BF) and AAV2-hSyn-EYFP (S1DZ) (n=5-mice/4-independent experiments). c,i, Schematics of optic fiber implantation (S1DZ) and virus injection sites in TeA (c) or dorsolateral striatum (i). The mouse brain in this figure has been reproduced with permission from Paxinos. d,j, Representative image of EYFP/c-Fos/DAPI expression in S1DZ after photostimulation (3-independent experiments). Scale bar, 300μm. e-h,k-n, Performance on the marble burying test (e,k) (TeA:n=9/13/10/12-mice; 7-independent experiments, striatum: n=7/8/8/8-mice; 5-independent experiments (PBS;RV-EYFP/Chronos/ArchT, MIA;RV-ArchT)), % interaction (f,l) and total interaction time (g,m) during the sociability test (TeA:n=10/12/15/15-mice; 7-independent experiments, striatum:n=7/6/6/7-mice; 5-independent experiments (PBS;RV-EYFP/Chronos/ArchT, MIA;RV-ArchT)), and the open field test (h,n) (TeA:n=7/7/7/11-mice;7-independent experiments, striatum:n=5/9/8/10-mice;5-independent experiments (PBS;RV-EYFP/Chronos/ArchT, MIA;RV-ArchT)). *p<0.05,**p<0.01 as calculated by two-way ANOVA (f,l) and one-way ANOVA (e,g,h,k,m,n) with Tukey post-hoc tests. Graphs indicate mean±s.e.m.

Comment in

References

    1. Atladóttir HO, et al. Maternal infection requiring hospitalization during pregnancy and autism spectrum disorders. J Autism Dev Disord. 2010;40:1423–1430. - PubMed
    1. Patterson PH. Immune involvement in schizophrenia and autism:etiology, pathology and animal models. Behav Brain Res. 2009;7:313–321. - PubMed
    1. Brown AS, et al. Elevated maternal C-reactive protein and autism in a national birth cohort. Mol Psychiatry. 2014;19:259–264. - PMC - PubMed
    1. Atladóttir HO, et al. Association of family history of autoimmune diseases and autism spectrum disorders. Pediatrics. 2009;124:687–694. - PubMed
    1. Ashwood P, Wills S, Van de Water J. The immune response in autism: a new frontier for autism research. J Lekoc Biol. 2006;80:1–15. - PubMed

Publication types

MeSH terms