

Simultaneous trimodal PET-MR-EEG imaging: Do EEG caps generate artefacts in PET images?
- PMID: 28902890
- PMCID: PMC5597218
- DOI: 10.1371/journal.pone.0184743
Simultaneous trimodal PET-MR-EEG imaging: Do EEG caps generate artefacts in PET images?
Abstract
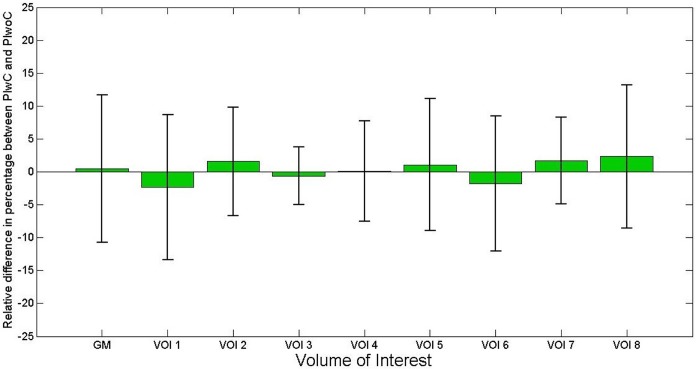
Trimodal simultaneous acquisition of positron emission tomography (PET), magnetic resonance imaging (MRI), and electroencephalography (EEG) has become feasible due to the development of hybrid PET-MR scanners. To capture the temporal dynamics of neuronal activation on a millisecond-by-millisecond basis, an EEG system is appended to the quantitative high resolution PET-MR imaging modality already established in our institute. One of the major difficulties associated with the development of simultaneous trimodal acquisition is that the components traditionally used in each modality can cause interferences in its counterpart. The mutual interferences of MRI components and PET components on PET and MR images, and the influence of EEG electrodes on functional MRI images have been studied and reported on. Building on this, this study aims to investigate the influence of the EEG cap on the quality and quantification of PET images acquired during simultaneous PET-MR measurements. A preliminary transmission scan study on the ECAT HR+ scanner, using an Iida phantom, showed visible attenuation effect due to the EEG cap. The BrainPET-MR emission images of the Iida phantom with [18F]Fluordeoxyglucose, as well as of human subjects with the EEG cap, did not show significant effects of the EEG cap, even though the applied attenuation correction did not take into account the attenuation of the EEG cap itself.
Conflict of interest statement
Figures


References
-
- Shah NJ, Oros-Peusquens A-MM, Arrubla J, Zhang K, Warbrick T, Mauler J, et al. Advances in multimodal neuroimaging: Hybrid MR-PET and MR-PET-EEG at 3 T and 9.4 T. J Magn Reson. 2013;229: 101–15. doi: 10.1016/j.jmr.2012.11.027 - DOI - PubMed
-
- Neuner I, Mauler J, Arrubla J, Rota Kops E, Tellmann L, Scheins J, et al. Simultaneous trimodal MR-PET-EEG imaging for the investigation of resting state networks in humans. EJNMMI Physics. 2015;2: A71 doi: 10.1186/2197-7364-2-S1-A71 - DOI - PMC - PubMed
-
- Neuner I, Wyss C, Rajkumar R, Mauler J, Boers F, Tellmann L, et al. Simultaneous trimodal imaging approach using [11C]—Flumazenil for MR-PET-EEG: feasibility of set-up. PSMR 2016—5th Conference on PET/MR and SPECT/MR; 2016 May 23–25; Cologne, Germany.
-
- Wielaard J, Hammers A, Stirling J, Mackewn J, Mcginnity CJ, Schleyer P, et al. Simultaneous EEG-PET-fMRI/ASL recordings during a simulated seizure. International Conference on Basic and Clinical Multimodal Imaging, 2015, Sep 01–05; Utrecht, Netherlands.
-
- Polikar R, Tilley C, Hillis B, Clark CM. Multimodal EEG, MRI and PET data fusion for Alzheimer’s disease diagnosis. 32nd Annual International Conference of the IEEE Engineering in Medicine and Biology Society, 2010 Aug 31–Sep 4, Buenos Aires. 2010; 6058–6061. 10.1109/IEMBS.2010.5627621 - PubMed
Publication types
MeSH terms
LinkOut - more resources
Full Text Sources
Other Literature Sources
Miscellaneous
