. 2017 Nov;65(11):655-667.
doi: 10.1369/0022155417730280. Epub 2017 Sep 13.

Spatiotemporally Non-Uniform Ca2+ Dynamics of Cardiac Purkinje Fibers in Mouse Myocardial Infarct

Affiliations

Spatiotemporally Non-Uniform Ca2+ Dynamics of Cardiac Purkinje Fibers in Mouse Myocardial Infarct

Taka-Aki Matsuyama et al. J Histochem Cytochem. 2017 Nov.

Abstract

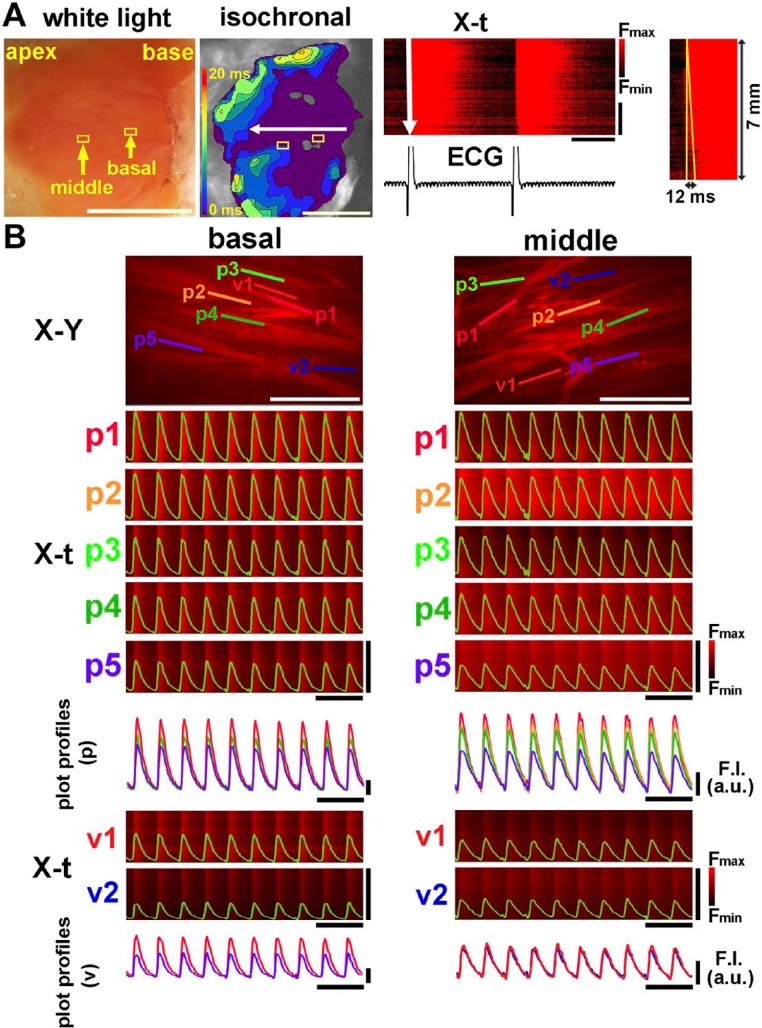
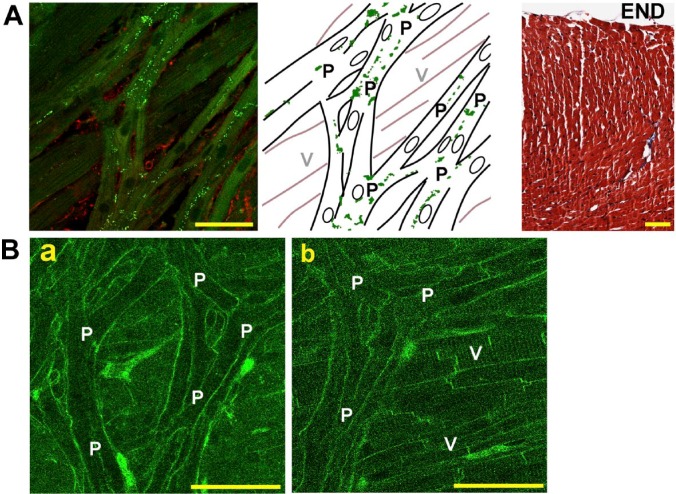
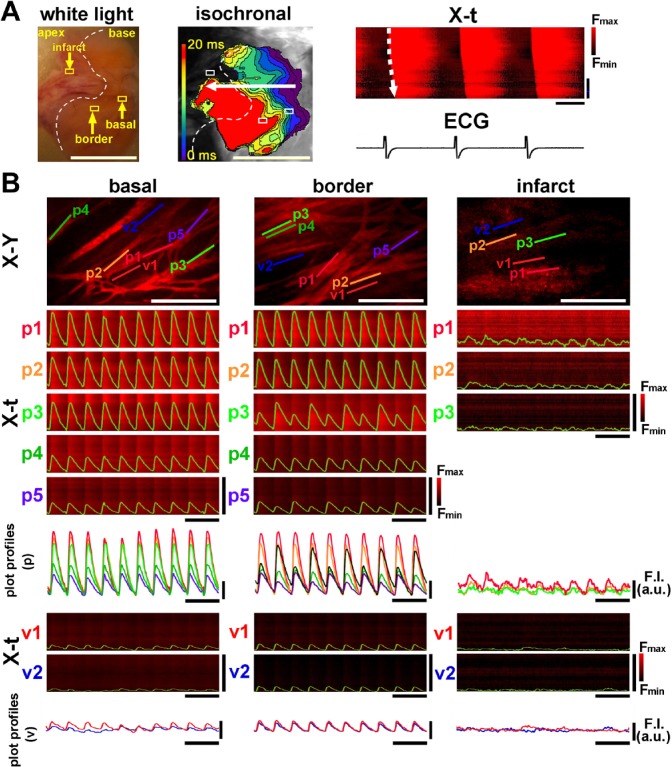
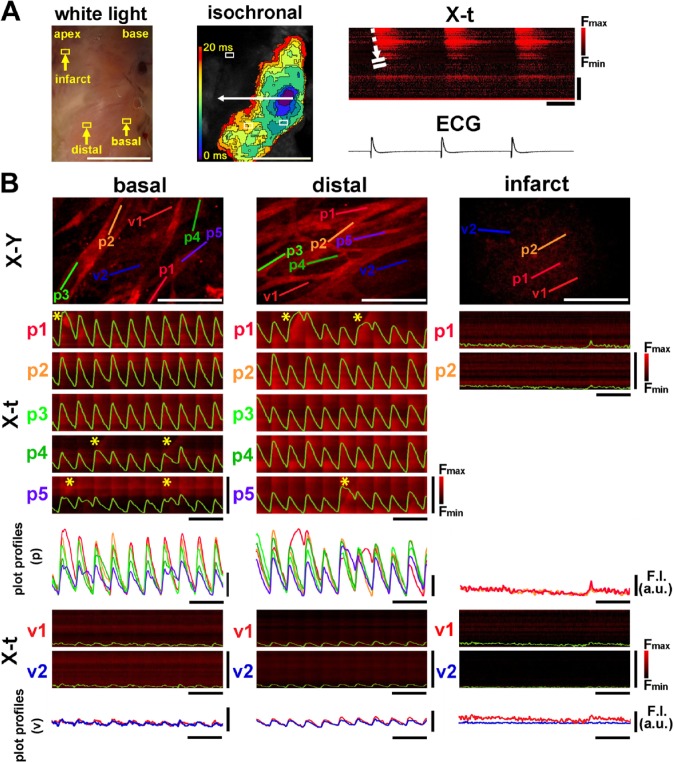
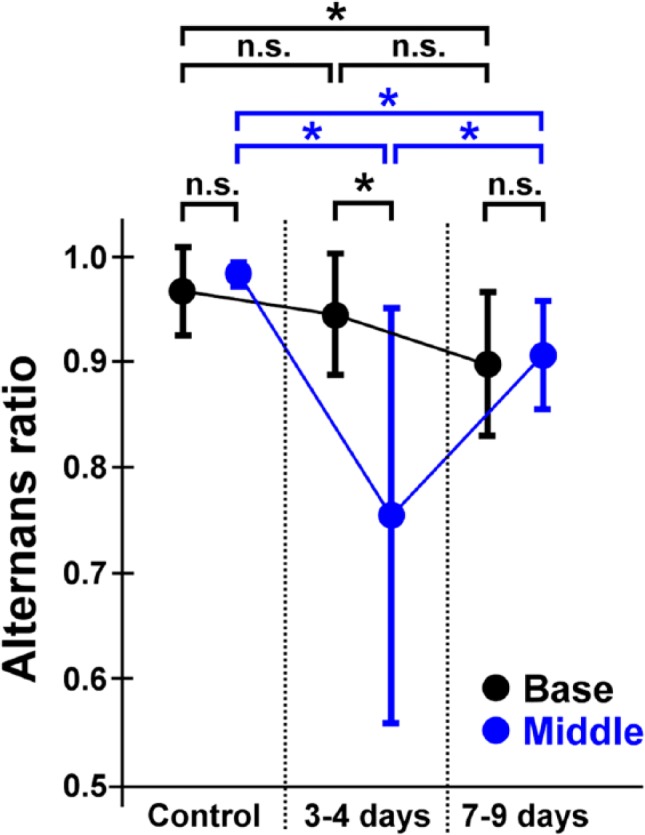
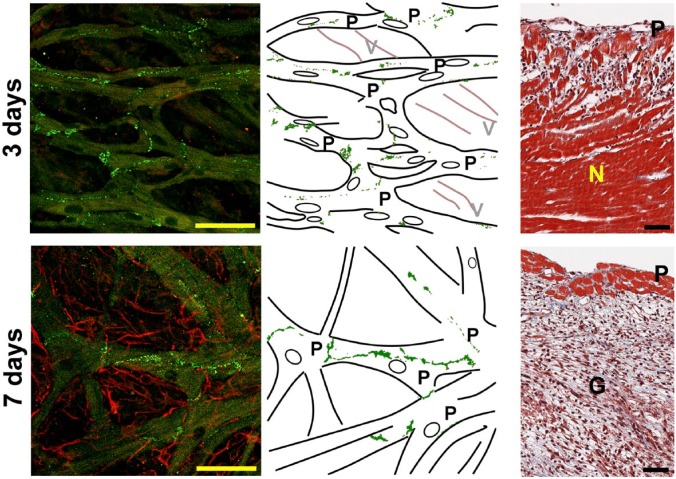
Surviving Purkinje fibers in myocardial infarct are regarded as an important substrate in arrhythmogenesis. However, poorly understood are functional properties of Purkinje fibers in the infarcted heart. We sought to visualize intracellular Ca2+ ([Ca2+]i) dynamics of Purkinje fiber networks in the mouse myocardial infarct. Using 3- to 4-day-old or 7- to 9-day-old infarcted hearts after the left coronary-artery ligation corresponding, respectively, to acute or healing phase, we conducted rapid fluo4-fluorescence imaging on the endocardial surface of the left ventricular septum by macro-zoom fluorescence microscopy and rapid-scanning confocal microscopy. In contrast with the intact heart, where uniform Ca2+ transients propagated rapidly, the infarcted heart exhibited slow, non-uniform impulse propagations. On confocal microscopy, Purkinje fibers in the peri-infarct zone exhibited non-uniform [Ca2+]i dynamics: beat-to-beat alternans of the Ca2+ transient amplitude in and among the individual fibers, whereas the intact fibers exhibited uniform Ca2+ transients. Such non-uniform [Ca2+]i dynamics were more conspicuous in the acute infarcted hearts than in the healing ones. In accordance with [Ca2+]i dynamics, fixed fluo4-loaded heart preparations exhibited definitive connexin-40 plaques in the peri-infarct Purkinje fibers, whereas the subjacent myocardium presented coagulative necrosis and granulation tissues, respectively. The surviving Purkinje fibers in the peri-infarct zone exhibited non-uniform [Ca2+]i dynamics, which may lead to arrhythmogenesis.

Keywords: alternans; arrhythmia; calcium; heart; histopathology.


Conflict of interest statement

Competing Interests: The author(s) declared no potential conflicts of interest with respect to the research, authorship, and/or publication of this article.

Figures

Figure 1.
Figure 1.
Intracellular Ca2+ ([Ca2+]i) dynamics of the mouse non-infarcted heart. (A) Mesoscopic [Ca2+]i dynamics of the endocardial surface of the left ventricular septum. Shown on the leftmost panel is the white-light image of the endocardial surface. The isochronal propagation map of the endocardial surface (middle-left panel) indicates rapid impulse propagation from the base to the apex. The corresponding X-t image along the direction of propagation (horizontal white arrow in the isochronal map) is shown in the middle-right panel. Shown on the rightmost panel is the corresponding X-t image of a Ca2+ transient in an expanded time scale. White scale bars = 5 mm, horizontal bars in X-t = 200 msec, and vertical bars in X-t = 5 mm. (B) [Ca2+]i dynamics of Purkinje fibers and subjacent ventricular myocytes viewed by rapid-scanning confocal microscopy at the basal and middle areas of the left ventricular septum depicted from the two boxes indicated in A. Five X-t images (p1 to p5) obtained from the 100-µm straight scan lines along the longitudinal direction of Purkinje fibers in the X-Y images overlaid with the corresponding plot profiles (upper panel). These plot profiles are superimposed below the X-t images. For the ventricular myocardium beneath the Purkinje fibers (v1 and v2), X-t images and the corresponding plot profiles are on the bottom. White scale bars in X-Y images = 200 µm, horizontal black bars = 1 sec, and vertical bars for X-t image = 100 µm. Abbreviation: ECG, electrocardiogram.
Figure 2.
Figure 2.
Representative histological images of Purkinje fibers in the non-infarcted heart. (A) The confocal fluorescence image of the endocardial surface of the left ventricular septum (left) and its corresponding schematic illustration (middle). The fluorescence image exhibits Purkinje fiber networks with definitive Cx40 plaques (green dots), whereas the ventricular myocardium running behind the Purkinje fibers is devoid of Cx40. The red signals below the Purkinje fibers denote vimentin. Green dots in the illustration indicate the plaques of Cx40. The rightmost panel shows a cross section stained with Masson’s trichrome of the left ventricular septum, indicating absence of infarct. (B) Confocal fluorescence images of the endocardial surface of the left ventricular septum stained with di-4-ANEPPS focused on Purkinje fibers (a) and on the subjacent ventricular myocardium (b). “P” and “V” denote Purkinje fibers and ventricular myocardium, respectively. “END” indicates the endocardial surface. Bars = 50 µm. Abbreviation: Cx40, connexin-40.
Figure 3.
Figure 3.
[Ca2+]i dynamics of the 3-day-old infarcted heart. (A) A mesoscopic white-light image obtained from the endocardial surface of the left ventricular septum (left panel). A pale, tan-colored area bordered by the white dotted line denotes the infarcted lesion. The isochronal propagation map of the corresponding endocardial surface (middle) and the X-t images of [Ca2+]i dynamics with ECG trace (right) show slowing of impulse propagation on the infarct border zone. White scale bars = 5 mm, horizontal bars in X-t = 200 msec, and vertical bars in X-t = 5 mm. (B) [Ca2+]i dynamics of Purkinje fibers and subjacent ventricular myocytes viewed by rapid-scanning confocal microscopy. The fluo4-fluorescence X-Y images of the basal zone, infarct border zone (middle area), and infarct (apical area) and the corresponding X-t images of the five individual Purkinje fibers (p1–p5). As shown in the three X-t images on the infarct zone (p1–p3), ventricular myocytes (v1 and v2) subjacent to the Purkinje fiber networks show nearly indiscernible Ca2+ transients. White scale bars in X-Y images = 200 µm, horizontal black bars for X-t image = 1 sec, and vertical bars for X-t image = 100 µm. Abbreviation: ECG, electrocardiogram.
Figure 4.
Figure 4.
[Ca2+]i dynamics of the 7-day-old infarcted heart. (A) A mesoscopic white-light image of the endocardial surface is shown on the left panel. Note the poorly marginated, pale tan-colored area extending from the middle portion to the apex. The corresponding propagation map shows no discernible rise in [Ca2+]i signals in the infarcted area at the apex with marked slowing of the impulse propagation at the basal zone. The X-t image (right panel) scanned along the white dotted arrow (in the middle panel) indicates somewhat inhomogeneous, diffusely slowed impulse propagation. White scale bars = 5 mm, horizontal bars in X-t = 200 msec, and vertical bars in X-t = 5 mm. (B) [Ca2+]i dynamics of individual Purkinje fibers (p1–p5) and subjacent ventricular myocytes (v1 and v2) in three distinct regions of the endocardial surface (depicted from the boxes shown on the white-light image). The X-t images of Purkinje fibers (1–5) exhibit spatiotemporally non-uniform patterns on the basal and border zones. Asterisks (*) indicate the localized wave-like [Ca2+]i rises. White scale bars in X-Y images = 200 µm, horizontal black bars for X-t image = 1 sec, and vertical bars for X-t image = 100 µm. Abbreviation: ECG, electrocardiogram.
Figure 5.
Figure 5.
Quantitative comparisons of the beat-to-beat variability for the amplitude of Ca2+ transients (alternans ratio). Among the 3 groups of hearts, the beat-to-beat alternans is more remarkable on the infarct border zone at 3–4 days after the coronary-artery ligation than in the control and in the 7- to 9-day-old infarcted hearts as shown in the low alternans ratio. The alternans ratio is returned close to the control level at 7–9 days after ligation. *p<0.01. Abbreviation: NS, not significant.
Figure 6.
Figure 6.
Representative histological images of the endocardial surfaces and the cross sections of the 3-day-old and 7-day-old infarcted hearts. The confocal fluorescence images (left), their corresponding illustrations (middle), and the cross sections stained with Masson’s trichrome of the left ventricle (right). In the confocal fluorescence endocardial images, the Purkinje fiber network is positive for Cx40 (green), whereas the left ventricular myocardium running behind the Purkinje fibers shows no discernible Cx40 signals. On day 7, abundant reticular fibroblasts that are positive for vimentin (red) are observed beneath the endocardial surface, instead of the regular arrangements of the myocardium. The cross section shows massive coagulative necrosis (N) and granulation tissue (G) with apparently viable myocardium and Purkinje fibers (P) on the subendocardial layers. Granulation tissue, replaced by the necrotic myocardium, is identified in the cross section. Scale bars (black and yellow) = 50 µm. Abbreviations: V, ventricular myocardium; Cx40, connexin-40.

Similar articles

Cited by

References

    1. Tawara S. The conduction system of the mammalian heart: an anatomico-histological study of the atrioventricular bundle and the Purkinje fibers. London: Imperial College Press; 2000.
    1. Miquerol L, Meysen S, Mangoni M, Bois P, van Rijen HV, Abran P, Jongsma H, Nargeot J, Gros D. Architectural and functional asymmetry of the His-Purkinje system of the murine heart. Cardiovasc Res. 2004;63:77–86. - PubMed
    1. Tanaka H, Hamamoto T, Takamatsu T. Toward an integrated understanding of the Purkinje fibers in the heart: the functional and morphological interconnection between the Purkinje fibers and ventricular muscle. Acta Histochem Cytochem. 2005;38:257–65.
    1. Daniel TM, Boineau JP, Sabiston DC., Jr. Comparison of human ventricular activation with a canine model in chronic myocardial infarction. Circulation. 1971;44:74–89. - PubMed
    1. Friedman PL, Stewart JR, Wit AL. Spontaneous and induced cardiac arrhythmias in subendocardial Purkinje fibers surviving extensive myocardial infarction in dogs. Circ Res. 1973;33:612–26. - PubMed

Publication types