

The Relative Performance of NDIR-based Sensors in the Near Real-time Analysis of CO₂ in Air
- PMID: 28903190
- PMCID: PMC3841839
- DOI: 10.3390/s7091683
The Relative Performance of NDIR-based Sensors in the Near Real-time Analysis of CO₂ in Air
Abstract
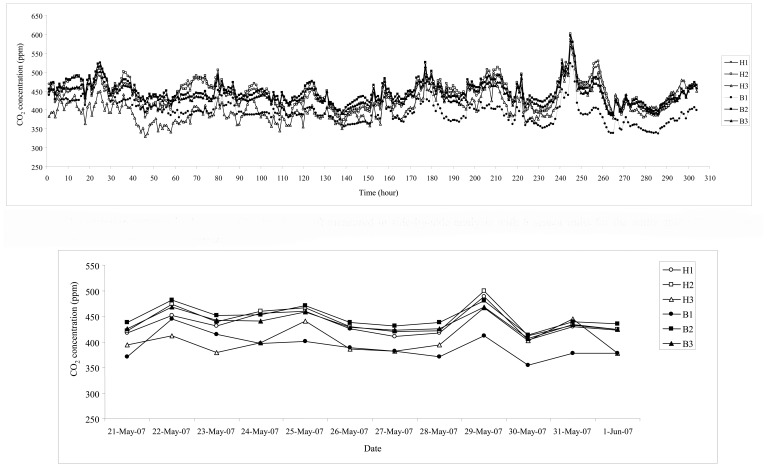
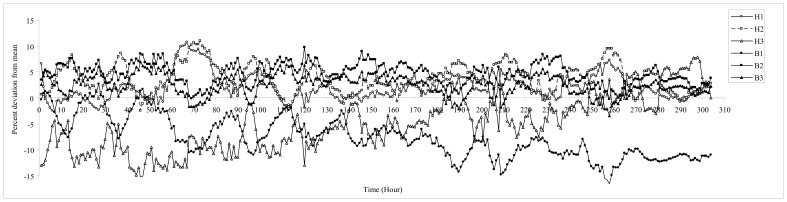
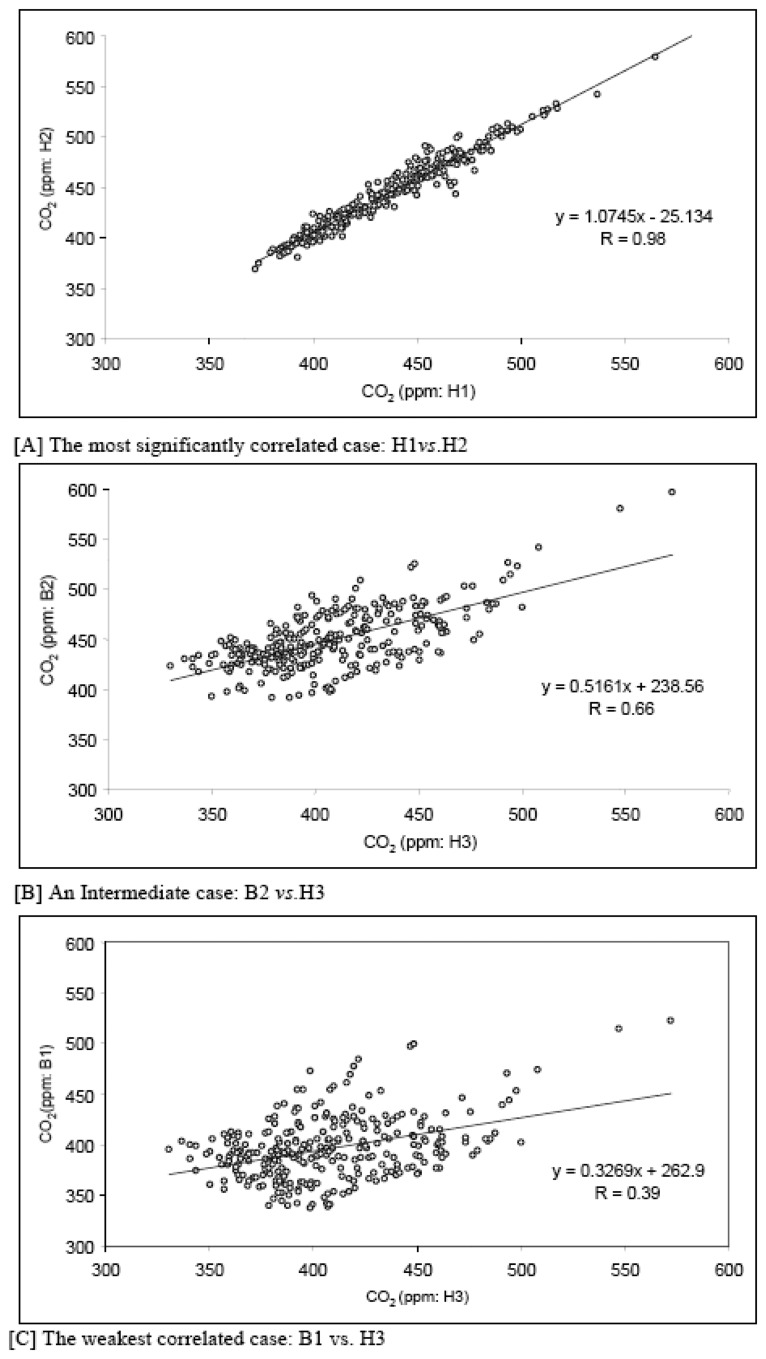
In this study, the reliability of NDIR-based sensors was explored by evaluatingthe comparability between measurement systems in the near real-time analysis of CO₂. Forthis purpose, replicate analyses were performed using sensors of two different model types(H-550 and B-530, ELT Company, Korea). Three replicate data of each sensor typecollected continuously by side-by-side analysis in three second intervals (a duration of 304hour) were evaluated for the relative performance of NDIR sensors. The reproducibility ofsensors, when assessed by relative standard error (RSE %) values of all sensor units,showed moderate changes with time with the overall mean of 2.33%. When CO₂measurements from all NDIR sensor units were evaluated by correlation analysis, theresults showed strong comparability, regardless of the model type. The overall results ofthis study suggest that NDIR sensors are reliable enough to produce highly comparabledata at least in a relative sense.
Keywords: CO2 monitoring; NDIR sensor; performance evaluatio; side-by-side analysis.
Figures


References
-
- WMO The 13th WMO/IAEA Meeting of Experts on Carbon Dioxide Concentration and Related Tracers Measurement Techniques, TD No. 1359); Boulder, Colorado, USA. 19-22 September 2005.2006.
-
- Harvey L.D. D. Allowable CO2concentrations under the United Nations Framework Convention on Climate Change as a function of the climate sensitivity probability distribution function. Environmental Research Letters. 2007 doi: 10.1088/1748-9326/2/1/014001. - DOI
-
- Orr J.C., Fabry V.J., Aumont O., Bopp L., Doney S.C., Feely R.M., Gnanadesikan A., Gruber N., Ishida A.F., Joos R., Key M., Lindsay K., Maier-Reimer E., Matear R.J., Monfray P., Mouchet A., Najjar R.G., Plattner G.-K., Rodgers K.B., Sabine C.L., Sarmiento J.L., Schlitzer R., Slater R.D., Totterdell I.J., Weirig M.-F., Yamanaka Y., Yool A. Anthropogenic ocean acidification over the twenty-first century and its impact on calcifying organisms. Nature. 2005;437:681–686. - PubMed
-
- Henderson E.R. Carbon dioxide measures up as a real hazard. 2006. [Accessed on 12 June, 2007]. http://www.rimbach.com/scripts/Article/ - PubMed
-
- Hannan J. Your Role in the “Greenhouse Effect”. ITEST Bulletin. 1997;28:9–11.
LinkOut - more resources
Full Text Sources
Other Literature Sources
