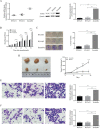
. 2017 May 22;8(33):54735-54746.
doi: 10.18632/oncotarget.18047. eCollection 2017 Aug 15.

AGO2 involves the malignant phenotypes and FAK/PI3K/AKT signaling pathway in hypopharyngeal-derived FaDu cells

Affiliations

AGO2 involves the malignant phenotypes and FAK/PI3K/AKT signaling pathway in hypopharyngeal-derived FaDu cells

Yanhui Zhang et al. Oncotarget. .

Abstract

Argonaute 2 (AGO2) protein is usually overexpressed in various head and neck squamous cell carcinoma. However, the precise molecular mechanisms of AGO2 in hypopharyngeal cancer have not yet been clearly understood. Here we found the AGO2 expression in hypopharyngeal cancer tissues were generally higher comparing with that of the corresponding adjacent noncancerous epithelium tissues, and these were associated with the more aggressive clinicopathologic features and the poor clinical outcomes. Stable knockdown of AGO2 protein retarded cell proliferation, migration, invasion, arrested cell cycle and induced apoptosis. Meanwhile the knockdown also inhibited the FAK/PI3K/AKT signaling pathway in hypopharyngeal-derived FaDu cells. These findings suggested that AGO2 gene might act as an oncogene which contributed to the tumorigenesis and progression, and has potential values for molecular diagnosis, clinical therapies and prognosis evaluation in hypopharyngeal cancer.

Keywords: AGO2; FAK/PI3K/AKT signaling pathway; cell proliferation; hypopharyngeal cancer.


Conflict of interest statement

CONFLICTS OF INTEREST The authors declare no conflicts of interest.

Figures
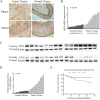
Figure 1
Figure 1. Expression of AGO2 in HPSCC
(A) Representative images of AGO2 expression in HPSCC and adjacent noncancerous epithelium specimens (n=56) were obtained by IHC. AGO2 was positively detected in HPSCC (left, tumor tissues), diffusing cytoplasmic and part of nuclear staining, especially on the edge of the nests with pink keratin in the centers. AGO2 expressed in adjacent noncancerous epithelium was weakly detected (right, normal tissues). (B, C, D) AGO2 mRNA and protein expression data were acquired from 15 patients with HPSCC (tumor tissues) and 15 normal epithelium mucosae tissues of patients underwent uvulopalatopharyngoplasty (normal tissues). Expression levels of AGO2 mRNA were separately normalized to GAPDH. AGO2 protein expression levels were calculated by contrasting the gray levels of each band using ImageJ Software. The histogram represented the expression levels of AGO2 protein, which were normalized to β-actin. Error bars represented mean ± SD from three independent experiments. (E) Kaplan-Meier curve represented survival rate in patients with HPSCC, according to the expression levels of AGO2 (AGO2+, ≥3 score; AGO2-, <3 score). Blue, patients with negative expression of AGO2 (n=17, 3-year survival rate 88.24%); green, patients with positive expression of AGO2 (n=39, 3-year survival rate 56.41%; log-rank test, P=0.03).
Figure 2
Figure 2. Inhibition effects of AGO2 knockdown on FaDu cells in vitro and in vivo
(A) The expression levels of AGO2 mRNA and protein, significantly inhibited by lenti-shRNAs (RNAi#1 and RNAi#2) in comparison with control group, were determined by real-time RT-PCR and western blotting analyses. The expression levels of AGO2 mRNA were normalized to GAPDH. The protein quantities were determined by comparing the gray levels of each band using ImageJ Software, and normalized to control group. (B) In CCK-8 assay, the proliferation ability of stable transducted cells was obviously inhibited with time. (C) The left panel showed crystal staining of colonies. The histogram (right) represented the number of colonies formed. (D) The left panel showed tumors formed 4 weeks after inoculation. The right panel showed the growth curve. (E, F) The representative pictures showed cells migrated and invaded (left panels, 250μm). The histograms (right panels) represented the percentage of cells migrated and invaded, normalized to control group. *P<0.05, **P<0.01, ***P<0.001, ****P<0.0001.
Figure 3
Figure 3. Effects of AGO2 knockdown on cell cycle and apoptosis of stable transducted FaDu cells were assessed by flow cytometry
(A) Representative graphs showed the distribution of cell cycle. Compared with control group, AGO2 knockdown arrested cell cycle in G2/M phase. (B) Representative flow cytometry scatter diagrams of Annexin-V PE/7-AAD staining showed the distribution of viable, apoptotic and necrotic cells. Q1 (Annexin-V PE-/7-AAD+), Q2 (Annexin-V PE+/7-AAD+), Q3 (Annexin-V PE+/7-AAD-) and Q4 (Annexin-V PE-/7-AAD-) separately represented necrotic cells, late apoptotic and necrotic cells, early apoptotic cells, and viable cells. (C) The histogram represented the percentage of cells in G1/G0, S and G2/M phase. (D) The histogram suggested the quantitative results of the percentage of apoptosis in AGO2 knockdown cells and control cells. (E) The left side of the histogram showed the percentage of late apoptotic and necrotic cells, and the right side of the histogram is the percentage of early apoptotic cells (P=0.0673). *P<0.05, **P<0.01, ***P<0.001, ****P<0.0001.
Figure 4
Figure 4. Representative pictures of IHC reflected the expression of Ki-67, cleaved Caspase-3 and E-cadherin in human hypopharyngeal tumor specimens and xenografts
(A1) Ki-67 in HPSCC, (A2) Ki-67 in adjacent noncancerous epithelium, (B1) cleaved Caspase-3 in HPSCC, (B2) cleaved Caspase-3 in adjacent noncancerous epithelium, (C1) E-cadherin in HPSCC, (C2) E-cadherin in adjacent noncancerous epithelium, (D1) Ki-67 in RNAi#1 xenografts, (D2) Ki-67 in RNAi#2 xenografts, (D3) Ki-67 in Scramble xenografts, (E1) cleaved Caspase-3 in RNAi#1 xenografts, (E2) cleaved Caspase-3 in RNAi#2 xenografts, (E3) cleaved Caspase-3 in Scramble xenografts, (F1) E-cadherin in RNAi#1 xenografts, (F2) E-cadherin in RNAi#2 xenografts, (F3) E-cadherin in Scramble xenografts. Scale bars = 250μm.
Figure 5
Figure 5. AGO2 knockdown inhibited FAK/PI3K/AKT pathway in stable transducted FaDu cells
(A) The expression levels of p-FAK in HPSCC (tumor tissues) and adjacent noncancerous epithelium (normal tissues). (B) The histogram show the relative expression levels of p-FAK. (C) The expression of main proteins on FAK/PI3K/AKT pathway in stable transducted FaDu cells. (D) Knockdown of AGO2 inhibited the expression of p-FAK and the activity of PI3K/AKT signaling pathway. *P<0.05, **P<0.01, ***P<0.001, ****P<0.0001.

References

    1. Chung CH, Parker JS, Karaca G, Wu J, Funkhouser WK, Moore D, Butterfoss D, Xiang D, Zanation A, Yin X, Shockley WW, Weissler MC, Dressler LG, et al. Molecular classification of head and neck squamous cell carcinomas using patterns of gene expression. Cancer Cell. 2004;5:489–500. - PubMed
    1. Smith RB, Sniezek JC, Weed DT, Wax MK. Utilization of free tissue transfer in head and neck surgery. Otolaryngol Head Neck Surg. 2007;137:182–191. - PubMed
    1. Vergeer MR, Doornaert PA, Rietveld DH, Leemans CR, Slotman BJ, Langendijk JA. Intensity-modulated radiotherapy reduces radiation-induced morbidity and improves health-related quality of life: results of a nonrandomized prospective study using a standardized follow-up program. Int J Radiat Oncol Biol Phys. 2009;74:1–8. - PubMed
    1. Boscolo-Rizzo P, Maronato F, Marchiori C, Gava A, Da Mosto MC. Long-term quality of life after total laryngectomy and postoperative radiotherapy versus concurrent chemoradiotherapy for laryngeal preservation. Laryngoscope. 2008;118:300–306. - PubMed
    1. Cooper JS, Porter K, Mallin K, Hoffman HT, Weber RS, Ang KK, Gay EG, Langer CJ. National Cancer Database report on cancer of the head and neck: 10-year update. Head Neck. 2009;31:748–758. - PubMed

LinkOut - more resources