. 2017 Jul 21;8(33):55265-55279.
doi: 10.18632/oncotarget.19423. eCollection 2017 Aug 15.

Histone modification alteration coordinated with acquisition of promoter DNA methylation during Epstein-Barr virus infection

Affiliations

Histone modification alteration coordinated with acquisition of promoter DNA methylation during Epstein-Barr virus infection

Sayaka Funata et al. Oncotarget. .

Abstract

Aberrant DNA hypermethylation is a major epigenetic mechanism to inactivate tumor suppressor genes in cancer. Epstein-Barr virus positive gastric cancer is the most frequently hypermethylated tumor among human malignancies. Herein, we performed comprehensive analysis of epigenomic alteration during EBV infection, by Infinium HumanMethylation 450K BeadChip for DNA methylation and ChIP-sequencing for histone modification alteration during EBV infection into gastric cancer cell line MKN7. Among 7,775 genes with increased DNA methylation in promoter regions, roughly half were "DNA methylation-sensitive" genes, which acquired DNA methylation in the whole promoter regions and thus were repressed. These included anti-oncogenic genes, e.g. CDKN2A. The other half were "DNA methylation-resistant" genes, where DNA methylation is acquired in the surrounding of promoter regions, but unmethylated status is protected in the vicinity of transcription start site. These genes thereby retained gene expression, and included DNA repair genes. Histone modification was altered dynamically and coordinately with DNA methylation alteration. DNA methylation-sensitive genes significantly correlated with loss of H3K27me3 pre-marks or decrease of active histone marks, H3K4me3 and H3K27ac. Apoptosis-related genes were significantly enriched in these epigenetically repressed genes. Gain of active histone marks significantly correlated with DNA methylation-resistant genes. Genes related to mitotic cell cycle and DNA repair were significantly enriched in these epigenetically activated genes. Our data show that orchestrated epigenetic alterations are important in gene regulation during EBV infection, and histone modification status in promoter regions significantly associated with acquisition of de novo DNA methylation or protection of unmethylated status at transcription start site.

Keywords: DNA methylation; Epstein-Barr virus; gastric cancer.


Conflict of interest statement

CONFLICTS OF INTEREST All authors have no potential conflicts of interest to disclose.

Figures
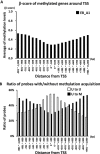
Figure 1
Figure 1. Distribution of DNA methylation status around the TSS after EBV infection
(A) β-score of de novo methylated genes around the TSS. If the methylation status of an Infinium probe was altered from U in MKN7_WT to M in MKN7_EB_A1 cells, the probe was called “U to M” probe. If there were ≥ 1 “U to M” probes within ± 1,000 bp from the TSS, we regarded the genes as de novo methylation-induced genes, and 9,275 genes satisfied the criteria. The average of β-score of all the probes within ± 1,000 bp from the TSS of the 9,275 genes was calculated based on the distance from the TSS, and the distribution of DNA methylation levels around the TSS in MKN7_EB_A1 cells was shown. (B) Distribution of “U to U” and “U to M” probes around the TSS. Among the 9,275 methylation-induced genes, “U to U” and “U to M” probes were separately counted based on the distance from the TSS, and their ratios to all the probes are shown.
Figure 2
Figure 2. Patterns of DNA methylation acquisition during EBV infection
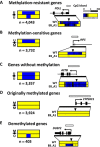
(A) Methylation-resistant genes. Among the methylation-induced genes that had at least one “U to M” probe within ± 1000 bp from the TSS, 4,043 genes were found to have ≥ 2 consecutive “U to U” probes within ±500 bp from the TSS, and were defined as methylation-resistant genes. (B) Among the methylation-induced genes, 3,732 genes did not have consecutive “U to U” probes within ± 500 bp from the TSS, and were defined as methylation-sensitive genes. (C) In 3,357 genes without methylation, all the probes within ± 1,000 bp from the TSS were “U to U” probes. (D) In 3,924 originally methylated genes, all the probes within ± 1,000 bp from TSS were “M to M” probes. (E) In 403 demethylated genes, at least one probe was “M to U” probe within 500 bp from the TSS.
Figure 3
Figure 3. Characteristics of methylation-sensitive and methylation-resistant genes
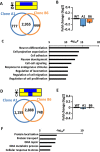
(A) The methylation-sensitive genes in MKN7_EB_A1 cells and those in MKN7_EB_B6 cells overlapped well. (B) The expression of methylation-sensitive genes in MKN7_WT, MKN7_EB_A1, and MKN7_EB_B6 cells was compared and is shown by fold expression change against WT. Methylation-sensitive genes were repressed in both MKN7_EB_A1 and MKN7_EB_B6 cells. (C) GO terms enriched in the overlapped methylation-sensitive genes were analyzed, and terms related to differentiation, cell adhesion, development, and regulation of cell proliferation were significant. (D) The methylation-resistant genes in MKN7_EB_A1 and MKN7_EB_B6 cells overlapped well. (E) The expression of methylation-resistant genes in WT, MKN7_EB_A1, and MKN7_EB_B6 cells was compared and is shown by fold expression change against WT. Expression levels of methylation-resistant genes in MKN7_WT cells were maintained in both MKN7_EB_A1 and MKN7_EB_B6 cells. (F) GO terms enriched in the overlapped methylation-resistant genes were analyzed, and terms related to DNA repair were significant.
Figure 4
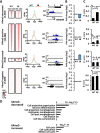
Figure 4. H3K4me3 alteration during EBV infection and its correlation to gene expression and DNA methylation induction
(A) H3K4me3 signals at promoters in MKN7_WT and MKN7_EB_A1 cells. Compared with H3K4me3 signal around the TSS in MKN7_WT cells, that in MKN7_EB_A1 was decreased in 2,363 genes (decreased), remained positive in 10,284 genes (positive), increased in 913 genes (increased), and remained negative in 7,039 genes (negative). The heatmap shows the distribution of H3K4me3 signals of all the genes included in each subset within ± 2 kb from the TSS (left). The average profile plot shows the distribution of averaged H3K4me3 signal within ± 4 kb from the TSS (middle). Distribution of ChIP-seq reads of a representative gene is shown (right). (B) The gene expression was compared between MKN7_WT and MKN7_EB_A1 cells, and presented as fold expression change against WT. Gene expression was markedly downregulated in “decreased” genes (top), retained in “positive” genes (second), markedly upregulated in “increased” genes (third), and retained in “negative” genes (bottom). (C) As for DNA methylation alteration, β-score of each gene at the probe nearest to the TSS was compared between MKN7_WT and MKN7_EB_A1 cells, and presented as the average and SE. The methylation level was markedly elevated in “decreased” genes (top), retained at unmethylated state in “positive” (second) and “increased” genes (third), and retained at methylated state in “negative” genes (bottom). (D) GO term enrichment in genes with increased and decreased H3K4me3 signal. Genes related to differentiation and morphogenesis were significantly enriched in genes with decreased H3K4me3 signal, whereas genes related to cell cycle were significantly enriched in genes with increased H3K4me3 signal.
Figure 5
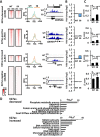
Figure 5. H3K27ac alteration during EBV infection, and its correlation to gene expression and DNA methylation induction
(A) H3K27ac signals at promoters in MKKN7_WT and MKN7_EB_A1 cells. Compared with H3K27ac signal around the TSS in MKN7_WT cells, that in MKN7_EB_A1 cells was decreased in 2,350 genes (decreased), remained positive in 5,582 genes (positive), increased in 1,817 genes (increased), and remained negative in 10,850 genes (negative). The heatmap shows the distribution of H3K27ac signals of all the genes included in each subset within ± 2 kb from the TSS (left). The average profile plot shows the distribution of averaged H3K27ac signal within ± 4 kb from the TSS (middle). Distribution of ChIP-seq reads of a representative gene is shown (right). (B) The gene expression was compared between MKN7_WT and MKN7_EB_A1 cells and presented as fold expression change against WT. Gene expression was markedly downregulated in “decreased” genes (top), retained in “positive” genes (second), markedly upregulated in “increased” genes (third), and retained in “negative” genes (bottom). (C) As for DNA methylation alteration, β-score of each gene at the probe nearest to the TSS was compared between MKN7_WT and MKN7_EB_A1 cells, and presented as the average and SE. The methylation level was markedly elevated in “decreased” genes (top), retained at unmethylated state in “positive” (second) and “increased” genes (third), and retained at high levels in “negative” genes (bottom). (D) GO term enrichment in genes with increased and decreased H3K27ac signal. Genes related to cell cycle and DNA repair were significantly enriched in genes with increased H3K27ac signal, whereas genes related to apoptosis and cell death were significantly enriched in genes with decreased H3K27ac signal.
Figure 6
Figure 6. H3K27me3 alteration during EBV infection and its correlation to gene expression and DNA methylation induction
(A) H3K27me3 signals at promoters in MKKN7_WT and MKN7_EB_A1 cells. Compared with H3K27me3 signal around the TSS in MKN7_WT cells, that in MKN7_EB_A1 cells was decreased in 2,262 genes (decreased), remained positive in as few as 84 genes (positive), increased in as few as 31 genes (increased), and remained negative in 18,222 genes (negative). The heatmap shows the distribution of H3K27me3 signals of all the genes included in each subset within ± 2 kb from the TSS (left). The average profile plot shows the distribution of averaged H3K27me3 signal within ± 4 kb from the TSS (middle). Distribution of ChIP-seq reads of a representative gene is shown (right). (B) The gene expression was compared between MKN7_WT and MKN7_EB_A1 cells and presented as fold expression change against WT. Gene expression was not upregulated in “decreased” genes despite of loss of repressive H3K27me3 histone mark (top) and was retained in “negative” genes (bottom). (C) As for DNA methylation alteration, β-score of each gene at the probe nearest to the TSS was compared between MKN7_WT and MKN7_EB_A1 cells and presented as the average and SE. The methylation level was markedly elevated to methylated state in “decreased” genes during the loss of repressive H3K27me3 histone mark (top). (D) GO term enrichment in genes with decreased H3K27me3 signal. Genes related to differentiation and morphogenesis were significantly enriched in genes with increased H3K27me3 signal.
Figure 7
Figure 7. Ratio of methylation-sensitive and resistant genes and its association with histone modification alteration patterns
As for each of 12 histone modification alteration patterns (See Figures 4, 5, and 6), DNA methylation levels were assessed by calculating the average of β-scores based on the distance from the TSS. The Pie chart shows the number of the methylation-sensitive genes (black) and methylation-resistant genes (white).
Figure 8
Figure 8. Integrated analysis of all the histone marks and DNA methylation
Genes decreasing H3K4me3 signal generally related to DNA methylation-sensitive genes and gene repression, but were further classified into four subgroups (#1-#4). Whereas genes also losing H3K27ac (#2) and retaining H3K27ac-negative status (#3) strongly associated with DNA methylation-sensitive genes and gene repression, genes retaining H3K27ac-positive status (#1) rather associated with DNA methylation-resistant genes and were thus less downregulated. Genes retaining H3K4me3-positive status generally related to DNA methylation-resistant genes, but were further classified into five subgroups (#5-#9). Whereas genes without H3K27me3 mark (#5-#8) strongly associated with DNA methylation-resistant genes regardless H3K27ac status, genes losing H3K27me3 mark (#9) strongly associated with DNA methylation-sensitive genes. Gene expression alteration in subgroups #5-#8 depended on H3K27ac alteration patterns. Genes with increased H3K4me3 signal generally related to DNA methylation-resistant genes (#10-#12). Genes retaining H3K4me3-negative status were further classified into two subgroups (#13-#14). Whereas genes retaining H3K27ac-negative and H3K27me3-negative status (#13) strongly associated with originally methylated genes, genes losing H3K27me3 mark associated with DNA methylation-sensitive genes. Regardless of H3K4me3 status, genes losing H3K27me3 mark at promoters (#4, #9, #14) associated with DNA methylation-sensitive genes.

Similar articles

Cited by

References

    1. Feinberg AP, Ohlsson R, Henikoff S. The epigenetic progenitor origin of human cancer. Nat Rev Genet. 2006;7:21–33. - PubMed
    1. Jones PA. Functions of DNA methylation: islands, start sites, gene bodies and beyond. Nat Rev Genet. 2012;13:484–492. - PubMed
    1. Funata S, Fukayama M, Kaneda A. De NovoMethylation in. Cancer. 2016;eLS:1–7. https://doi.org/10.1002/9780470015902.a0026465. - DOI
    1. Matsusaka K, Kaneda A, Nagae G, Ushiku T, Kikuchi Y, Hino R, Uozaki H, Seto Y, Takada K, Aburatani H, Fukayama M. Classification of Epstein-Barr virus-positive gastric cancers by definition of DNA methylation epigenotypes. Cancer Res. 2011;71:7187–7197. - PubMed
    1. Wang K, Yuen ST, Xu J, Lee SP, Yan HH, Shi ST, Siu HC, Deng S, Chu KM, Law S, Chan KH, Chan AS, Tsui WY, et al. Whole-genome sequencing and comprehensive molecular profiling identify new driver mutations in gastric cancer. Nat Genet. 2014;46:573–582. - PubMed