. 2017 Oct;27(10):1645-1657.
doi: 10.1101/gr.220533.117. Epub 2017 Sep 13.

Identification of a core TP53 transcriptional program with highly distributed tumor suppressive activity

Affiliations

Identification of a core TP53 transcriptional program with highly distributed tumor suppressive activity

Zdenek Andrysik et al. Genome Res. 2017 Oct.

Abstract

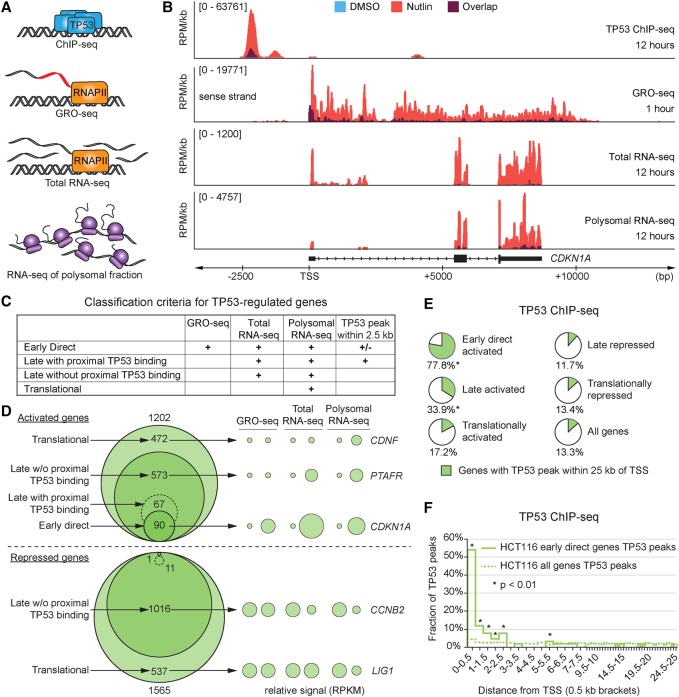
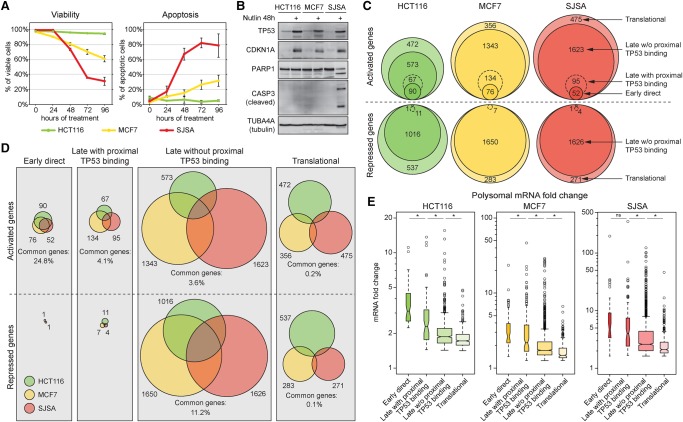
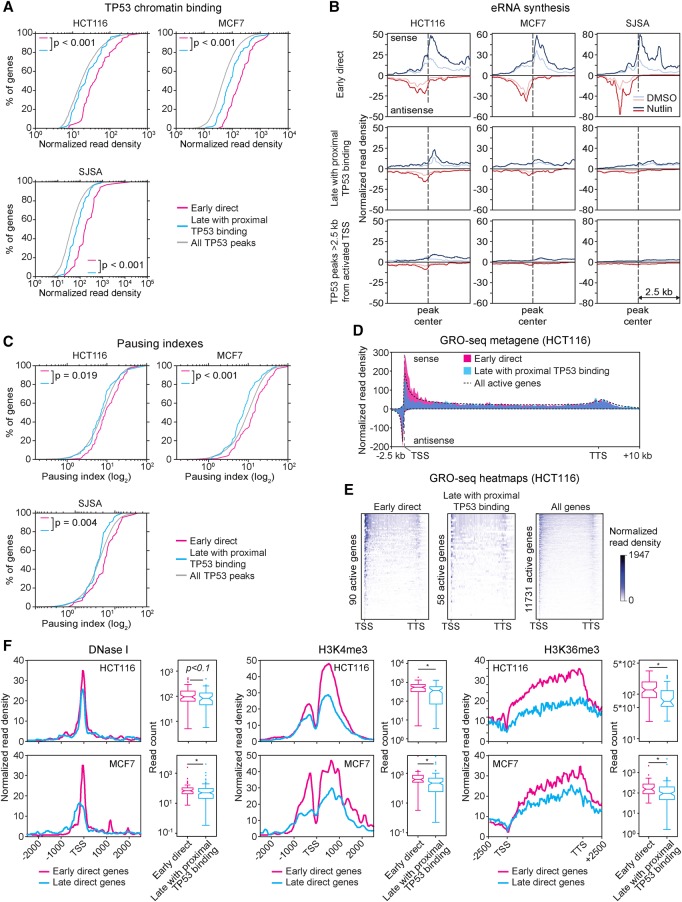
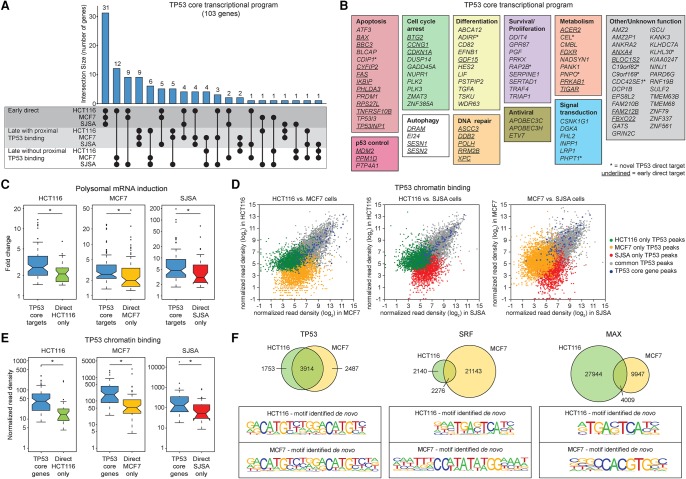
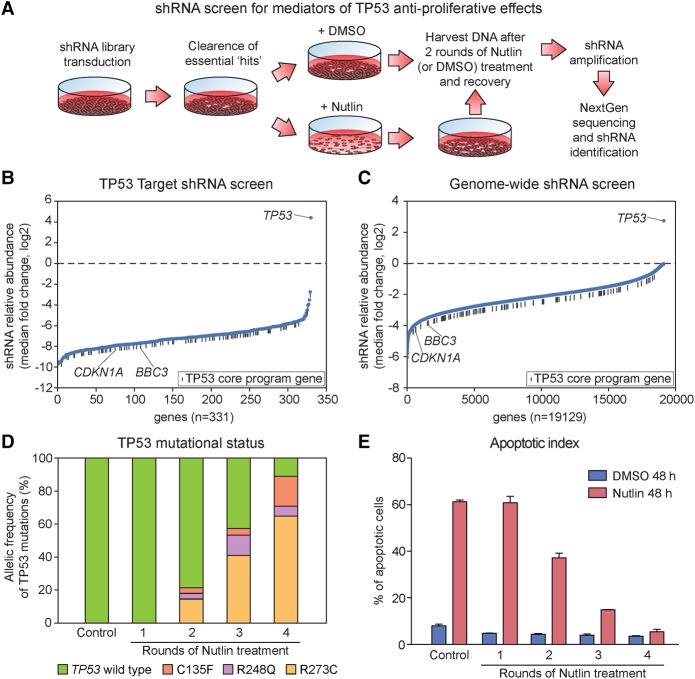
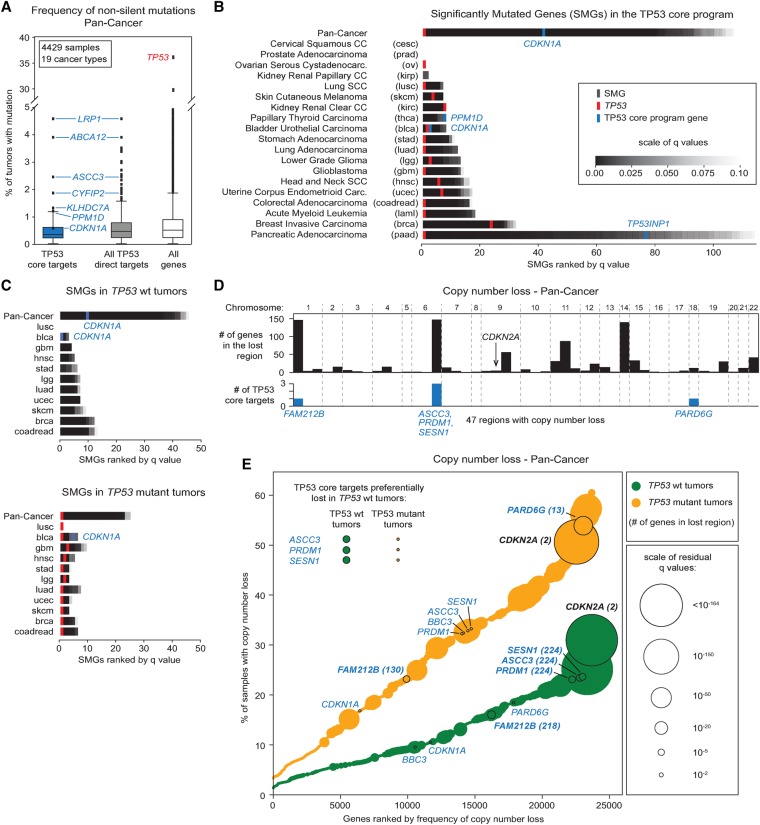
The tumor suppressor TP53 is the most frequently mutated gene product in human cancer. Close to half of all solid tumors carry inactivating mutations in the TP53 gene, while in the remaining cases, TP53 activity is abrogated by other oncogenic events, such as hyperactivation of its endogenous repressors MDM2 or MDM4. Despite identification of hundreds of genes regulated by this transcription factor, it remains unclear which direct target genes and downstream pathways are essential for the tumor suppressive function of TP53. We set out to address this problem by generating multiple genomic data sets for three different cancer cell lines, allowing the identification of distinct sets of TP53-regulated genes, from early transcriptional targets through to late targets controlled at the translational level. We found that although TP53 elicits vastly divergent signaling cascades across cell lines, it directly activates a core transcriptional program of ∼100 genes with diverse biological functions, regardless of cell type or cellular response to TP53 activation. This core program is associated with high-occupancy TP53 enhancers, high levels of paused RNA polymerases, and accessible chromatin. Interestingly, two different shRNA screens failed to identify a single TP53 target gene required for the anti-proliferative effects of TP53 during pharmacological activation in vitro. Furthermore, bioinformatics analysis of thousands of cancer genomes revealed that none of these core target genes are frequently inactivated in tumors expressing wild-type TP53. These results support the hypothesis that TP53 activates a genetically robust transcriptional program with highly distributed tumor suppressive functions acting in diverse cellular contexts.


Figures

Figure 1.
Figure 1.
Multidimensional analysis of the TP53 network. (A) Schematic of the four data sets generated for identification of different classes of TP53-regulated genes. (B) Genome browser snapshots of the CDKN1A locus. HCT116 cells were treated with 10 µM Nutlin-3 or 0.2% DMSO (vehicle) for indicated times. (RPM/kb) Reads per million per kilobase, (TSS) transcription start site. (C) Summary of criteria used for classification of genes within the TP53 network. (D) Venn diagrams display the number of genes in each class following TP53 activation in HCT116 cells. Bubble plots show relative RPKM signals derived from GRO-seq and RNA-seq experiments for example genes regulated at different steps of the central dogma. See Supplemental Methods for details. (E) Pie charts show fractions of genes with a TP53 binding peak within 25 kb of the TSS in HCT116 cells. Asterisks indicate fractions where P < 0.01, using a χ2 test with Yates’ correction, compared to the “All genes” group. (F) Distribution of TP53 peaks within 25 kb of the TSS in 0.5-kb bins. Statistics: χ2 with Yates’ correction, P < 0.01. See also Supplemental Figure S1 and Supplemental Files S1–S5.
Figure 2.
Figure 2.
Cell-type–specific configurations of the TP53 signaling cascade. (A) Flow cytometric analysis of cellular viability (propidium iodide exclusion assay) and apoptosis (Annexin-V staining). Data points represent mean ± SD of three independent experiments. (B) Western blots showing TP53 and CDKN1A accumulation in HCT116, MCF7, and SJSA cells treated with 10 µM Nutlin-3 for 48 h. Only SJSA cells show cleavage of PARP and CASP3. (C,D) Venn diagrams illustrate fractions of genes up- or down-regulated in response to TP53 activation in each cell type. (E) Box plots showing fold change distributions of polysome-associated mRNAs across each cell line for the indicated categories. Statistics: Mann-Whitney U test, P < 0.01. See also Supplemental Figures S2 and S3, and Supplemental Files S1–S5.
Figure 3.
Figure 3.
Early and late TP53 target genes display distinct regulatory features. (A) Cumulative distribution plots of TP53 ChIP-seq peak read densities for TP53 binding events within 25 kb of the transcription start site of early direct targets (magenta), late targets with proximal binding (turquoise), and all TP53 peaks across the genome (gray). Statistics: Mann-Whitney U test. (B) Metaprofiles of GRO-seq signals within 2.5 kb from the TP53 ChIP-seq peaks associated with genes in the indicated categories. Normalized read density represents GRO-seq reads per bp per 10 million mapped reads. (C) Cumulative distribution plots of RNA polymerase pausing indexes for transcriptionally active genes in the indicated categories in HCT116 cells. Statistics: Mann-Whitney U test. (D) Metagene profiles showing GRO-seq signal distribution at direct early versus late targets with proximal binding, in comparison to all transcriptionally active genes in vehicle (DMSO)-treated HCT116 cells. Normalized read density represents GRO-seq reads per bp per 10 million mapped reads, adjusted for gene length. (E) Heat maps displaying GRO-seq signals (sense strand only) at active early direct targets, late targets with proximal binding, and all active genes in vehicle-treated HCT116 cells. Normalized read density represents GRO-seq reads per bp per 10 million mapped reads, adjusted for gene length. (F) Metagene profiles and box and whisker plots of DNase I sensitivity, H3K4 trimethylation, and H3K36 trimethylation at early direct targets and late targets with proximal TP53 binding. Data obtained from the ENCODE project. Statistics: Mann-Whitney U test, P < 0.01. See also Supplemental Figure S4.
Figure 4.
Figure 4.
Identification of a core TP53 transcriptional program. (A) Upset plot showing conserved core TP53 target genes derived from the early direct and late target genes with and without proximal binding identified in HCT116, MCF7, and SJSA cells. (B) The core TP53 transcriptional program is composed of genes functioning in multiple effector pathways and genes of unknown function. Early direct target genes are underlined, previously unidentified targets are indicated with asterisks. (C) mRNA fold changes of core TP53 target genes versus cell-type–specific direct TP53 target genes (early direct and late targets with proximal binding combined). Statistics: Mann-Whitney U test, P < 0.01. (D) Scatter plots displaying normalized read densities for each TP53 ChIP-seq peak detected, for each pairwise comparison between cell lines. (E) Box and whisker plots showing normalized ChIP-seq read densities for TP53 peaks within 25 kb of the transcription start site of core TP53 target genes, compared to TP53 peaks associated with cell line-specific direct target genes. Statistics: Mann-Whitney U test, P < 0.01. (F) Venn diagrams comparing unique and overlapping (within a 100-bp window) transcription factor binding events in HCT116 versus MCF7 cells for TP53, SRF, and MAX. Bottom panels show the position weight matrices identified during de novo motif discovery for each cell line. See also Supplemental Figure S5 and Supplemental Files S6 and S7.
Figure 5.
Figure 5.
shRNA screens reveal that the anti-proliferative activity of TP53 is highly distributed among its target genes. (A) Schematic of experimental design. After library transduction, SJSA cells were propagated in culture to deplete cells carrying shRNAs targeting essential genes. SJSA cultures were then treated with Nutlin-3 or vehicle (DMSO) for 48 h, and surviving cells were then allowed to recover and propagate after drug removal. Two rounds of treatment and recovery were carried out before analysis of shRNA abundance. See Supplemental Methods for details. (B,C) Ranking of all genes targeted in each screen by median fold change (Nutlin-3/DMSO) of all shRNAs targeting each gene, from those showing strongest shRNA depletion to strongest shRNA enrichment. (D) Analysis of TP53 mutation status after multiple rounds of Nutlin-3 treatment and recovery as in A reveals the rapid appearance of inactivating mutations in the TP53 locus. (E) SJSA cells treated as in A become resistant to the apoptotic effects of Nutlin-3 after four rounds of treatment. After each round of recovery, cells were exposed to Nutlin-3 for 48 h and the fraction of apoptotic cells was measured by Annexin-V staining. See also Supplemental File S8.
Figure 6.
Figure 6.
Select TP53 target genes are inactivated at low rates in human cancers expressing wild-type TP53. (A) Frequency of nonsilent mutations for TP53 core target genes, all direct TP53 target genes (early direct plus late targets with proximal binding), and all genes in the genome across 4429 tumor samples. (B) Significantly mutated genes (SMGs) in the TP53 core program identified by MutSigCV in pan-cancer and cancer-type–specific analyses. SMGs are ranked based first on q-values and then by mutation frequency. For the full list of SMGs, see Supplemental File S9. (C) SMG identification as in B dividing tumors based on their TP53 mutation status. Only tumor types with sufficient numbers in each group were analyzed. (D) Genome regions showing significant copy number losses identified with GISTIC 2.0 (q < 0.01) in a pan-cancer analysis. Lost TP53 core target genes are highlighted in blue. The complete list of significantly lost regions can be found in Supplemental File S10. (E) Cumulative distribution plots for copy number loss frequencies identified with GISTIC 2.0 in a pan-cancer analysis. The size of each point (gene) reflects the significance of the loss (q-value). TP53 wild-type (green) and mutant (orange) tumors were analyzed and plotted separately. Genes highlighted in bold show a significant copy number loss (GISTIC 2.0, q < 0.01). See also Supplemental Figure S6 and Supplemental Files S9, S10.

References

    1. Adelman K, Kennedy MA, Nechaev S, Gilchrist DA, Muse GW, Chinenov Y, Rogatsky I. 2009. Immediate mediators of the inflammatory response are poised for gene activation through RNA polymerase II stalling. Proc Natl Acad Sci 106: 18207–18212. - PMC - PubMed
    1. Allen MA, Andrysik Z, Dengler VL, Mellert HS, Guarnieri A, Freeman JA, Sullivan KD, Galbraith MD, Luo X, Kraus WL, et al. 2014. Global analysis of p53-regulated transcription identifies its direct targets and unexpected regulatory mechanisms. eLife 3: e02200. - PMC - PubMed
    1. Brady CA, Jiang D, Mello SS, Johnson TM, Jarvis LA, Kozak MM, Kenzelmann Broz D, Basak S, Park EJ, McLaughlin ME, et al. 2011. Distinct p53 transcriptional programs dictate acute DNA-damage responses and tumor suppression. Cell 145: 571–583. - PMC - PubMed
    1. Brummelkamp TR, Fabius AW, Mullenders J, Madiredjo M, Velds A, Kerkhoven RM, Bernards R, Beijersbergen RL. 2006. An shRNA barcode screen provides insight into cancer cell vulnerability to MDM2 inhibitors. Nat Chem Biol 2: 202–206. - PubMed
    1. el-Deiry WS, Tokino T, Velculescu VE, Levy DB, Parsons R, Trent JM, Lin D, Mercer WE, Kinzler KW, Vogelstein B. 1993. WAF1, a potential mediator of p53 tumor suppression. Cell 75: 817–825. - PubMed

MeSH terms