

Optical Coherence Tomography Detects Necrotic Regions and Volumetrically Quantifies Multicellular Tumor Spheroids
- PMID: 28904062
- PMCID: PMC5866924
- DOI: 10.1158/0008-5472.CAN-17-0821
Optical Coherence Tomography Detects Necrotic Regions and Volumetrically Quantifies Multicellular Tumor Spheroids
Abstract
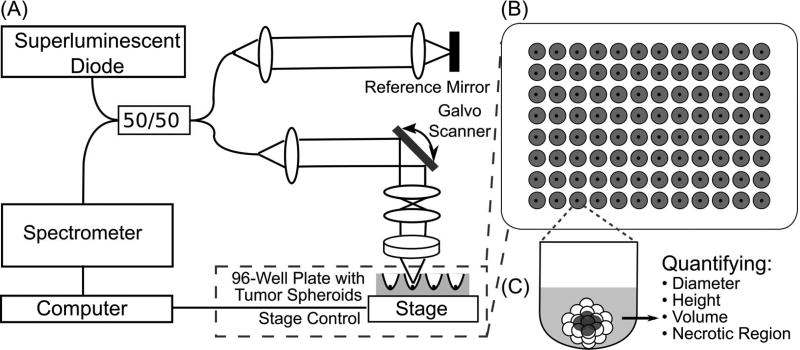
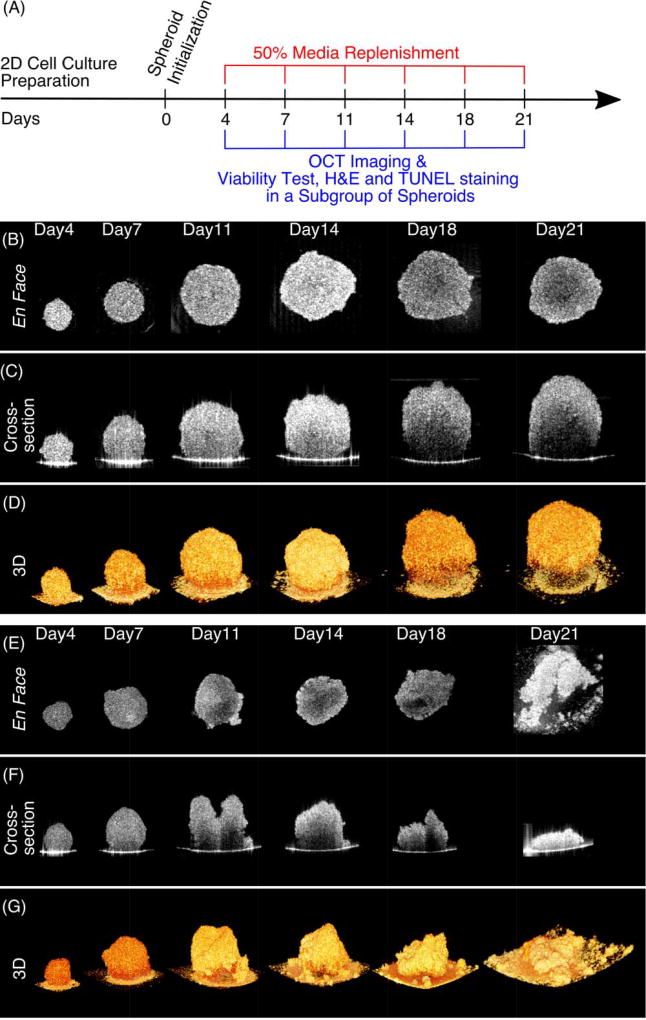
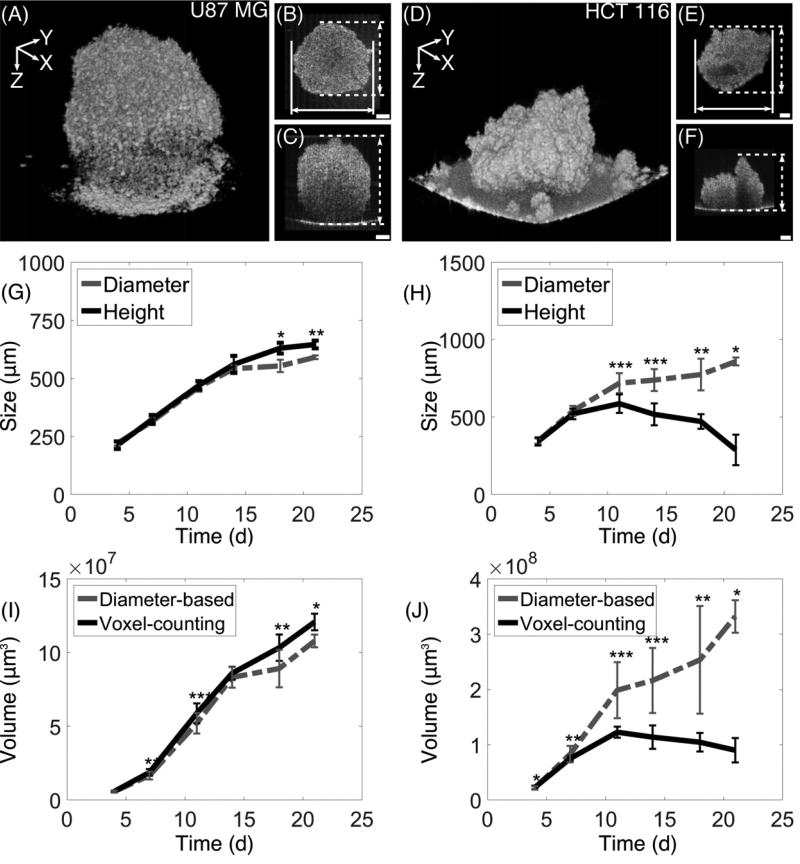
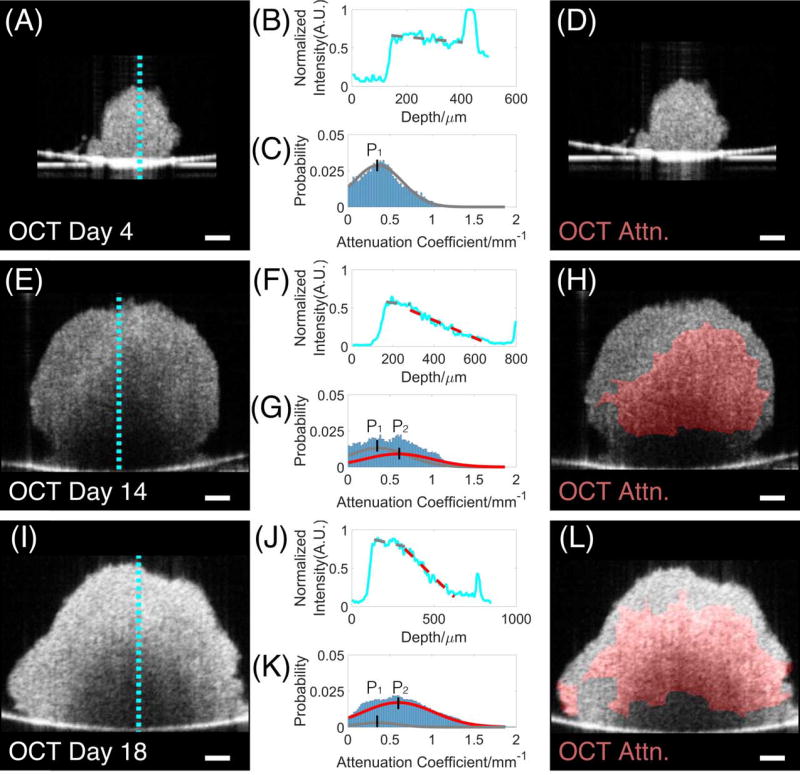
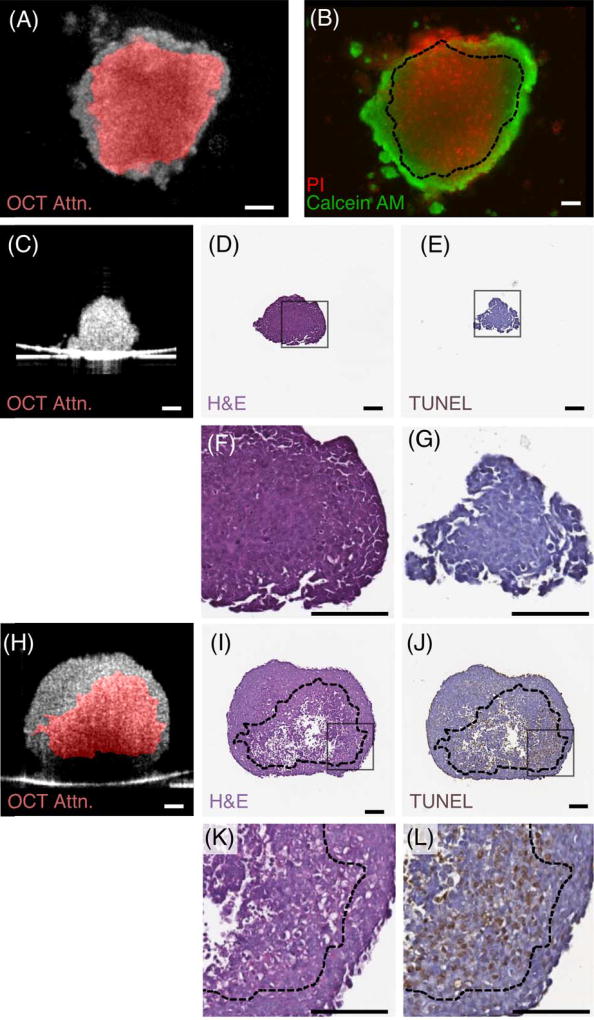
Three-dimensional (3D) tumor spheroid models have gained increased recognition as important tools in cancer research and anticancer drug development. However, currently available imaging approaches used in high-throughput screening drug discovery platforms, for example, bright-field, phase contrast, and fluorescence microscopies, are unable to resolve 3D structures deep inside (>50 μm) tumor spheroids. In this study, we established a label-free, noninvasive optical coherence tomography (OCT) imaging platform to characterize 3D morphologic and physiologic information of multicellular tumor spheroids (MCTS) growing from approximately 250 to 600 μm in height over 21 days. In particular, tumor spheroids of two cell lines, glioblastoma (U-87MG) and colorectal carcinoma (HCT116), exhibited distinctive evolutions in their geometric shapes at late growth stages. Volumes of MCTS were accurately quantified using a voxel-based approach without presumptions of their geometries. In contrast, conventional diameter-based volume calculations assuming perfect spherical shape resulted in large quantification errors. Furthermore, we successfully detected necrotic regions within these tumor spheroids based on increased intrinsic optical attenuation, suggesting a promising alternative of label-free viability tests in tumor spheroids. Therefore, OCT can serve as a promising imaging modality to characterize morphologic and physiologic features of MCTS, showing great potential for high-throughput drug screening. Cancer Res; 77(21); 6011-20. ©2017 AACR.
©2017 American Association for Cancer Research.
Conflict of interest statement
Figures
Similar articles
-
Longitudinal Morphological and Physiological Monitoring of Three-dimensional Tumor Spheroids Using Optical Coherence Tomography.J Vis Exp. 2019 Feb 9;(144):10.3791/59020. doi: 10.3791/59020. J Vis Exp. 2019. PMID: 30799861 Free PMC article.
-
Characterization and quantification of necrotic tissues and morphology in multicellular ovarian cancer tumor spheroids using optical coherence tomography.Biomed Opt Express. 2021 May 13;12(6):3352-3371. doi: 10.1364/BOE.425512. eCollection 2021 Jun 1. Biomed Opt Express. 2021. PMID: 34221665 Free PMC article.
-
Imaging growth dynamics of tumour spheroids using optical coherence tomography.Biotechnol Lett. 2007 Feb;29(2):273-8. doi: 10.1007/s10529-006-9232-2. Epub 2006 Dec 8. Biotechnol Lett. 2007. PMID: 17160349
-
Experimental anti-tumor therapy in 3-D: spheroids--old hat or new challenge?Int J Radiat Biol. 2007 Nov-Dec;83(11-12):849-71. doi: 10.1080/09553000701727531. Int J Radiat Biol. 2007. PMID: 18058370 Review.
-
Recent Advances in Multicellular Tumor Spheroid Generation for Drug Screening.Biosensors (Basel). 2021 Nov 11;11(11):445. doi: 10.3390/bios11110445. Biosensors (Basel). 2021. PMID: 34821661 Free PMC article. Review.
Cited by
-
Optimized single-step optical clearing solution for 3D volume imaging of biological structures.Commun Biol. 2022 May 9;5(1):431. doi: 10.1038/s42003-022-03388-8. Commun Biol. 2022. PMID: 35534680 Free PMC article.
-
Optical coherence tomography complements confocal microscopy for investigation of multicellular tumour spheroids.Sci Rep. 2019 Jul 22;9(1):10601. doi: 10.1038/s41598-019-47000-2. Sci Rep. 2019. PMID: 31332221 Free PMC article.
-
Label-free visualization and quantification of the drug-type-dependent response of tumor spheroids by dynamic optical coherence tomography.Sci Rep. 2024 Feb 9;14(1):3366. doi: 10.1038/s41598-024-53171-4. Sci Rep. 2024. PMID: 38336794 Free PMC article.
-
Longitudinal Morphological and Physiological Monitoring of Three-dimensional Tumor Spheroids Using Optical Coherence Tomography.J Vis Exp. 2019 Feb 9;(144):10.3791/59020. doi: 10.3791/59020. J Vis Exp. 2019. PMID: 30799861 Free PMC article.
-
Facile Tumor Spheroids Formation in Large Quantity with Controllable Size and High Uniformity.Sci Rep. 2018 May 1;8(1):6837. doi: 10.1038/s41598-018-25203-3. Sci Rep. 2018. PMID: 29717201 Free PMC article.
References
-
- Kola I, Landis J. Can the pharmaceutical industry reduce attrition rates? Nat Rev Drug Discov. 2004;3(8):711–6. - PubMed
-
- Breslin S, O’Driscoll L. Three-dimensional cell culture: the missing link in drug discovery. Drug Discov Today. 2013;18:240–9. - PubMed
-
- Hickman JA, Graeser R, de Hoogt R, Vidic S, Brito C, Gutekunst M, et al. Three-dimensional models of cancer for pharmacology and cancer cell biology: Capturing tumor complexity in vitro/ex vivo. Biotechnol J. 2014;9(9):1115–28. - PubMed
-
- Sutherland RM. Cell and environment interactions in tumor microregions: the multicell spheroid model. Science. 1988;240(4849):177–84. - PubMed
-
- Mueller-Klieser W. Three-dimensional cell cultures: from molecular mechanisms to clinical applications. Am J Physiol Cell Physiol. 1997;273:C1109–C23. - PubMed
Publication types
MeSH terms
Grants and funding
LinkOut - more resources
Full Text Sources
Other Literature Sources
