. 2017 Dec 1;118(6):3014-3023.
doi: 10.1152/jn.00237.2017. Epub 2017 Sep 13.

Characterization of ion channels and O2 sensitivity in gill neuroepithelial cells of the anoxia-tolerant goldfish (Carassius auratus)

Affiliations

Characterization of ion channels and O2 sensitivity in gill neuroepithelial cells of the anoxia-tolerant goldfish (Carassius auratus)

Peter C Zachar et al. J Neurophysiol. .

Abstract

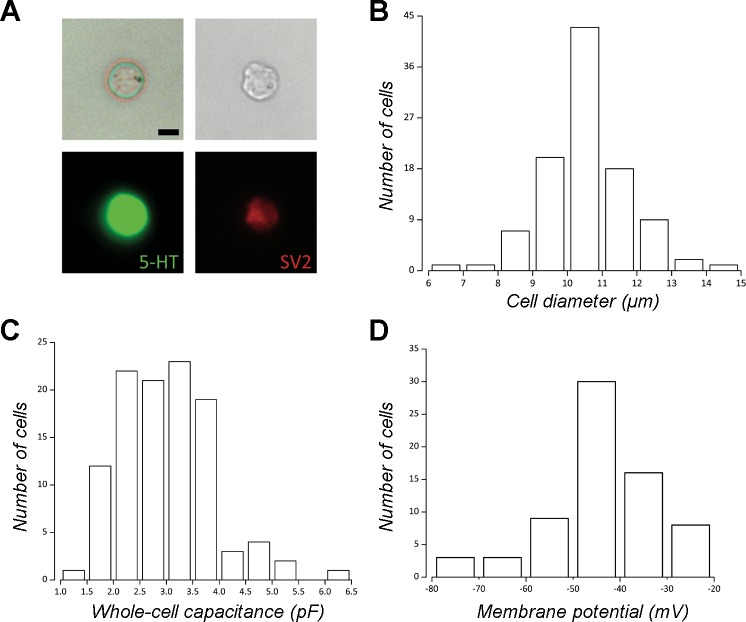
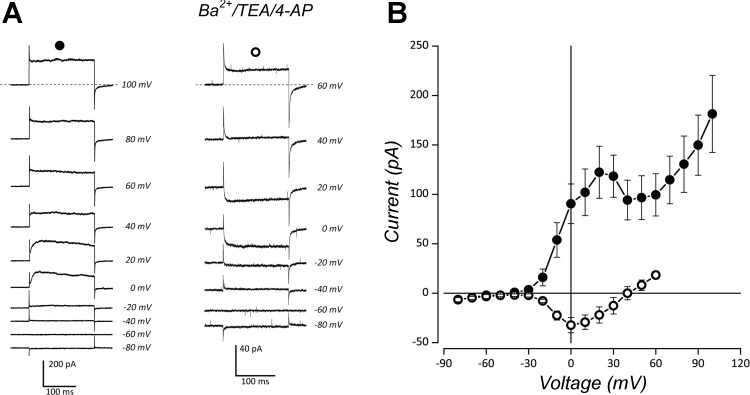
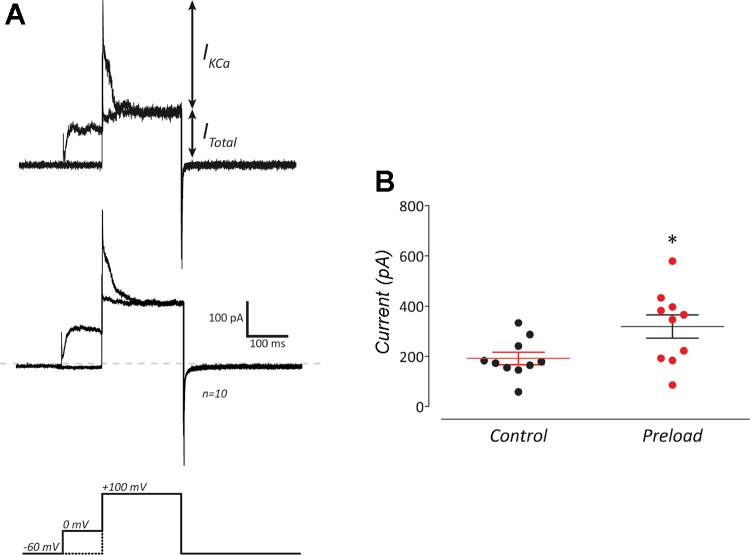
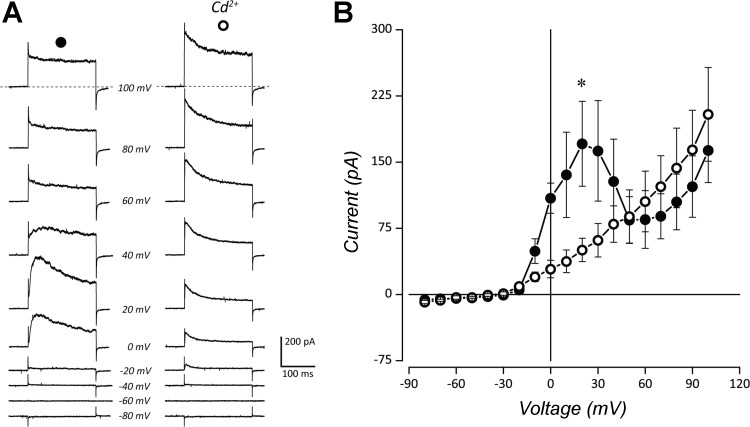
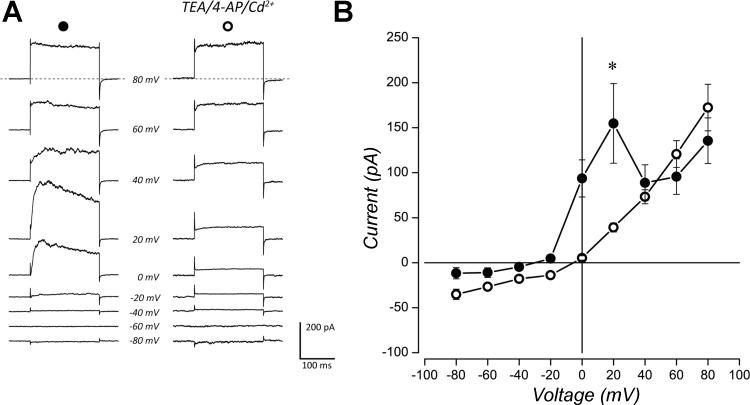
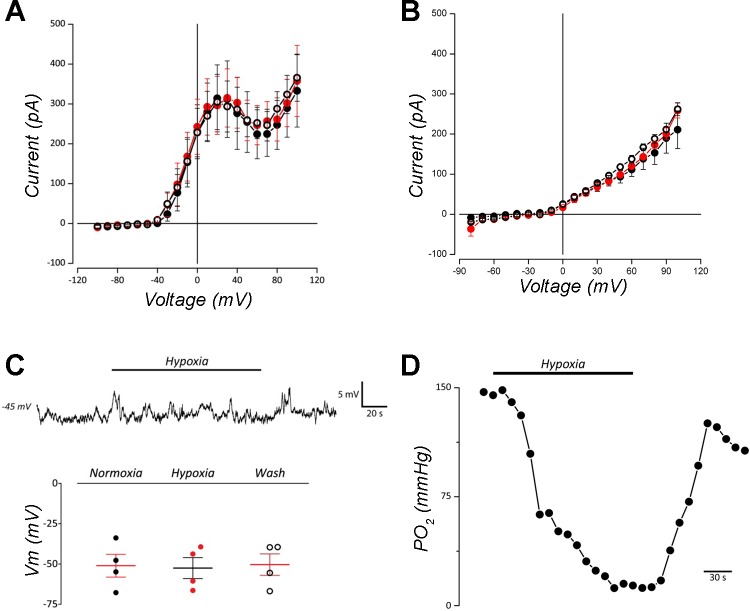
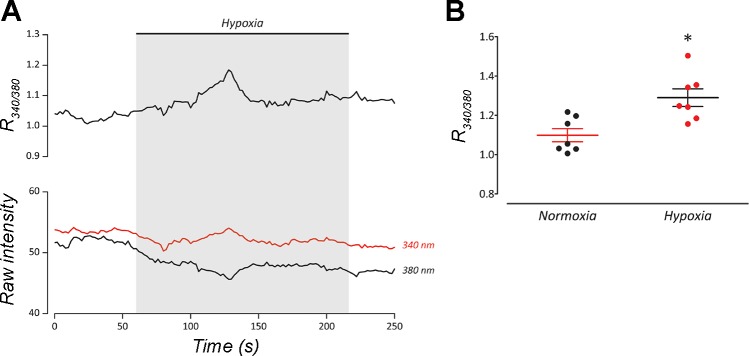
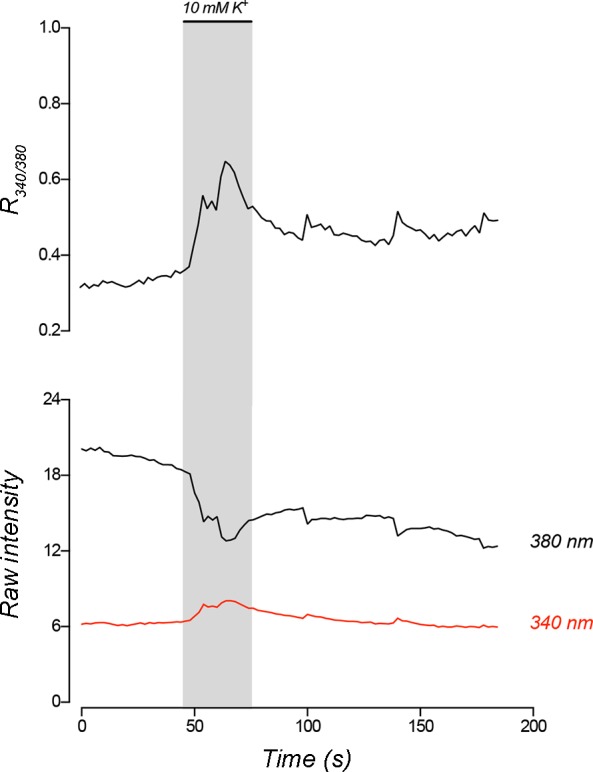
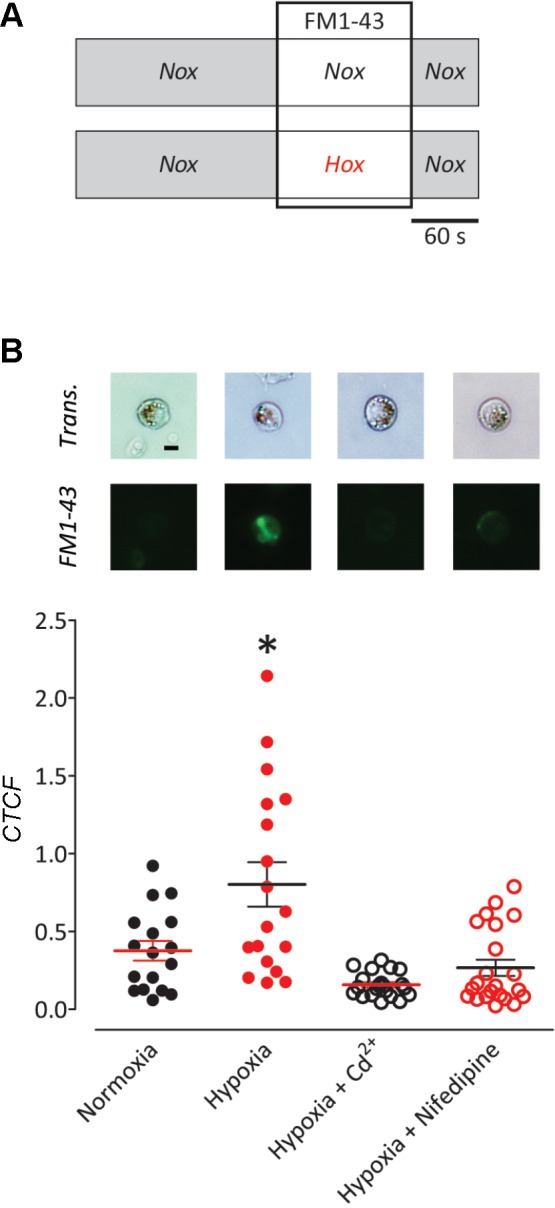
The neuroepithelial cell (NEC) of the fish gill is an important model for O2 sensing in vertebrates; however, a complete picture of the chemosensory mechanisms in NECs is lacking, and O2 chemoreception in vertebrates that are tolerant to anoxia has not yet been explored. Using whole cell patch-clamp recording, we characterized four types of ion channels in NECs isolated from the anoxia-tolerant goldfish. A Ca2+-dependent K+ current (IKCa) peaked at ~20 mV, was potentiated by increased intracellular Ca2+, and was reduced by 100 μM Cd2+ A voltage-dependent inward current in Ba2+ solution, with peak at 0 mV, confirmed the presence of Ca2+ channels. A voltage-dependent K+ current (IKV) was inhibited by 20 mM tetraethylammonium and 5 mM 4-aminopyridine, revealing a background K+ current (IKB) with open rectification. Mean resting membrane potential of -45.2 ± 11.6 mV did not change upon administration of hypoxia (Po2 = 11 mmHg), nor were any of the K+ currents sensitive to changes in Po2 during whole cell recording. By contrast, when the membrane and cytosol were left undisturbed during fura-2 or FM 1-43 imaging experiments, hypoxia increased intracellular Ca2+ concentration and initiated synaptic vesicle activity. 100 μM Cd2+ and 50 μM nifedipine eliminated uptake of FM 1-43. We conclude that Ca2+ influx via L-type Ca2+ channels is correlated with vesicular activity during hypoxic stimulation. In addition, we suggest that expression of IKCa in gill NECs is species specific and, in goldfish, may contribute to an attenuated response to acute hypoxia.NEW & NOTEWORTHY This study provides the first physiological characterization of oxygen chemoreceptors from an anoxia-tolerant vertebrate. Neuroepithelial cells (NECs) from the gills of goldfish displayed L-type Ca2+ channels and three types of K+ channels, one of which was dependent upon intracellular Ca2+ Although membrane currents were not inhibited by hypoxia during patch-clamp recording, this study is the first to show that NECs with an undisturbed cytosol responded to hypoxia with increased intracellular Ca2+ and synaptic vesicle activity.

Keywords: chemoreceptor; goldfish; hypoxia; ion channel; neuroepithelial cell.


Figures

Fig. 1.
Fig. 1.
Identification and passive membrane properties of neuroepithelial cells (NECs) isolated from the goldfish gill. A: a single NEC is shown under bright-field illumination and stained with neutral red (NR) 24 h after dissociation (upper left) and immediately after fixation (upper right). Using fluorescence microscopy, the same NEC was subsequently labeled by antibodies against serotonin (5-HT, lower left) and the synaptic vesicle protein, SV2 (lower right). Scale bar = 5 µm. B: frequency distribution of the number of cells vs. cell diameter measured from dissociated cells (n = 102) stained with NR and labeled with 5-HT and SV2, demonstrating a mean diameter of 10.2 ± 1.3 µm. C: frequency distribution of the number of cells vs. whole cell membrane capacitance (Cm, n = 108) indicated that 90% of cells were between 2 and 4 pF with a mean of 3 ± 0.9 pF. D: frequency distribution of the number of cells vs. resting membrane potential (Vm) under current-clamp (I = 0 pA, n = 65) indicated that 69% of cells had a Vm ≥ –40 mV with a mean of –45.2 ± 11.6 mV.
Fig. 2.
Fig. 2.
Whole cell currents in isolated neuroepithelial cells (NECs) indicate Ca2+-activated K+ (KCa) channels and voltage-gated Ca2+ channels. A: traces are shown from stepwise depolarization under voltage clamp, averaged from multiple cells. Traces at left (n = 6) show currents evoked in normal extracellular solution with peak conductance at 20 mV. Traces at right (n = 8) show currents evoked in solution containing 10 mM Ba2+ as a charge carrier, 20 mM TEA, and 5 mM 4-AP. Initial activation of inward current occurred at approximately –30 mV, with peak conductance at 0 mV. B: current-voltage relationships show means ± SE. Whole cell current in normal extracellular solution demonstrates that a component of outward K+ current was Ca2+-activated (IKCa; ●); and in Ba2+, TEA, and 4-AP solution demonstrating an inward current through Ca2+ channels (○).
Fig. 3.
Fig. 3.
Preloading NECs with Ca2+ induced a transient increase in current through KCa. A: upper traces were generated from the step protocol in the lower panel. The upper trace shows a recording from a single cell, while the middle trace shows the average of 10 cells. Total whole cell current (ITotal) was generated with a control step from a holding potential of –60 mV to 100 mV (lower panel, dotted line). The transient Ca2+-activated K+ current (IKCa) was evoked by preloading NECs with Ca2+ using an initial 100-ms step to 0 mV, followed immediately by a step to 100 mV (lower panel, solid line). B: preloading cells with Ca2+ resulted in a significant increase in means ± SE outward current immediately following the step to 100 mV (*P < 0.05, paired t test, n = 10).
Fig. 4.
Fig. 4.
IKCa was reduced by Cd2+. A: whole cell currents elicited by step depolarization and averaged from multiple cells (n = 4) are shown. Left: control traces in normal extracellular solution. Right: traces in solution containing 100 µM Cd2+. B: current-voltage relationship generated from step depolarizations in A are shown. Values are expressed as means ± SE. Whole cell current in normal solution (●) shows a characteristic IKCa profile. Blockade of Ca2+ channels with Cd2+ eliminated IKCa and revealed a voltage-gated K+ current (IKV) activating at approximately –30 mV (○). Current was significantly reduced at 20 mV (*P < 0.05, Wilcoxon matched-pairs test).
Fig. 5.
Fig. 5.
Expression of voltage-dependent (Kv) and voltage-independent (KB) K+ channels in goldfish NECs. A: raw current traces elicited by step depolarization and averaged from multiple cells (n = 5). Left: control traces in normal extracellular solution; right: traces in solution containing 20 mM TEA, 5 mM 4-AP, and 100 µM Cd2+. B: current-voltage relationship from traces in A are shown. Values are expressed as means ± SE. Whole cell current in normal solution (●) shows characteristic whole cell current with IKCa profile. Blocking KCa and Kv channels reveals openly rectifying background K+ current (IKB, ○), with significant reduction at 20 mV (*P < 0.05, Wilcoxon matched-pairs test).
Fig. 6.
Fig. 6.
Hypoxia did not affect whole cell current or membrane potential in goldfish NECs under voltage- or current-clamp. A: means ± SE current-voltage relationship at 10-mV intervals from –100 to 100 mV in normal extracellular solution (n = 6). B: means ± SE current-voltage relationship generated with step depolarizations in solution containing 20 mM TEA, 5 mM 4-AP, and 100 µM Cd2+ (n = 4) to isolate background K+ current (IKB). There were no differences in whole cell current between normoxia (●), hypoxia (closed red circles), and return to normoxic solution (○) in A or B (Wilcoxon matched-pairs test). C: in current-clamp recording of a single cell in normal solution, brief application of hypoxia did not elicit a change in membrane potential (Vm, upper trace). Bottom: summary of data indicating that there was no significant change in means ± SE Vm during hypoxic perfusion compared with normoxia (n = 4, Friedman multiple-comparison test). D: carbon fiber recording of changes in Po2 within the recording chamber. Po2 change was measured with time, while superfusing the chamber with N2-bubbled solution to produce hypoxia. Solution reached a Po2 of ~11 mmHg within 2 min.
Fig. 7.
Fig. 7.
Intracellular Ca2+ increased in response to hypoxia in isolated neuroepithelial cells (NECs) of goldfish. A: representative recording of a NEC responding to hypoxia by increasing intracellular Ca2+ concentration ([Ca2+]i). Upper trace shows 340/380-nm excitation ratio (R340/380) using fura-2 AM; bottom traces show raw intensities at each wavelength. B: Plot of means ± SE R340/380 indicates that [Ca2+]i rose significantly during hypoxia compared with normoxia (*P < 0.01, Wilcoxon matched-pairs test; n = 7).
Fig. 8.
Fig. 8.
High K+ solution increased intracellular Ca2+ in isolated neuroepithelial cells (NECs) of goldfish. Representative recording of a NEC responding to a 30-s application of solution containing 10 mM KCl by increasing intracellular Ca2+ concentration ([Ca2+]i). Upper trace shows 340/380 nm excitation ratio (R340/380) using fura-2 AM, while bottom traces show raw intensities at each wavelength.
Fig. 9.
Fig. 9.
Ca2+-dependent vesicular activity in isolated goldfish NECs increased in response to hypoxia. A: summary of the experimental procedure. Isolated NECs were perfused with normal extracellular solution for 3 min. Subsequently, NECs were exposed to either normoxia or hypoxia in the presence of 2 µM FM 1-43 for 2 min. Cells were then washed with normal solution for 1 min and imaged. B: images show NECs labeled with neutral red under transmitted light (Trans.) or FM 1-43 uptake by fluorescence imaging. Scale bar = 5 µm. Exposure to hypoxia (n = 19) significantly increased uptake of FM 1-43, as indicated by means ± SE corrected total cell fluorescence (CTCF) (*P < 0.05, ANOVA, Bonferroni) as compared with normoxia (n = 17). The addition of 100 µM Cd2+ (n = 21) or 50 µM nifedipine (n = 22) to the recording chamber for the duration of the experiment resulted in no significant change in dye uptake during the hypoxic exposure.

Similar articles

Cited by

References

    1. Abdallah SJ, Jonz MG, Perry SF. Extracellular H+ induces Ca2+ signals in respiratory chemoreceptors of zebrafish. Pflügers Arch 467: 399–413, 2015. doi:10.1007/s00424-014-1514-2. - DOI - PubMed
    1. Alger BE, Williamson A. A transient calcium-dependent potassium component of the epileptiform burst after-hyperpolarization in rat hippocampus. J Physiol 399: 191–205, 1988. doi:10.1113/jphysiol.1988.sp017075. - DOI - PMC - PubMed
    1. Betz WJ, Mao F, Bewick GS. Activity-dependent fluorescent staining and destaining of living vertebrate motor nerve terminals. J Neurosci 12: 363–375, 1992. - PMC - PubMed
    1. Bickler PE, Buck LT. Hypoxia tolerance in reptiles, amphibians, and fishes: life with variable oxygen availability. Annu Rev Physiol 69: 145–170, 2007. doi:10.1146/annurev.physiol.69.031905.162529. - DOI - PubMed
    1. Bright GR, Agani FH, Haque U, Overholt JL, Prabhakar NR. Heterogeneity in cytosolic calcium responses to hypoxia in carotid body cells. Brain Res 706: 297–302, 1996. doi:10.1016/0006-8993(95)01122-6. - DOI - PubMed

Publication types

MeSH terms

Substances

LinkOut - more resources