. 2017 Oct 27;91(22):e01122-17.
doi: 10.1128/JVI.01122-17. Print 2017 Nov 15.

Dose of Retroviral Infection Determines Induction of Antiviral NK Cell Responses

Affiliations

Dose of Retroviral Infection Determines Induction of Antiviral NK Cell Responses

Elisabeth Littwitz-Salomon et al. J Virol. .

Abstract

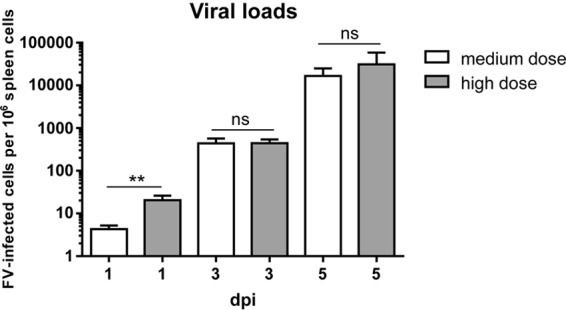
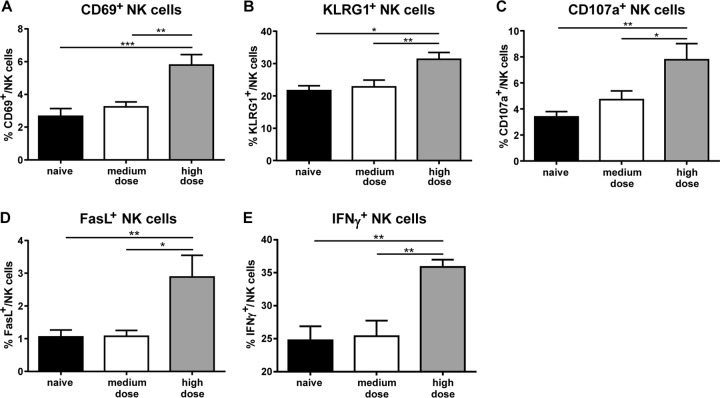
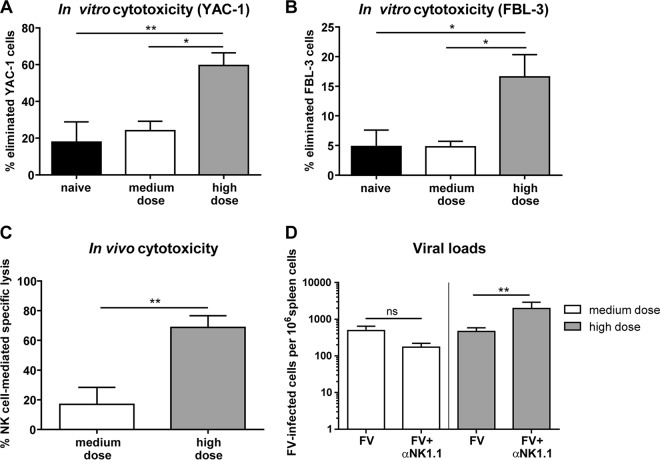
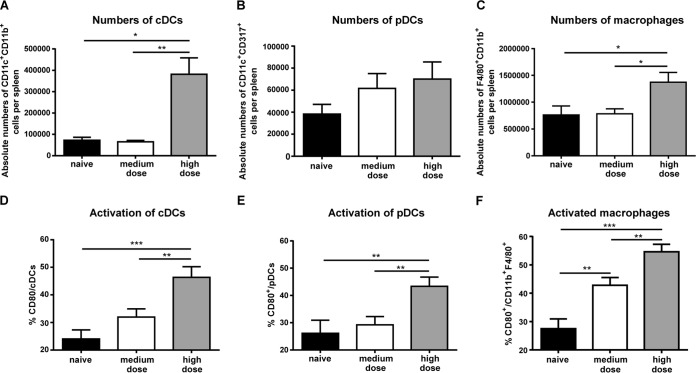
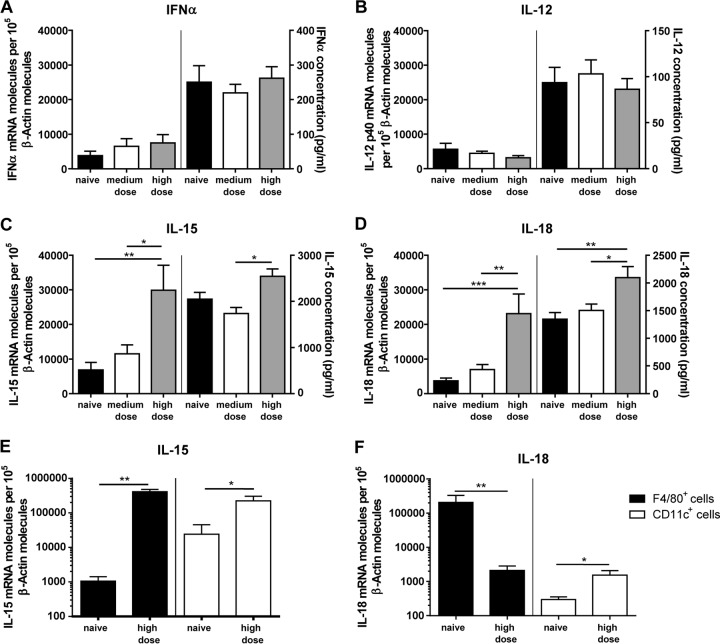
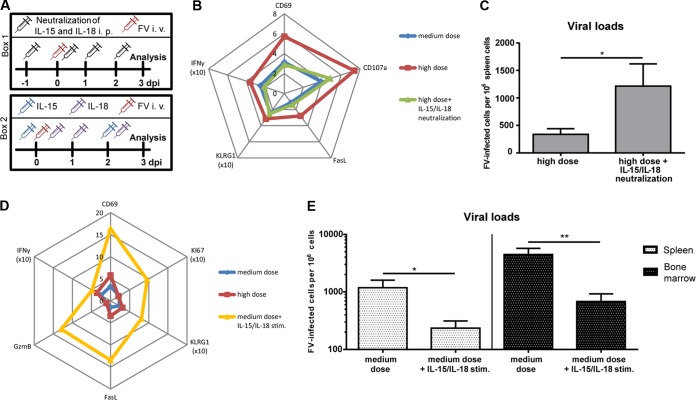
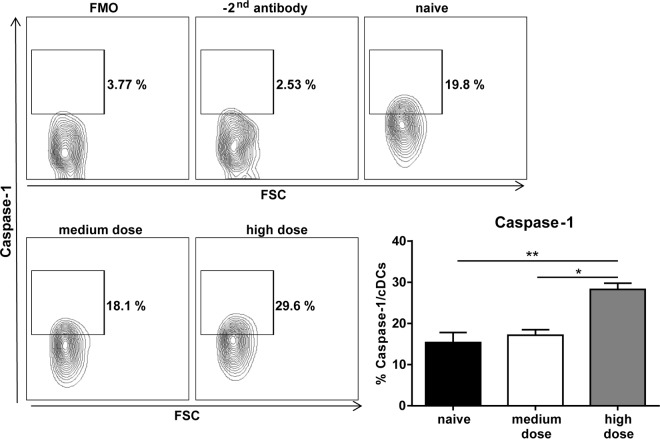
Natural killer (NK) cells are part of the innate immune system and recognize virus-infected cells as well as tumor cells. Conflicting data about the beneficial or even detrimental role of NK cells in different infectious diseases have been described previously. While the type of pathogen strongly influences NK cell functionality, less is known about how the infection dose influences the quality of a NK cell response against retroviruses. In this study, we used the well-established Friend retrovirus (FV) mouse model to investigate the impact of virus dose on the induction of antiviral NK cell functions. High-dose virus inoculation increased initial virus replication compared to that with medium- or low-dose viral challenge and significantly improved NK cell activation. Antiviral NK cell activity, including in vivo cytotoxicity toward infected target cells, was also enhanced by high-dose virus infection. NK cell activation following high-dose viral challenge was likely mediated by activated dendritic cells (DCs) and macrophages and the NK cell-stimulating cytokines interleukin 15 (IL-15) and IL-18. Neutralization of these cytokines decreased NK cell functions and increased viral loads, whereas IL-15 and IL-18 therapy improved NK cell activity. Here we demonstrate that virus dose positively correlates with antiviral NK cell activity and function, which are at least partly driven by IL-15 and IL-18. Our results suggest that NK cell activity may be therapeutically enhanced by administering IL-15 and IL-18 in virus infections that inadequately activate NK cells.IMPORTANCE In infections with retroviruses, like HIV and FV infection of mice, NK cells clearly mediate antiviral activities, but they are usually not sufficient to prevent severe pathology. Here we show that the initial infection dose impacts the induction of an antiviral NK cell response during an acute retroviral infection, which had not investigated before. High-dose infection resulted in a strong NK cell functionality, whereas no antiviral activities were detected after low- or medium-dose infection. Interestingly, DCs and macrophages were highly activated after high-dose FV challenge, which corresponded with increased levels of NK cell-stimulating cytokines IL-15 and IL-18. IL-15 and IL-18 neutralization decreased NK cell functions, whereas IL-15 and IL-18 therapy improved NK cell activity. Here we show the importance of cytokines for NK cell activation in retroviral infections; our findings suggest that immunotherapy combining the well-tolerated cytokines IL-15 and IL-18 might be an interesting approach for antiretroviral treatment.

Keywords: Friend retrovirus; antiviral activity; interleukins; natural killer cells; virus dose.


Figures

FIG 1
FIG 1
Kinetics of viral loads after medium- and high-dose FV infections. C57BL/6 mice were infected with a medium dose (20,000 SFFU) or high dose (40,000 SFFU) of FV. Viral loads were analyzed in the spleen at 1, 3, and 5 dpi by infectious-center assay. Statistically significant differences between groups were analyzed by the Mann-Whitney test (**, P < 0.01). At least four animals per group were examined. The experiments were repeated at least twice, with comparable results. ns, not significant.
FIG 2
FIG 2
Phenotype of NK cells during an acute FV infection. Splenic NK cells from naive C57BL/6 mice or mice infected with 20,000 SFFU (medium dose) or 40,000 SFFU (high dose) of FV were analyzed by flow cytometry by gating on CD3 NK1.1+ CD49b+ cells. Activation of NK cells was determined using the early activation marker CD69 (A). Maturated NK cells were identified by expression of KLRG1 (B). Effector functions were analyzed by expression of the degranulation marker CD107a (C) and FasL (D). The percentage of IFN-γ+ NK cells is shown in panel E. At least seven animals per group from at least three experiments were used for analysis. Mean values are shown, with standard errors of the means (SEM) indicated by error bars. Statistically significant differences between groups were analyzed with the Kruskal-Wallis test (A, B, and C) and ordinary one-way ANOVA (D and E) and are indicated as follows: *, P < 0.05; **, P < 0.01; and ***, P < 0.001.
FIG 3
FIG 3
Cytotoxic functions of NK cells in medium- and high-dose FV infections. C57BL/6 mice were naive or infected with a medium dose (20,000 SFFU) or high dose (40,000 SFFU) of FV. Splenic NK cells were isolated and coincubated with CFSE-labeled YAC-1 cells (A) or FV-transformed tumor cells (FBL-3 cells [B]). Cells were stained for viability and immediately analyzed using flow cytometry. For panel C, mice received 5 × 10⁵ CFSE-labeled RMA/S and 5 × 10⁵ eFluor 670 cell tracer-labeled RMA cells at 3 dpi i.p. Two days later (5 dpi), cells were obtained by peritoneal lavage and analyzed by flow cytometry. Mean values are shown, with SEM indicated by error bars. Viral loads were analyzed in the spleen at 3 dpi by IC assay (D). NK cells were depleted with the NK1.1-specific monoclonal antibody PK136 (FV+αNK1.1). Statistically significant differences between groups were analyzed by the Kruskal-Wallis test (A and B) or Mann-Whitney test (C and D) and are indicated as follows; *, P < 0.05, and **, P < 0.01. At least five animals per group were examined. The experiments were repeated at least twice, with comparable results.
FIG 4
FIG 4
Absolute numbers and activation of DCs and macrophages during an acute FV infection. C57BL/6 mice were infected with the indicated doses of FV. Uninfected mice were used as a control. Absolute numbers of cDCs (CD11c+ CD11b+ [A]), pDCs (CD11c+ CD317+ [B]), and macrophages (lin F4/80+ CD11b+ [C]) in the spleen were analyzed by flow cytometry. Activation of innate cells was identified by the expression of CD80 molecules on the cell surface (D, E, and F). At least seven animals per group from at least three experiments were used for analysis. Mean values are shown, with SEM indicated by error bars. Statistically significant differences between groups were analyzed with the Kruskal-Wallis test (A and C) or ordinary one-way ANOVA (D, E, and F) and are indicated as follows: *, P < 0.05; **, P < 0.01; and ***, P < 0.001.
FIG 5
FIG 5
mRNA expression levels and protein concentrations of IFN-α, IL-12, IL-15, and IL-18 in naive mice and medium- and high-dose-infected mice. At 3 dpi, levels of IFN-α (A), IL-12 p40 (B), IL-15 (C), and IL-18 (D) mRNA expression were analyzed in the spleens of naive C57BL/6 mice or mice infected with a medium dose (20,000 SFFU) or high dose (40,000 SFFU) via quantitative real-time PCR (left-hand side of graphs). β-Actin was used as an internal standard and was amplified from each sample for normalization of the template concentration. Samples were run in duplicate and were analyzed by ordinary one-way ANOVA. At least four animals per group from at least three experiments were used for analysis. Spleens were harvested and single cell suspensions were prepared in a total of 1 ml. Cells were centrifuged and supernatants of splenic lavages were used for ELISAs (right-hand side). At least four animals per group from at least three experiments were used for analysis. F4/80+ macrophages or CD11c+ DCs were isolated from splenocytes using magnetic beads. The levels of IL-15 (E) and IL-18 (F) mRNA expression were analyzed via quantitative real-time PCR in F4/80+ and CD11c+ cells. β-Actin was used as an internal standard and was amplified from each sample for normalization of the template concentration. Samples were run in duplicate. At least three animals per group were used for analysis. Mean values are shown, with SEM indicated by error bars. Statistically significant differences between groups were analyzed with ordinary one-way ANOVA (A, C, and D), the Kruskal-Wallis test (B), or the Mann-Whitney test (E and F) and are indicated as follows: *, P < 0.05; **, P < 0.01; and ***, P < 0.001. Outliers were identified and removed with the Rout method.
FIG 6
FIG 6
Effects of IL-15 and IL-18 on NK cell functions and viral loads. C57BL/6 mice were infected with 20,000 SFFU (medium dose) or 40,000 SFFU (high dose) of FV at day 0. For neutralization of IL-15 and IL-18, mice were treated as displayed in panel A, box 1. Therapy with IL-15 and IL-18 was performed as indicated in panel A, box 2. A spider plot from mean percentages of NK cell activation (CD69 [P = 0.0135]), maturation (KLRG1 [P = 0.0476]), degranulation (CD107a [P = 0.0156]), and FasL (P = 0.0303) and IFN-γ (P = 0.0001) expression in infected mice (medium and high doses) and high-dose-infected mice with neutralization of IL-15 and IL-18 is shown in panel B. Viral loads of mice infected with 40,000 SFFU and with cytokine neutralization were analyzed by IC assay. At least four animals per group from two experiments were used for the analysis. Mean values are shown, with SEM indicated by error bars. Statistically significant differences between groups were analyzed by the Mann-Whitney test (*, P < 0.05). A spider plot of NK cell activation (CD69 [P = 0.0001]) and functions (FasL [P = 0.0003], granzyme B [P = 0.0061], and IFN-γ [P = 0.0001]) as well as maturation (KLRG1 [P = 0.0001]) and proliferation (KI67 [P = 0.0061]) after IL-15 and IL-18 therapy is shown in panel D. At least six animals per group from two independent experiments were used. Statistically significant differences between the group of medium-dose-infected mice and medium-dose-infected and cytokine-treated mice were analyzed by theMann-Whitney test. Viral loads in spleens and the bone marrow of medium-dose-infected and medium-dose-infected and IL-15- and IL-18-treated mice are displayed in panel E. At least six animals per group from two independent experiments were used. Statistically significant differences between groups were analyzed by the Mann-Whitney test and are indicated as follows: *, P < 0.05, and **, P < 0.01.
FIG 7
FIG 7
Caspase 1 activity in cDCs. C57BL/6 mice were infected with 20,000 SFFU (medium dose) or 40,000 SFFU (high dose) of FV. Naive mice were used as a control. Caspase 1 activity was analyzed in cDCs using flow cytometry. At least five animals per group from at least three experiments were used for the analysis. Mean values are shown, with SEM indicated by error bars. Statistically significant differences between groups were analyzed by the Kruskal-Wallis test and are indicated as follows: *, P < 0.05, and **, P < 0.01. FMO, fluorescence minus one; FSC, forward scatter.

Similar articles

Cited by

References

    1. Biassoni R. 2008. Natural killer cell receptors. Adv Exp Med Biol 640:35–52. doi:10.1007/978-0-387-09789-3_4. - DOI - PubMed
    1. Lodoen MB, Lanier LL. 2005. Viral modulation of NK cell immunity. Nat Rev Microbiol 3:59–69. doi:10.1038/nrmicro1066. - DOI - PubMed
    1. Kärre K, Ljunggren HG, Piontek G, Kiessling R. 1986. Selective rejection of H-2-deficient lymphoma variants suggests alternative immune defence strategy. Nature 319:675–678. doi:10.1038/319675a0. - DOI - PubMed
    1. Yokoyama WM, Plougastel BFM. 2003. Immune functions encoded by the natural killer gene complex. Nat Rev Immunol 3:304–316. doi:10.1038/nri1055. - DOI - PubMed
    1. Biron CA, Nguyen KB, Pien GC, Cousens LP, Salazar-Mather TP. 1999. Natural killer cells in antiviral defense: function and regulation by innate cytokines. Annu Rev Immunol 17:189–220. doi:10.1146/annurev.immunol.17.1.189. - DOI - PubMed

Publication types

MeSH terms

LinkOut - more resources