. 2017 Nov 1;28(22):3095-3111.
doi: 10.1091/mbc.E17-06-0421. Epub 2017 Sep 13.

A disease-associated frameshift mutation in caveolin-1 disrupts caveolae formation and function through introduction of a de novo ER retention signal

Affiliations

A disease-associated frameshift mutation in caveolin-1 disrupts caveolae formation and function through introduction of a de novo ER retention signal

Courtney A Copeland et al. Mol Biol Cell. .

Abstract

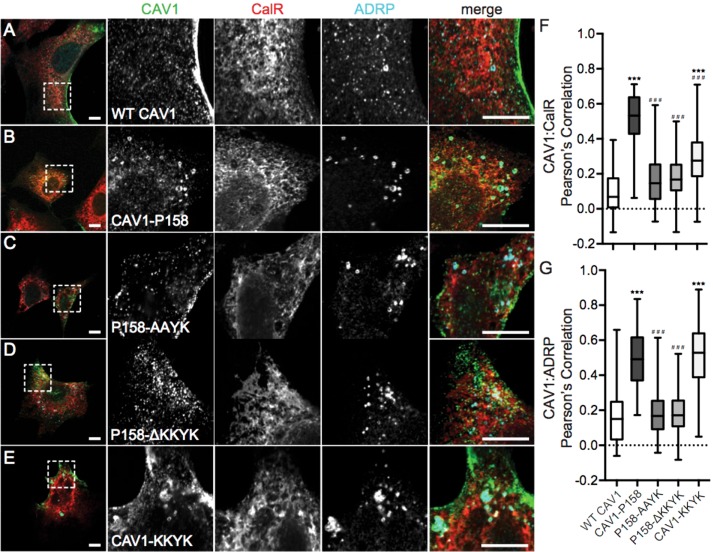
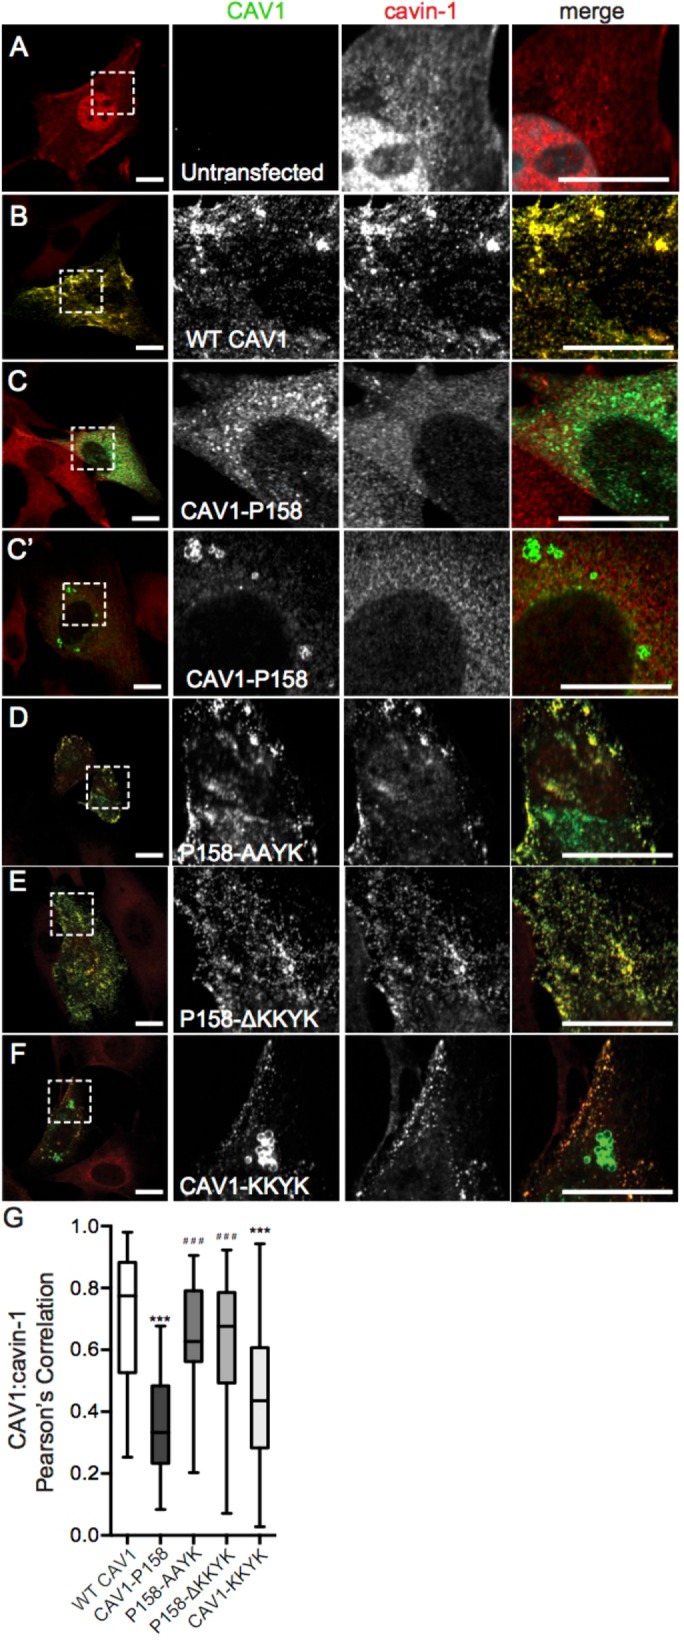
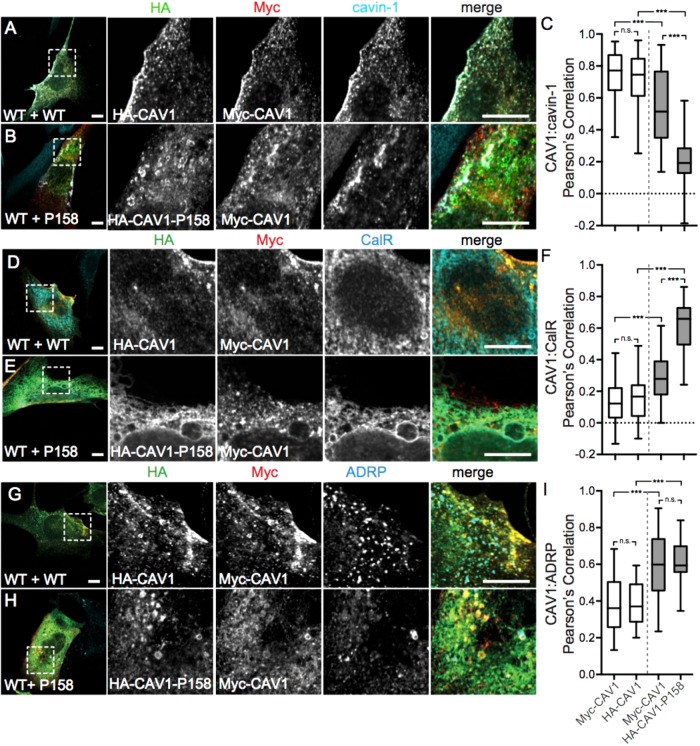
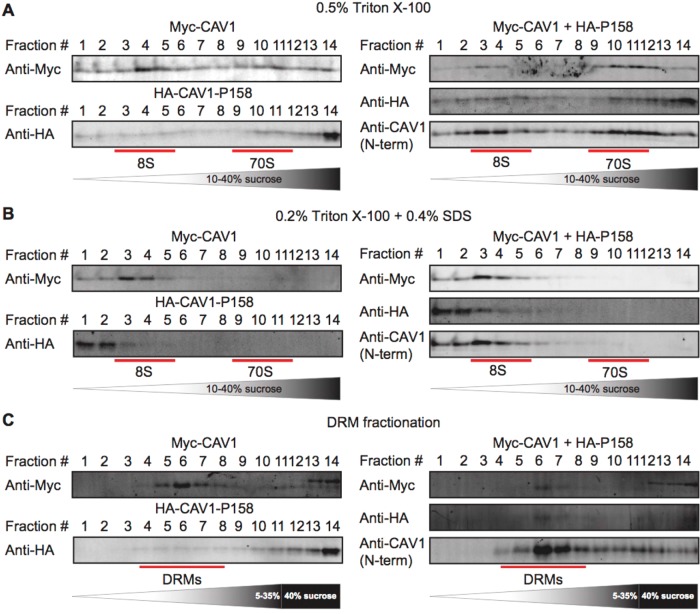
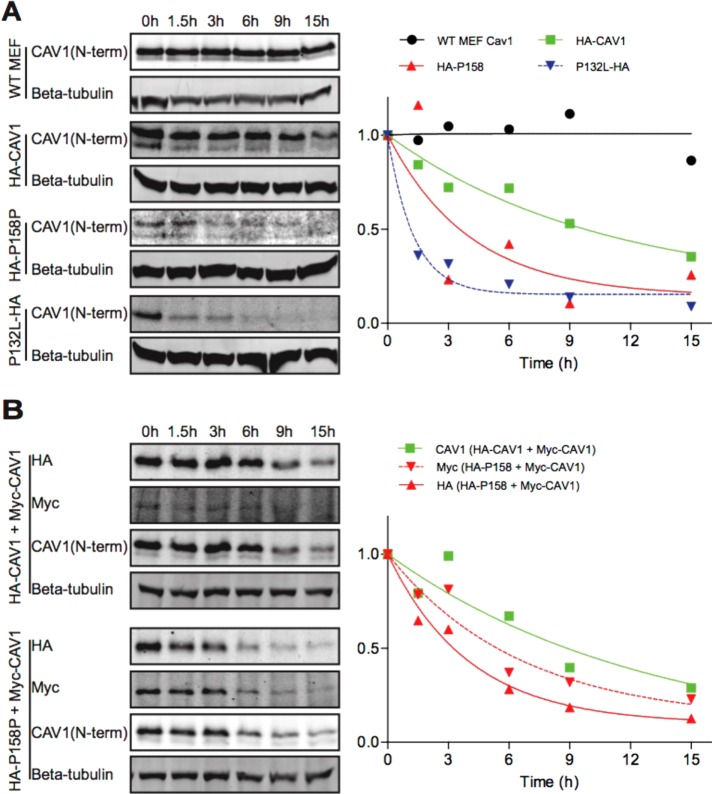
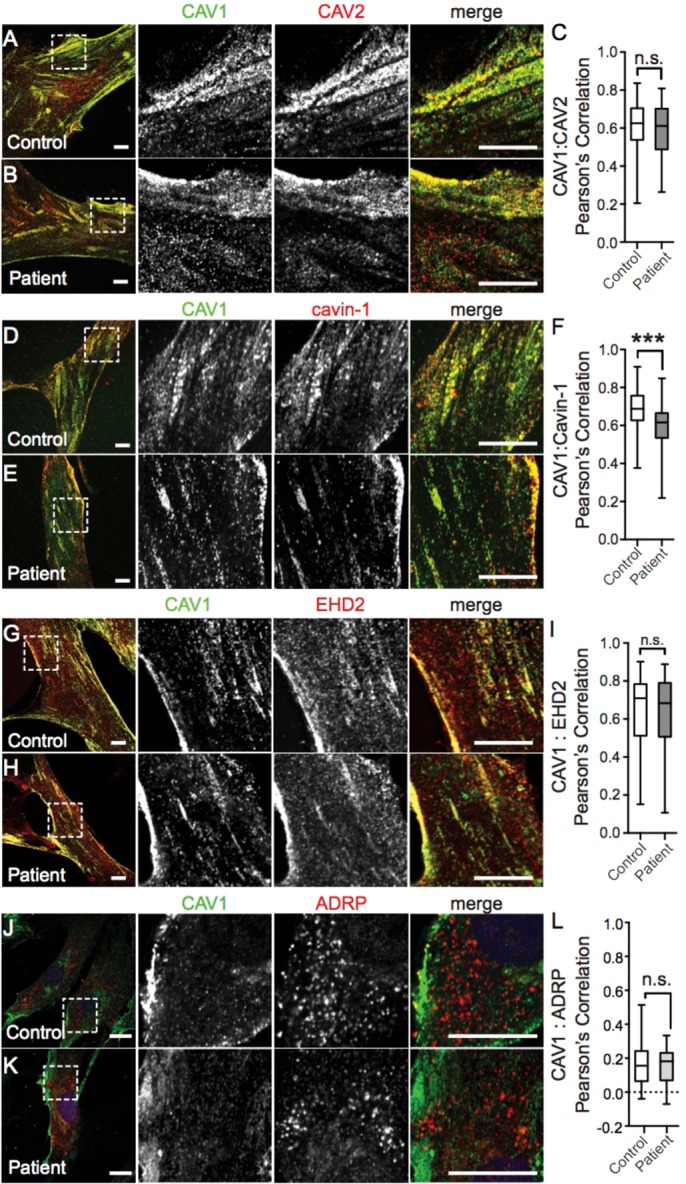
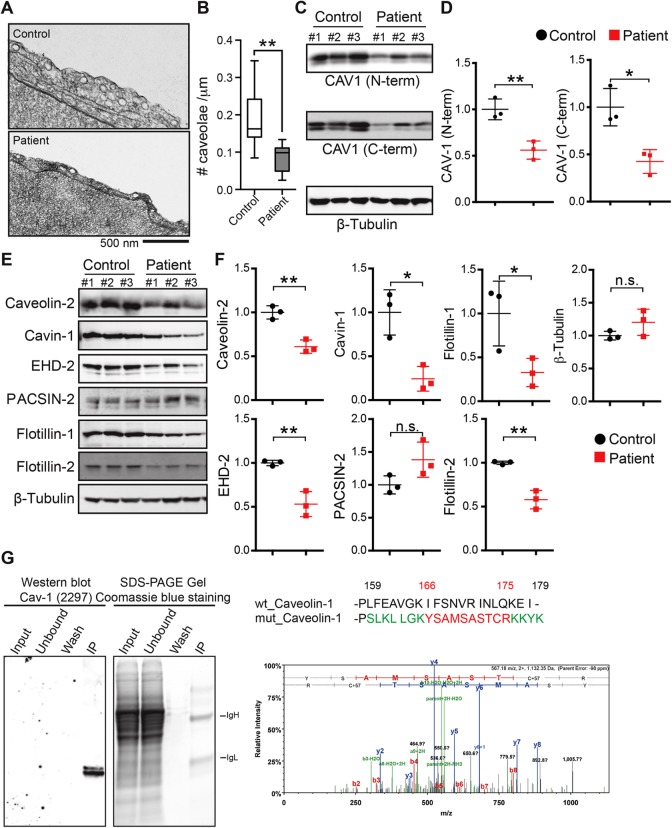
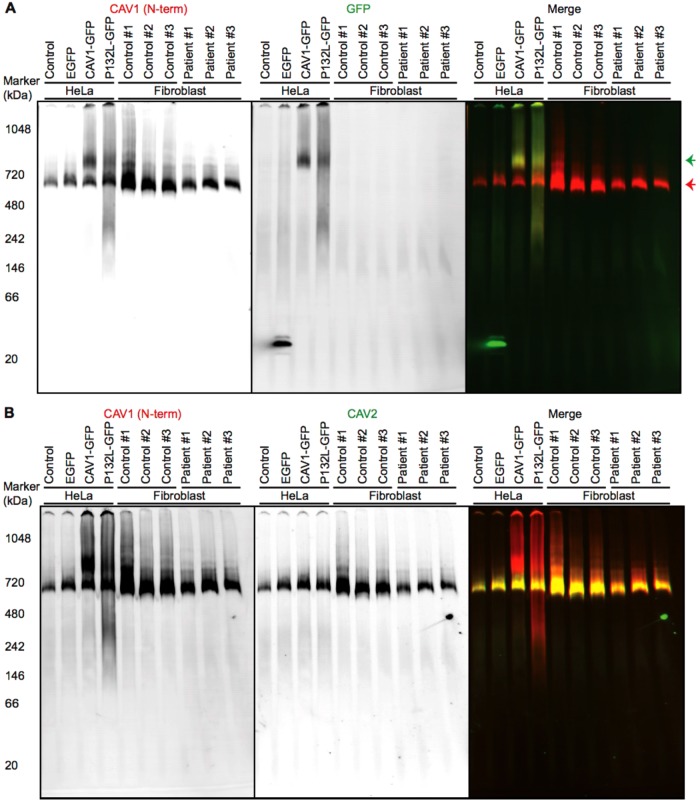
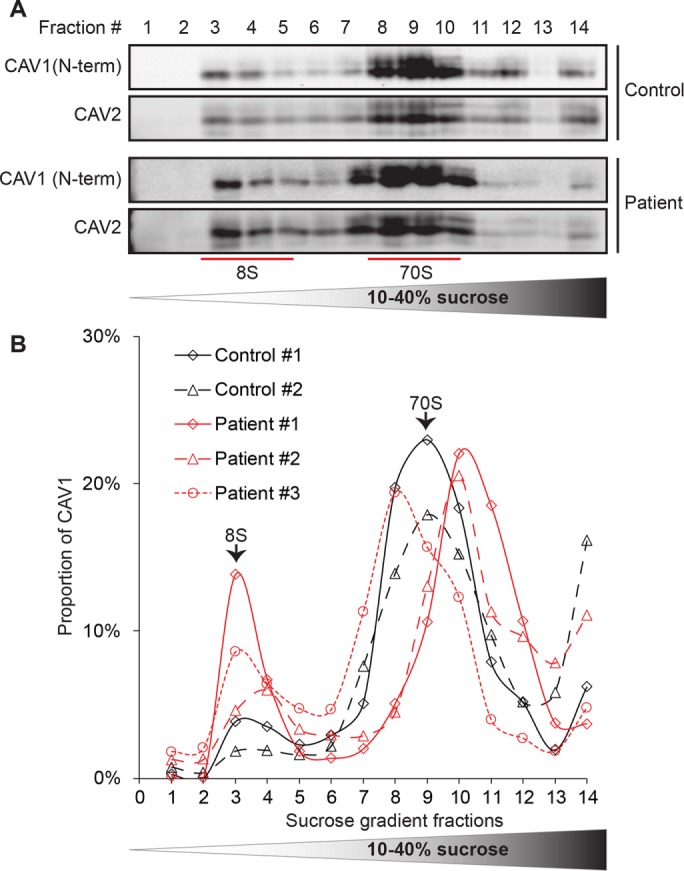
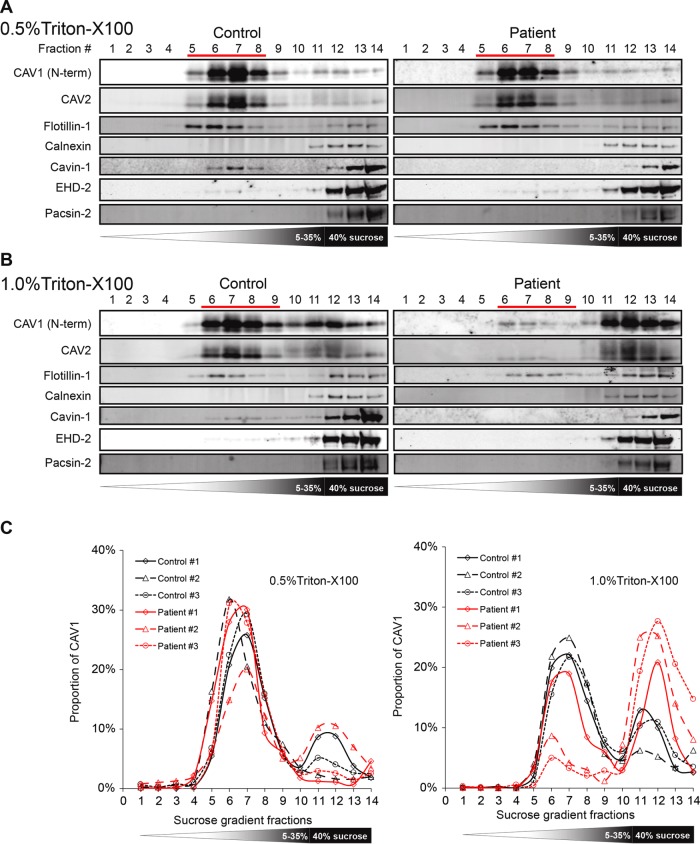
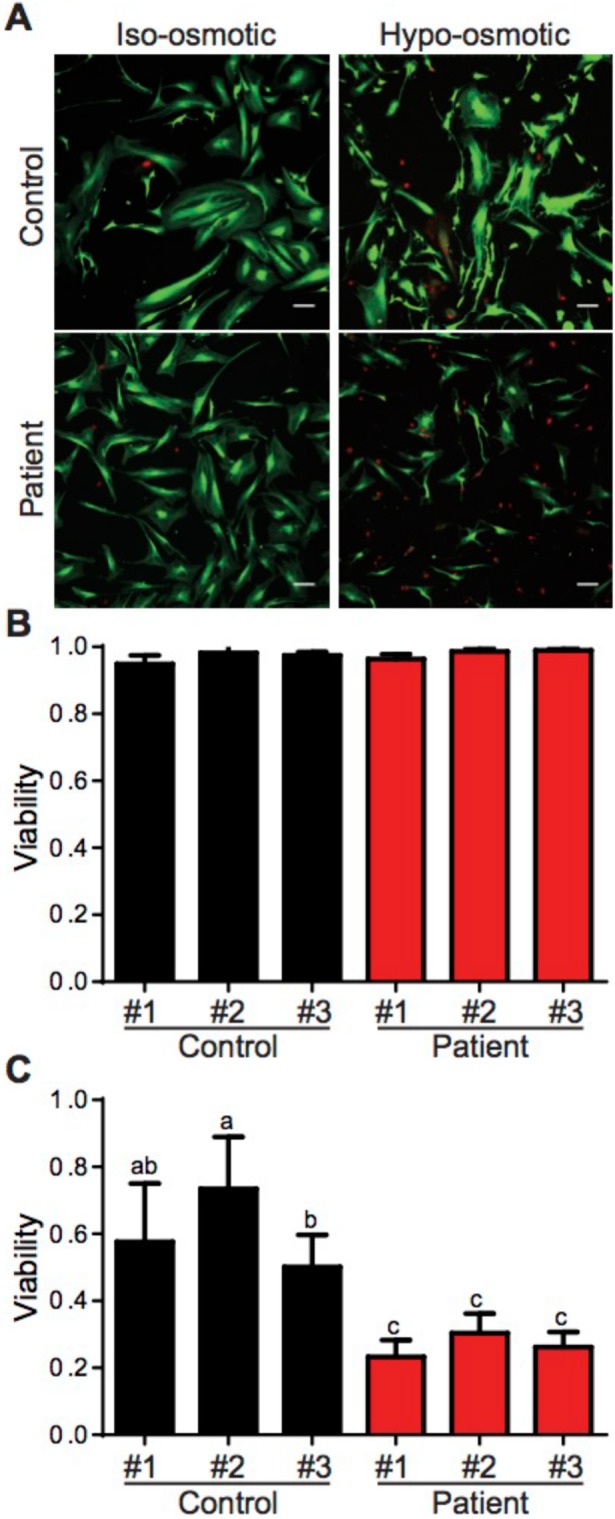
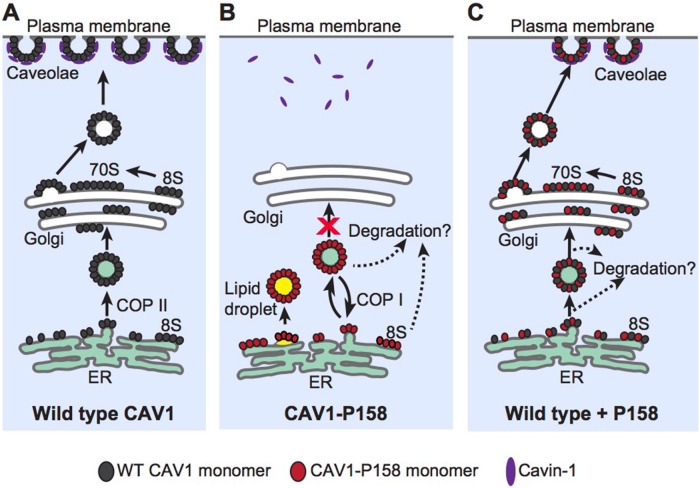
Caveolin-1 (CAV1) is an essential component of caveolae and is implicated in numerous physiological processes. Recent studies have identified heterozygous mutations in the CAV1 gene in patients with pulmonary arterial hypertension (PAH), but the mechanisms by which these mutations impact caveolae assembly and contribute to disease remain unclear. To address this question, we examined the consequences of a familial PAH-associated frameshift mutation in CAV1, P158PfsX22, on caveolae assembly and function. We show that C-terminus of the CAV1 P158 protein contains a functional ER-retention signal that inhibits ER exit and caveolae formation and accelerates CAV1 turnover in Cav1-/- MEFs. Moreover, when coexpressed with wild-type (WT) CAV1 in Cav1-/- MEFs, CAV1-P158 functions as a dominant negative by partially disrupting WT CAV1 trafficking. In patient skin fibroblasts, CAV1 and caveolar accessory protein levels are reduced, fewer caveolae are observed, and CAV1 complexes exhibit biochemical abnormalities. Patient fibroblasts also exhibit decreased resistance to a hypo-osmotic challenge, suggesting the function of caveolae as membrane reservoir is compromised. We conclude that the P158PfsX22 frameshift introduces a gain of function that gives rise to a dominant negative form of CAV1, defining a new mechanism by which disease-associated mutations in CAV1 impair caveolae assembly.


Figures

FIGURE 1:
FIGURE 1:
CAV1 P158 is targeted to the ER and lipid droplets as the result of the introduction of a functional ER retention signal by the frameshift mutation. (A–E) Immunofluorescence staining of WT CAV1, CAV1-P158, CAV1-P158-AAYK, CAV1-P158-ΔKKYK, and CAV1-KKYK (green) expressed in Cav1–/– MEFs. Cells were colabeled with the ER marker calreticulin (CalR, red) and the lipid droplet marker ADRP (cyan). The dashed box indicates the region shown in the zooms. Scale bars = 10 μm. (F, G) Quantification of the extent of colocalization between CAV1 constructs with CalR or ADRP, respectively, calculated by Pearson’s correlation. The data were analyzed with a nonparametric Kluskal–Wallis test and post hoc Dunn’s multiple comparisons test to calculate p values. Data are averaged over three independent experiments for the following numbers of regions of interest (ROIs): Calreticulin/WT CAV1, n = 33; calreticulin/CAV1-P158, n = 30; calreticulin/CAV1-P158-AAYK, n = 52; calreticulin/CAV1-P158-ΔKKYK, n = 43; calreticulin/CAV1-KKYK, n = 40; ADRP/WT CAV1, n = 85; ADRP/CAV1-P158, n = 73; ADRP/CAV1-P158-AAYK, n = 104; ADRP/CAV1-P158-ΔKKYK, n = 107; and ADRP/CAV1-KKYK, n = 114. Asterisks (*) and hashtags (#) indicate statistically significant differences compared with wild-type CAV1 and CAV1-P158, respectively. ***/###, p < 0.001.
FIGURE 2:
FIGURE 2:
Disruption of the KKYK motif of CAV1-P158 enables the protein to traffic to caveolae. (A) Endogenous cavin-1 immunofluorescence in Cav1–/– MEFs costained with a CAV1 antibody. Note the diffuse distribution of cavin-1 in the absence of Cav1 expression. (B–F) Endogenous cavin-1 immunofluorescence in transfected Cav1–/– MEFs. (B) WT CAV1 colocalizes with endogenous cavin-1 in Cav1–/– MEFs. (C, C′) CAV1-P158 fails to colocalize with cavin-1 and is instead distributed in a diffuse/reticular pattern (C) and/or localizes to vesicular structures with open lumens (C′). (D) CAV1-P158-AAYK colocalizes with cavin-1. (E) CAV1-P158Δ-KKYK also colocalizes with cavin-1. (F) CAV1-KKYK partially colocalizes with cavin-1 but is also found in lipid droplets and/or the ER (also see Figure 1). (G) Quantification of the extent of colocalization between cavin-1 and CAV1 constructs as calculated by Pearson’s correlation. Data are averaged over two to three independent experiments for the following numbers of ROIs: WT CAV1, n = 38; CAV1-P158, n = 40; CAV1-P158-AAYK, n = 52; CAV1-P158Δ-KKYK, n = 46; and CAV1-KKYK, n = 52. Kluskal–Wallis nonparametric ANOVA and a post hoc Dunn’s multiple comparisons test were performed to determine p values. Asterisks (*) and hashtags (#) indicate statistically significant differences compared with wild-type CAV1 and CAV1-P158, respectively. ***/###, p < 0.001. Scale bars = 10 μm.
FIGURE 3:
FIGURE 3:
Coexpressed WT CAV1 and CAV1-P158 partially colocalize in the ER and lipid droplets. Cav1–/– MEFs coexpressing wild-type CAV1 constructs (WT+WT, white bars in graphs) or wild-type and mutant constructs (WT+P158, gray bars in graphs) were costained with cavin-1 (A, B), calreticulin (D, E), or ADRP (G, H). WT HA-CAV1 or HA-CAV1-P158 staining is shown in green, WT Myc-CAV1 staining is red, and endogenous cavin-1, calreticulin, or ADRP staining is shown in cyan. Scale bars, 10 μm. (C, F, I) Quantification of the extent of colocalization between the indicated CAV1 constructs and cavin-1, calreticulin, or ADRP as calculated by Pearson’s correlation. Data were averaged over two to three independent experiments for the following numbers of cells: cavin-1, 114 WT/WT and 30/44 WT/P158 cells; CalR, 40 WT/WT and 39 WT/P158 cells; ADRP, 18 WT/WT and 26 WT/P158 cells. Ordinary one-way ANOVA and post hoc Bonferroni’s multiple comparisons test were performed to determine p values. n.s., not significant; ***, p < 0.001. Scale bars = 10 μm.
FIGURE 4:
FIGURE 4:
CAV1-P158 partially cofractionates with WT CAV1 in coexpressing cells. (A, B) Cav1–/– MEFs transfected with WT CAV1, P158-CAV1, or WT CAV1 + P158-CAV1 were lysed in either (A) 0.5% TX-100 or (B) 0.2% TX-100 + 0.4% SDS at room temperature. Extracts were run through 10–40% sucrose velocity gradients, and fractions were analyzed by SDS–PAGE/Western blot. The positions of the 8S and 70S complexes for WT CAV1 are indicated. (C) DRM analysis of Cav1–/– MEFs expressing WT CAV1, CAV1-P158, or WT CAV1 + CAV1-P158. The position of the DRM fractions is indicated. For the cotransfected cells, blotting was performed for each construct individually using tag-specific antibodies as well as using a Cav1 antibody to facilitate comparison with results for patient fibroblasts, where we could not differentiate between the WT and mutant protein (see below). The higher-molecular-weight bands detected by the myc antibody in fractions 12–14 in C were not observed when the blots were probed with an anti-caveolin antibody and thus likely represent cross-reaction to an unknown antigen. Data are representative of two independent experiments.
FIGURE 5:
FIGURE 5:
CAV1-P158 has a shortened half compared with WT CAV1 in reconstituted Cav1–/– MEFs. (A) Untransfected Cav1+/+ MEFs (“WT MEF”) or Cav1–/– MEFs transiently transfected with WT CAV1, CAV1-P158, or CAV1-P132L were incubated in the continuous presence of 100 μg/ml CHX and samples were collected at the indicated timepoints. Whole-cell lysates were analyzed by SDS–PAGE/Western blot. Densitometry was performed on blots probed with an anti-Cav1 antibody to determine the levels of endogenous or transfected CAV1 at each sampling time. (B) As in A, except Cav1–/– MEFs were cotransfected with either WT CAV1+WT CAV1 or WT CAV1+CAV1-P158. Densitometry was performed on blots probed with an anti-Cav1 antibody for cells cotransfected with WT CAV1 + WT CAV1. For cells cotransfected with HA-P158 + WT Myc-CAV1, densitometry was performed on blots probed with a myc or HA antibody. We note that in cells cotransfected with HA-CAV1 and Myc-CAV1, HA-CAV1 appeared to be preferentially expressed for unknown reasons. Blots and densitometry results are representative of two independent experiments.
FIGURE 6:
FIGURE 6:
The subcellular distribution of CAV1 and caveolaer accessory proteins is normal in patient skin fibroblasts. Representative immunofluorescence images of control and patient skin fibroblasts costained for CAV1 and CAV2 (A, B), Cavin-1 (D, E), EHD2 (G, H), or ARDP (J, K). In the merged images, CAV1 fluorescence is shown in green. Scale bars, 10 μm. (C, F, I, L) Quantification of the extent of colocalization of CAV1 and the indicated proteins using Pearson’s correlation coefficient. p values were calculated with a nonparametric two-tailed Mann–Whitney U test. Data are representative of two to three independent experiments for three control and three patient cell lines. n.s., not significant; ***, p < 0.001. The numbers of cells analyzed are as follows: CAV1/CAV2, 46 control and 46 patient cells; CAV1/Cavin-1 54 control and 61 patient cells; CAV1/EHD2 96 control and 93 patient cells; CAV1/ADRP, 41 control and 64 patient cells.
FIGURE 7:
FIGURE 7:
The density of caveolae and caveolar protein levels are reduced in patient cells expressing CAV1-P158. (A) Cropped electron micrographs of control (top panel) and patient (bottom panel) skin fibroblasts. Images were acquired at 30,000× magnification. For purposes of illustration, the density of caveolae in these images is higher than the average values quantified in B. Scale bar, 500 nm. (B) Quantification of number of caveolae per micrometer of plasma membrane in patient and control fibroblasts. Caveolae were counted in 25 images each from three patients and three control cell lines in two independent experimental replicates and one experiment for one control and one patient cell line. **, p < 0.007, nonparametric Mann–Whitney U test. (C, D) Representative Western blots and densitometry analysis of CAV1 in control and patient fibroblasts as detected using N-term and C-term specific antibodies. b-Tubulin was blotted as a loading control. Densitometry data were averaged over three control and patient cell lines and the mean ± SD are indicated. *, p < 0.05, **, p < 0.01, Student’s t test. Data are representative of three independent experiments. (E, F) Representative Western blots and densitometry analysis of caveolar accessory proteins in control and patient skin fibroblasts. β-tubulin was blotted as a loading control. Densitometry data were averaged of three control and patient cell lines. n.s., not significant; *, p < 0.05, **, p < 0.01, Student’s t test. Data are representative of three independent experiments. (G) Tandem mass spectrometry was used to determine if CAV1-P158 protein is expressed in patient fibroblasts. CAV1 protein was immunoprecipitated using CAV1 N-term from lysates of a patient fibroblast cell line, separated by SDS–PAGE, and Coomassie stained. Immunoprecipitated CAV1 was also detected in immunoblots with an anti-CAV1 mAb 2297. The region of the SDS–PAGE gel that corresponded to the position of the CAV1 band in the immunoblot was excised and analyzed by mass spectrometry. Unique peptides of the novel C-terminus of CAV1-P158 were detected in patient cells.
FIGURE 8:
FIGURE 8:
CAV1 incorporates correctly into CAV1/CAV2 hetero-oligomers in patient fibroblasts as assessed by BN–PAGE. Control and patient skin fibroblasts were subjected to BN–PAGE and blotted for the indicated proteins. Untransfected HeLa cells and HeLa cells transiently expressing EGFP, CAV1-GFP, or P132L-GFP were used as controls. Equal amounts of protein were loaded in each lane. (A) Western blots from BN–PAGE were blotted using CAV1 N-term (red in merge) or an anti-GFP antibody (green in merge). The red arrow indicates the position of complexes containing endogenous CAV1, and the green arrow shows complexes containing CAV1-GFP or P132L-GFP. Data are representative of at least three independent experiments. (B) As in A except blots were probed using CAV1 N-term (red in merge) and an antibody against CAV2 (green in merge). Note the strong overlap between CAV1 and CAV2 signals in the merged image. Data are representative of at least two independent experiments.
FIGURE 9:
FIGURE 9:
CAV1 associates normally with 8S and 70S complexes in patient fibroblasts. (A) Extracts prepared from control and patient fibroblasts were run through 10–40% sucrose velocity gradients and the resulting fractions analyzed by Western blot for CAV1 and CAV2. Both CAV1 and CAV2 associated with 8S and 70S oligomeric species in both control and patient cells. For each fraction, 10 μl of sample was loaded. Blots are shown for control cell line #1 and patient cell line #3. (B) Quantification of CAV1 levels for individual control (black lines) and patient (red lines) cell lines. Note that all three patient cells lines contained slightly larger amounts of 8S complexes than were seen in control cells. The broad range in sedimentation of the larger complex in patient cells is most likely due to technical variations between experiments rather than biological variability, as the fractions were collected by hand. Data are representative of one to two independent experiments per cell line.
FIGURE 10:
FIGURE 10:
Caveolae of patient fibroblasts display decreased detergent resistance. Detergent-resistant membranes (DRMs) were isolated from control and patient fibroblasts extracted using either 0.5% or 1% of cold TX-100. (A, B) Western blots of fractions from sucrose density gradients. Ten microliters of each fraction/sample was loaded, and fractions were probed with antibodies against the indicated proteins. Fraction 1 is the top of the gradient, and fraction 14 is the bottom. Fractions corresponding to DRM fractions are indicated with red lines. Note the marked decrease in levels of CAV1 in DRMs in patient cells extracted in 1.0% TX-100 relative to control cells. (C) Quantification of Western blots in A and B by densitometry. Patient cell lines are shown in red and control cells in black. Data in A and B are shown for a single control and single patient cell line and are representative of individual experiments carried out for each of the three patient and three control cell lines. All proteins were assessed for all six cell lines except for the following: for 0.5% TX-100 samples, Pacsin-2 data were collected for only one control and one patient cell line, and for 1.0% TX-100 data, CAV2 data were collected for only one control and one patient cell line.
FIGURE 11:
FIGURE 11:
Patient fibroblasts demonstrate increased susceptibility to hypo-osmotic stress challenge. (A) Representative images of control and patient fibroblasts before and after 10 min of hypo-osmotic challenge. Live cells are shown in green and dead cells are red. Bar, 10 μm. (B, C) Quantification of cell viability under (B) control and (C) hypo-osmotic challenge conditions. Data represent the mean ± SD of at least four independent experiments in which at least nine fields of cells were analyzed for each cell line. Results for control cell lines are shown in black and in red for patient cell lines. One-way ANOVA was used for statistical analysis. Any two means that do not share the same letter were significantly different after running the ANOVA.
FIGURE 12:
FIGURE 12:
Proposed model of CAV1-P158 trafficking in the absence or presence of WT CAV1. (A) In control cells, newly synthesized WT CAV1 forms 8S complexes and efficiently exits the ER. It is subsequently transported from the Golgi complex to the plasma membrane in the form of 70S complexes where it recruits cavin1 and forms caveolae. (For simplicity, other accessory proteins are not shown.) (B) Unlike WT CAV1, CAV1-P158 is incapable of supporting caveolae formation when expressed on its own due to the introduction of an ER retention signal by the frameshift mutation. Instead, it is retained in the ER and lipid droplets where it can also be targeted for degradation. (C) Coexpression of WT CAV1 and CAV1 P158 results in the formation of hybrid complexes of the two proteins. These hybrid complexes have at least two possible fates. A fraction of the hybrid complexes go on to form 8S and 70S complexes and are targeted to the cell surface where they form hybrid caveolae. These hybrid caveolae are apparently morphologically normal but are less detergent resistant than WT caveolae. A second fraction of hybrid complexes are unable to exit the ER and/or are rapidly degraded, thus decreasing overall CAV1 expression levels. What determines whether the hybrid WT/ P158 complexes ultimately reach the cell surface or are retained in the ER/degraded is unknown but is likely to reflect the relative ratio of WT and mutant CAV1 within a given complex.

Similar articles

Cited by

References

    1. Ariotti N, Parton RG. SnapShot: caveolae, caveolins, and cavins. Cell. 2013;154:704–704 e701. - PubMed
    1. Austin ED, Loyd JE. The genetics of pulmonary arterial hypertension. Circ Res. 2014;115:189–202. - PMC - PubMed
    1. Austin ED, Ma L, LeDuc C, Berman Rosenzweig E, Borczuk A, Phillips JA 3rd, Palomero T, Sumazin P, Kim HR, Talati MH, et al. Whole exome sequencing to identify a novel gene (caveolin-1) associated with human pulmonary arterial hypertension. Circ Cardiovasc Genet. 2012;5:336–343. - PMC - PubMed
    1. Bakhshi FR, Mao M, Shajahan AN, Piegeler T, Chen Z, Chernaya O, Sharma T, Elliott WM, Szulcek R, Bogaard HJ, et al. Nitrosation-dependent caveolin 1 phosphorylation, ubiquitination, and degradation and its association with idiopathic pulmonary arterial hypertension. Pulm Circ. 2013;3:816–830. - PMC - PubMed
    1. Busija AR, Patel HH, Insel PA. Caveolins and cavins in the trafficking, maturation, and degradation of caveolae: implications for cell physiology. Am J Physiol Cell Physiol. 2017;312:C459–C477. - PMC - PubMed

LinkOut - more resources