. 2017 Sep 13;7(1):11496.
doi: 10.1038/s41598-017-10675-6.

Toxoplasma Modulates Signature Pathways of Human Epilepsy, Neurodegeneration & Cancer

Affiliations

Toxoplasma Modulates Signature Pathways of Human Epilepsy, Neurodegeneration & Cancer

Huân M Ngô et al. Sci Rep. .

Erratum in

  • Publisher Correction: Toxoplasma Modulates Signature Pathways of Human Epilepsy, Neurodegeneration & Cancer.
    Ngô HM, Zhou Y, Lorenzi H, Wang K, Kim TK, Zhou Y, El Bissati K, Mui E, Fraczek L, Rajagopala SV, Roberts CW, Henriquez FL, Montpetit A, Blackwell JM, Jamieson SE, Wheeler K, Begeman IJ, Naranjo-Galvis C, Alliey-Rodriguez N, Davis RG, Soroceanu L, Cobbs C, Steindler DA, Boyer K, Noble AG, Swisher CN, Heydemann PT, Rabiah P, Withers S, Soteropoulos P, Hood L, McLeod R. Ngô HM, et al. Sci Rep. 2019 May 28;9(1):8110. doi: 10.1038/s41598-019-44545-0. Sci Rep. 2019. PMID: 31133744 Free PMC article.

Abstract

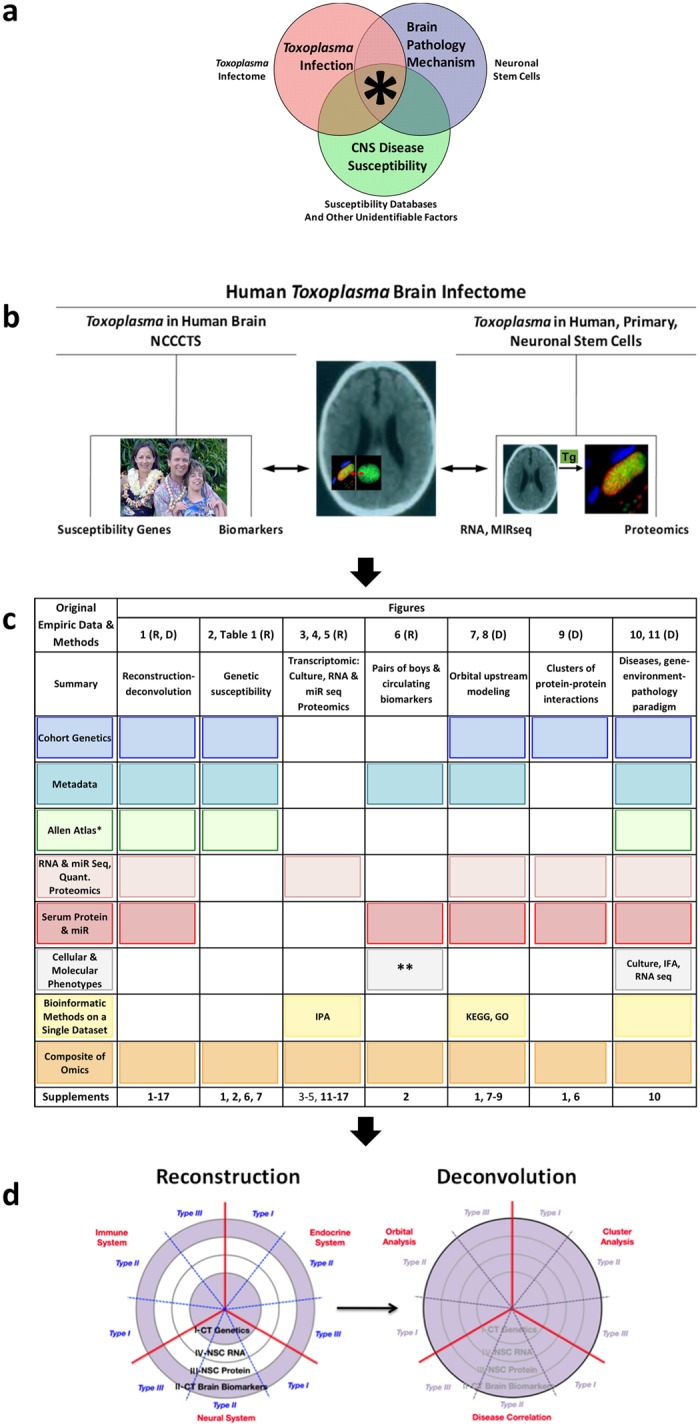
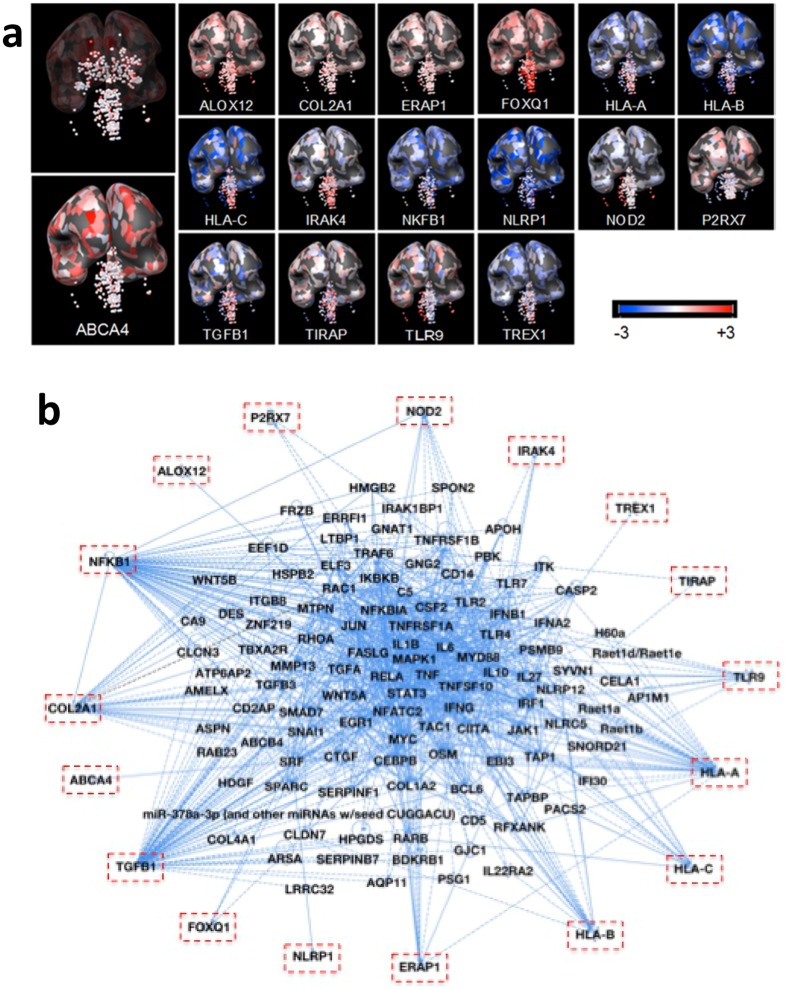
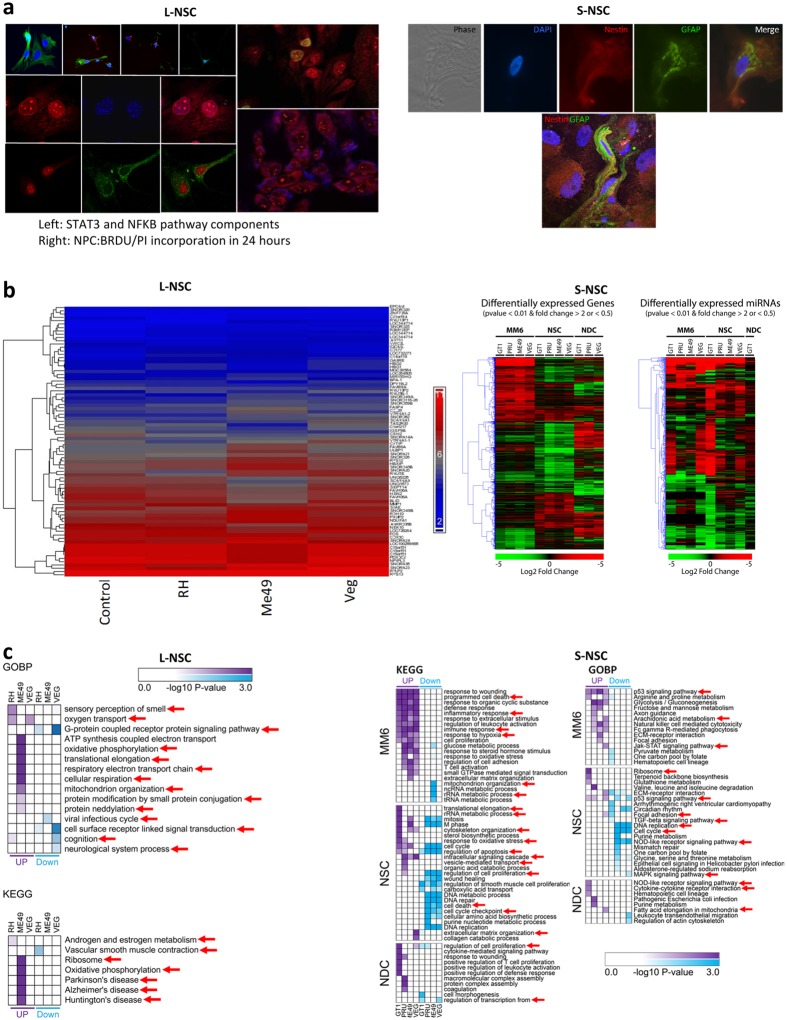
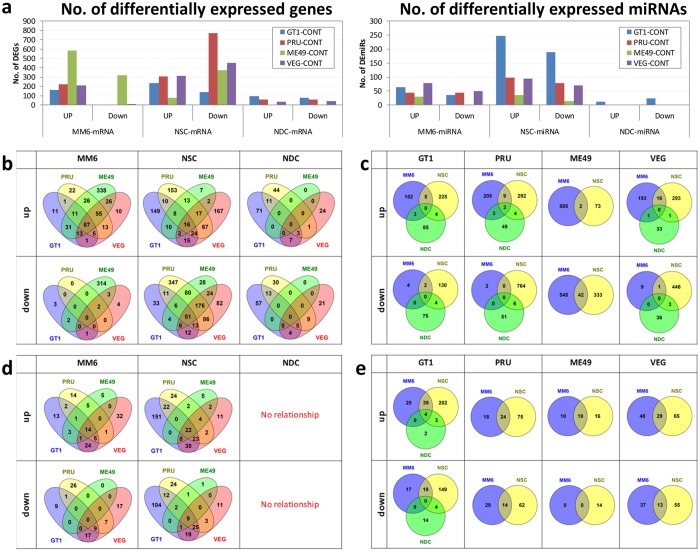
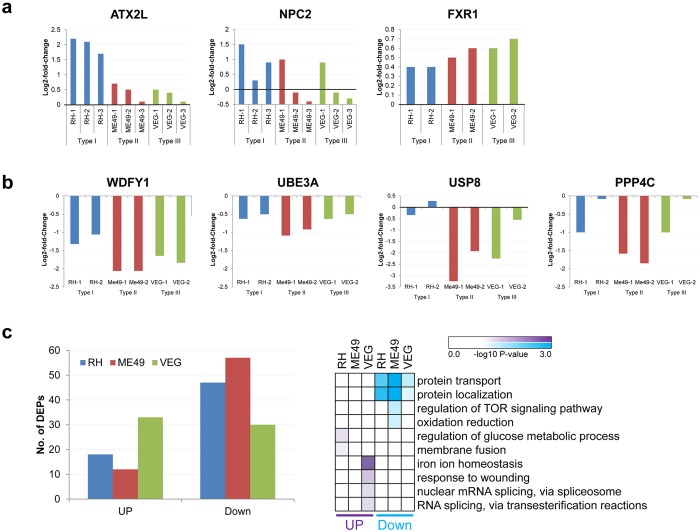
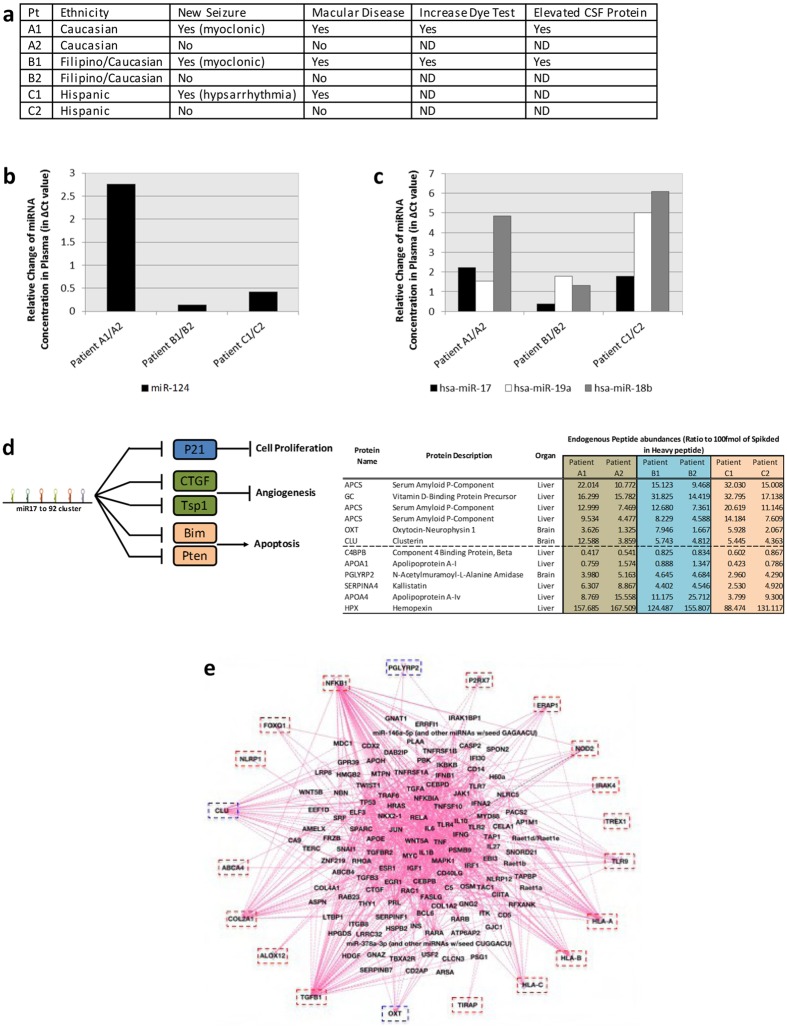
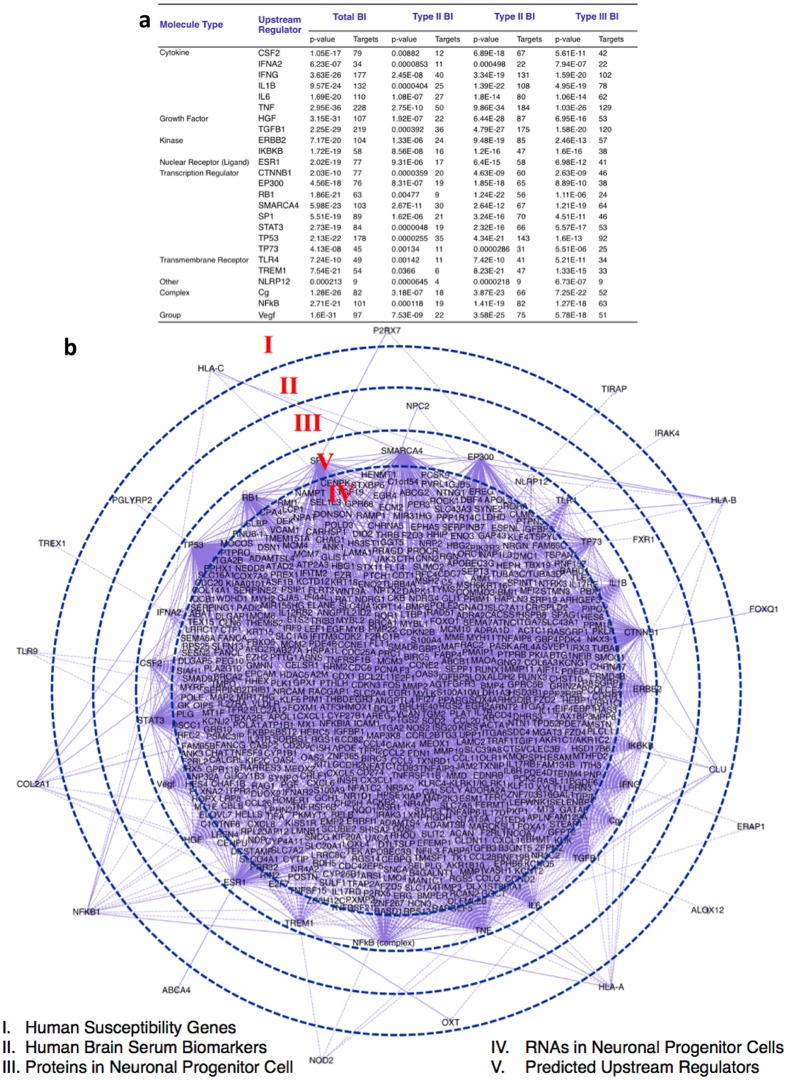
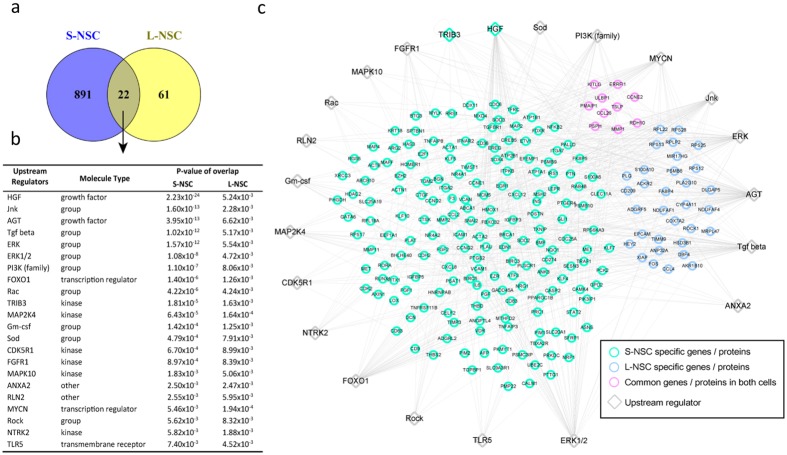
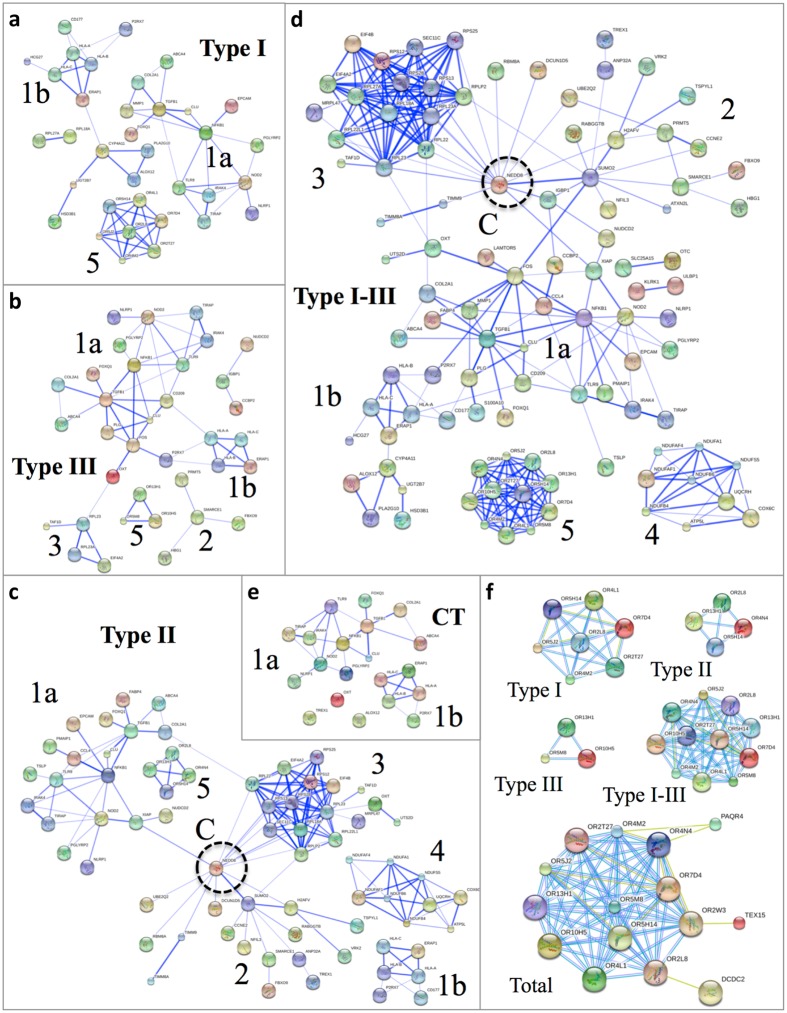
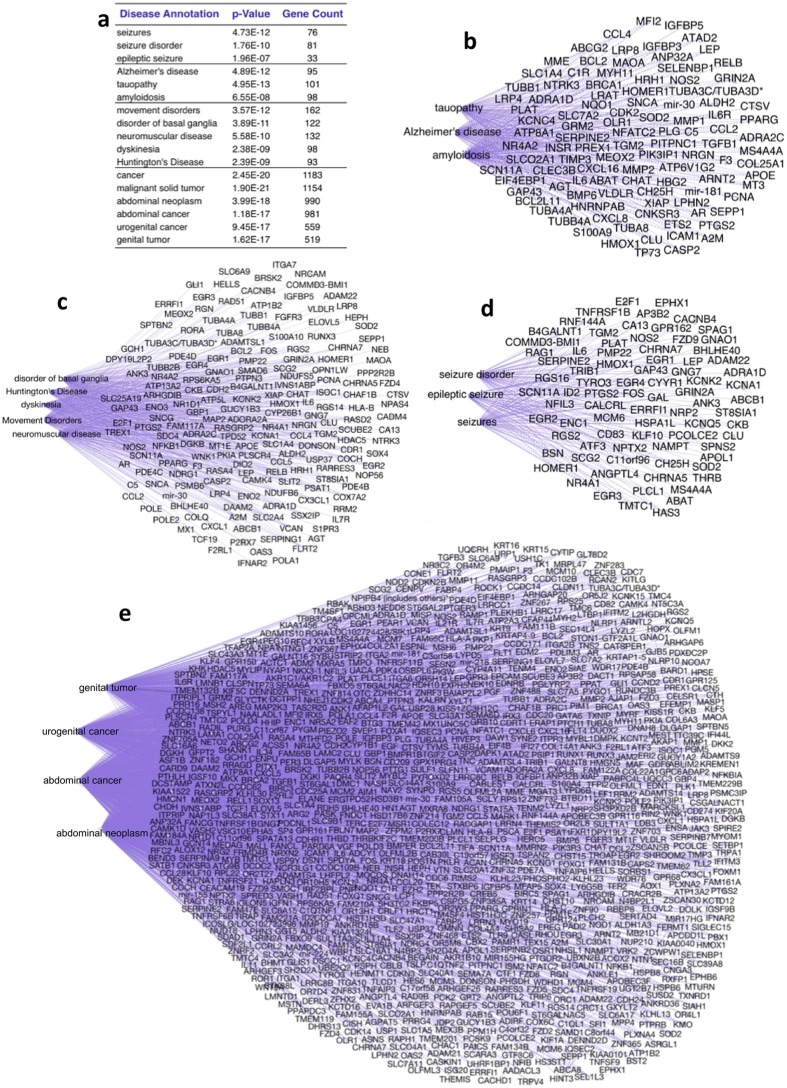
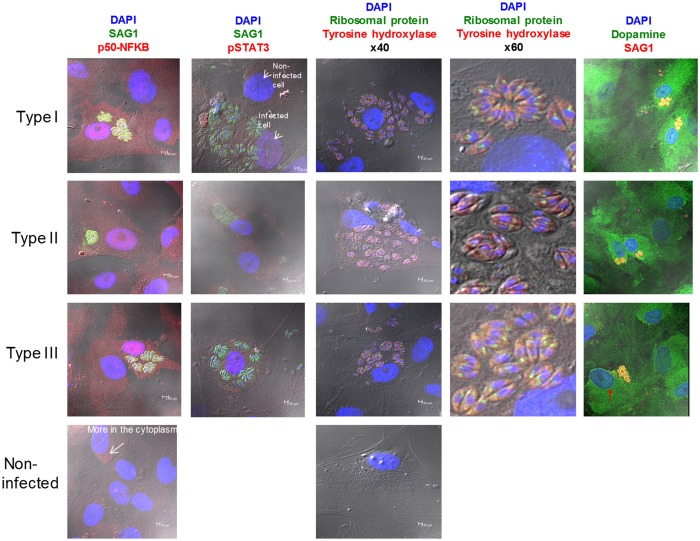
One third of humans are infected lifelong with the brain-dwelling, protozoan parasite, Toxoplasma gondii. Approximately fifteen million of these have congenital toxoplasmosis. Although neurobehavioral disease is associated with seropositivity, causality is unproven. To better understand what this parasite does to human brains, we performed a comprehensive systems analysis of the infected brain: We identified susceptibility genes for congenital toxoplasmosis in our cohort of infected humans and found these genes are expressed in human brain. Transcriptomic and quantitative proteomic analyses of infected human, primary, neuronal stem and monocytic cells revealed effects on neurodevelopment and plasticity in neural, immune, and endocrine networks. These findings were supported by identification of protein and miRNA biomarkers in sera of ill children reflecting brain damage and T. gondii infection. These data were deconvoluted using three systems biology approaches: "Orbital-deconvolution" elucidated upstream, regulatory pathways interconnecting human susceptibility genes, biomarkers, proteomes, and transcriptomes. "Cluster-deconvolution" revealed visual protein-protein interaction clusters involved in processes affecting brain functions and circuitry, including lipid metabolism, leukocyte migration and olfaction. Finally, "disease-deconvolution" identified associations between the parasite-brain interactions and epilepsy, movement disorders, Alzheimer's disease, and cancer. This "reconstruction-deconvolution" logic provides templates of progenitor cells' potentiating effects, and components affecting human brain parasitism and diseases.


Conflict of interest statement

The authors declare that they have no competing interests.

Figures

Figure 1
Figure 1
Methodology and analyses for understanding interaction of Toxoplasma gondii with human brain. (a) Gene-environment-pathology paradigm. The Venn diagram shows model of pathogenesis with confluence of permissive host and parasite genetics, and exposure. (b) Flow diagram of empirical genetic and biomarker data from NCCCTS, transcriptomics and proteomics. (c) Structure of the manuscript. This includes original empiric data, methods for analyses, and contributions of components to analyses in each figure. *Empiric but not from NCCCTS cohort; **Cell culture, IFA, microarray gene expression, mRNAseq, miRseq, quantitative proteomics, miR qPCR. d. Reconstruction and deconvolution analyses. Reconstruction is the discovery, integration and systems analysis of interrelatedness of four areas of primary, original data: genetics, transcriptomics and proteomics of infected cells and circulating serum biomarkers in ill persons. Deconvolution refers to the systems analysis that examines upstream regulatory genes, protein-protein cluster interactions and diseases with which biosignature pathways associate. These are the topics of the current work and are elaborated on throughout this manuscript. Image of family reproduced with their permission and also from “The Billion Brain Parasite”, Science Life (Easton, 2014).
Figure 2
Figure 2
Susceptibility genetics. (a) Expression and localization in human brain utilizing Allen Brain Atlas of genes with alleles conferring susceptibility to congenital toxoplasmosis in National Collaborative Chicago Based Congenital Toxoplasmosis Study (NCCCTS). Transcript expression is visualized for brain of the youngest donor (H0351.2001, 24 years, male, African-American). Z-score of microarray data ranges between −3 and +3 to quantify the lowest to highest expression (see Supplement B: Table S2). (b) Ingenuity Pathway Analysis (IPA) of NCCCTS susceptibility genes and upstream regulators. Cut off of p value at 5 × 10−3 generated a network of 117 predicted upstream regulators (see Supplement B: Table 2). Upstream regulators and susceptibility genes are consolidated/bundled and graphically mapped. Susceptibility genes are manually relocated in IPA graphic to show connectivity to upstream regulators. Note NFκB and TGFβ are central nodes that are visual.
Figure 3
Figure 3
Transcriptomics and their Analyses. (a) Immunostaining of L-NSC and S-NSC cell lines. Left panel in a shows L-NSC cells stained for nestin (green) and Tuj1 (red) (upper row, 20X), Stat 3 (middle row, red) and NFκB (lower row, green), nuclear counterstain blue, DAPI (40X). The right side of the left panel in a shows L-NSC cells immunostained for the cell proliferation marker bromodeoxyuridine, BrdU(upper panel), and propidium, PI (lower panel), nuclear counterstained, DAPI blue (40X). A, right panel, phase microscopic image of S-NSC cells in culture; top panel shows DAPI counterstaining of a nucleus from a cell immunopositive for the cytoskeletal and neural stem/progenitor cell marker proteins nestin (red) and GFAP (green). The panel below shows a single double labeled S-NSC cells double labeled for nestin and GFAP, merged image. The S-NSC double labeled cell interestingly possesses the same morphology and immunostaining pattern of cytoskeletal elements as originally shown in immunocompromised mouse xenografts of the original parental line following intracerebral transplantation and their homing to neurogenic regions (Fig. 3f in Walton et al. Development, 2006). (b) Heat maps showing differentially expressed protein coding and miRNA genes. Left panel, L-NSC microarray gene expression data. Upregulated and downregulated genes in infected cells are shown in red and blue respectively. Middle panel, S-NSC differentially expressed protein-coding genes. Red and green represent genes over- or under-expressed in infected cells respectively. Right panel, microRNA genes over- (red) and under-expressed (green) in infected S-NSC. (c) Functional enrichment analysis of transcriptomics datasets focused on KEGG pathways and GO Biological Processes. Left panels, enrichment analysis on L-NSC transcriptomes; right panels, enrichment analysis on MM6 cells and Steindler’s NSC and NDC cells. Red arrows indicate interesting pathways. DEGs, GO Biological Processes enriched with DAVID software v6.7. GO Biological Processes, p-value < 0.01, number of genes associated with certain GO term >5. (j) KEGG pathway enrichment analysis. Identified DEGs, KEGG pathways enriched with DAVID software v6.7. KEGG pathways, p-value < 0.05. For L-NSC GO and KEGG analysis show neddylation, pathways of Alzheimer’s, Parkinson’s and Huntington’s diseases. For S-NSC there are a variety of interesting pathways marked by red arrows, as in MM6 and NDCs as well involving ribosomes, p53 signaling, cell cycle, TGFβ, purine metabolism, NOD receptor signaling, MAPK signaling, vesicle mediated transport among others. Nominal p values were utilized for KEGG and GO analyses; p-values for pathways that were robust to Benjamini Hochberg correction also are shown in Supplement B: Table S16, 17. Comparison of the nominal and corrected p values indicate the most robust pathways.
Figure 4
Figure 4
Comparative analysis of MM6, S-NSC and S-NDC transcriptomics profiles by cell type and parasite strains. (a) Number of protein-coding genes (DEGs, left panel) and miRs (DEmiRs, right panel) differentially expressed between infected and uninfected conditions. This is with a false discovery rate ≤0.01 and absolute log2-fold-change ≥1. (be). Number of shared over- or under-expressed protein-coding genes (b and c) or miR genes (d and e) grouped by host cell type (b and d) or parasite type (c and e). Both cell type and parasite strain drive differential response, with a predominant effect from the host cell type. Nominal p values were utilized for KEGG and GO analyses. Pathways that were robust to Benjamini Hochberg correction also are shown in Supplement B: Tables S16, 17.
Figure 5
Figure 5
Proteomics and their Analyses. a-b. Proteins differentially expressed during parasite infection of L-NSC (a) or S-NSC (b). ATXN2L, Ataxin 2-like; NSC2, Niemann-Pick disease, type C2; FXR1, Fragile X Mental Retardation Autosomal Homolog 1; WDFY1, WD Repeat And FYVE Domain Containing 1; UBE3A, Ubiquitin Protein Ligase E3A; USP8, Ubiquitin Specific Peptidase 8; PPP4C, Protein Phosphatase 4 Catalytic Subunit). (c) Left panel, number of differentially expressed proteins (DEPs) in S-NSC infected with T. gondii types I, II and III; right panel, GO Biological Processes significantly overrepresented (p-value < 0.01) in the set of 3,359 proteins differentially expressed in infected S-NSC compared with their respective uninfected controls (>2-fold change and false discovery rate <0.1). Nominal p-values were utilized for KEGG and GO analyses. Pathways that were robust to Benjamini Hochberg correction also are shown in Supplement B: Table S15.
Figure 6
Figure 6
Serum biomarkers from boys with active brain disease due to T. gondii reflect infection and neurodegeneration. (a) Tabular clinical summary: Three pairs of children, matched demographically; one in each pair had severe disease and the other mild or no manifestations. One pair dizygotic, discordant twins. Each ill child had new myoclonic or hypsarrythmic seizures. Two children had T2 weighted abnormalities on brain MRIs similar to active inflammatory and parasitic disease in murine model. (bd) Protein and miRNA serum biomarkers: Panel of protein and miRNA profiling performed on serum obtained at time of new illness. Changes in serum miRNA concentration between each infected child and corresponding control is expressed as the difference in RT-qPCR Ct-values for miR-124 (b) and miR-17, miR-19a and miR-18b (c). Abundance of peptides measured. In Fig. 6b and c, these data are extracted directly from the qPCR panel for miRNA profiling. (d) Left panel, schematic representation of the genes targeted and pathways modulated by miRNA clusters 17–92; right panel, peptide abundances from the 10 most intense peptide ions detected by proteomics in the three children pairs. Peptides with higher or lower abundance in ill children compared to healthy controls are depicted above or below the dashed line respectively. (e) Bundling of upstream regulators predicted from susceptibility genes (red box) and brain biomarkers (blue box). See Supplement 2 for IPA analysis of upstream regulators with p-value <5 × 10–3. Circulating biomarkers detected in the T. gondii infected brain are clusterin (CLU), oxytocin/neurophysin I prepropeptide (OXT), peptidoglycan recognition protein 2 (PGLYRP2), and microRNAs (miR214, miR-17, miR-18b, miR-19a) (Fig. 4B, Supplement B: Table S7). These specific miRNAs were not annotated in the IPA database, so the analysis focuses on the 3 protein biomarkers. PGLYRP2 is a hydrolase that recognizes and digests bacterial active peptidoglycan into biologically inactive fragments that triggers innate immune responses to intracellular pathogens. Clusterin/Apolipoprotein J is a secreted chaperone which is proposed to be a biosensor of oxidative injury. The ‘love/bonding hormone’ Oxytocin is a posterior pituitary hormone that is synthesized in the hypothalamus. OXT hormonal activity influences cognition, tolerance, adaptation and complex sexual and maternal behavior, as well as the regulation of water excretion and cardiovascular functions. Presence of markers of neurodegeneration and inflammation include Clusterin, PGLYRP2, and Oxytocin in ill children compared with their healthy controls.
Figure 7
Figure 7
Deconvolution of total brain infectome reveals upstream regulatory pathways. a. Statistical probability of 25 upstream regulators of total brain infectome (BI) with most significant p-values. The Total Brain infectome included 1,678 genes from all datasets of genetics susceptibility, brain biomarkers, messenger RNAs of L-NSC and S-NSC, and proteins of L-NSC. The BI is segregated into Type I, II and III infection (see Supplement B: Table S7). IPA analysis of BI identified 1,640 upstream candidates (see Supplement B: Table S7). ‘Target’ indicates the number of T. gondii-induced genes found in each upstream regulatory pathway. TNF, TGFβ1, IFNG, TP53 and IL1β are the most dominant upstream regulators found in the T. gondii brain infectome. (b) “Orbital” visualization. The 25 highest statistical valued upstream regulators (a) are added to the brain infectome and graphically mapped by IPA. The relationships between the 5 reconstruction layers are visualized in the “orbital diagram”. Specific genes are manually repositioned in each empirical ‘layer’ drawn to ‘orbit’ the core gene datasets. Upstream regulatory network (V) connects RNA (IV) and Protein (III) of human NSCs, brain biomarkers (II), and NCCCTS Susceptibility genes (I). Since the IPA drawing program is limited to 30,000 interactions lower than the cut-offs, ATXN2L was not found in this visual analysis. The total brain infectome is deconvolved into functional correlates by IPA Core Analysis. Canonical pathway annotation reveals the predominant mechanism of IL-17 pathways in arthritis, psoriasis and allergy with related cell types (macrophages, fibroblasts, endothelial cells, osteoblasts, osteoclasts, chondrocytes) playing a role in the inflammation. Top pathways also include cardiogenesis, adipogenesis, hepatic stellate cell activation and diapedesis of agranulocytes and granulocytes, molecular mechanisms of cancer accompanied with the signaling of colorectal cancer metastasis. Wnt/Ca + pathway moderates axonal guidance signaling and other cell growth and developmental pathways. The top scored canonical pathway shows also cell cycle control of chromosomal replication as possibly a prevailing molecular mechanism. Supplement B:Table S8 describes the IPA analysis of canonical pathways with functional mechanisms in neural stemness, neurodevelopment, neurobiology, immunology, cancer, and cell cycle. Supplement B: Table S9 identifies pathways associated with the nuclear factor NFkB.
Figure 8
Figure 8
Upstream regulators targeting genes and proteins differentially expressed in S-NSC or L-NSC. (a) Relationships of upstream regulators: 913 and 83 molecules were identified as upstream regulators of genes or proteins differentially expressed in S-NSC and L-NSC, respectively (p-value ≤ 0.01). (b) Regulators in common. Venn diagram shows that among the upstream regulators, 22 molecules are common between L-NSC and S-NSC. (c) Gene regulatory network targeted by the 22 common upstream regulators.
Figure 9
Figure 9
Cluster deconvolution uncovers six clusters of protein-protein interactions effecting brain functions and circuitry. STRING analysis of the brain infectome was carried out to elucidate protein-protein interaction networks modulated by parasite infection (see Supplement B: Table S6). STRING analysis was performed on a dataset composed of human susceptibility genes and biomarkers identified from patients with congenital toxoplasmosis (CT, panel e) or plus a collection of genes differentially expressed in L-NSC infected with type I parasites (panel a), type III (panel b), type II (panel c) or all strains (panel d). Six distinct clusters were visualized from the integration of genetics, biomarkers and L-NSC expression data (panel e) in which clusters 1–3 radiate from NEDD8 (dashed circle, panel c,d), a central node modulated during Type II infection (panel c). The genetics and biomarkers generated clusters 1a and 1b that were further expanded with connections to genes modulated in Type I-III infectomes (panel a–c). Clusters 4 and 5 do not interact with NEDD8 (panel c and d). Panel f shows a detail of the genes belonging to the odorant receptor cluster 5 that are perturbed in L-NSC infected with T. gondii type I (Type I), II (Type II), III (Type III) or all three types (Type I-III) plus the sum of genes modulated in S-NSC infected with types I, II and III parasites (Total). In panels a-e edge thickness indicates confidence of interactions, with thin edges having middle confidence combined scores and thick edges high confidence combined scores, as defined by STRING. In panel f, edge color represent interaction evidence source as defined in STRING: light blue, curated database; yellow, text mining; purple, protein homology. Note: odor attraction of mice and chimpanzees to cats, .
Figure 10
Figure 10
Deconvolution of brain infectome by disease correlation. The 3rd deconvolution approach of the total brain infectome predicts correlation between T. gondii infection and common neurological diseases using IPA disease and function tool (see Supplement B: Table S10A,B). (a) Grouping of disease annotations included p-value and group size. The 4 disease groups are detected for all Type I, II and III infections. (b) Alzheimer group included Alzheimer’s disease, tauopathy and amyloidosis annotations. IPA Canonical analysis indicates this disease gene network is mediated by signaling pathways of adaptor protein 14-3-3 (7 genes), retinoic acid receptor LXR/RXR (7 genes), tumor suppressor protein p53 (7 genes), cytokine IL-17A (5 genes) and glucocorticoid receptor (13 genes). (c) Movement disorders. This entails predictions for movement disorders, disorder of basal ganglia, neuromuscular disease, dyskinesia and Huntington’s Disease. IPA canonical analysis of this gene network indicates signaling pathways mediated by G-Protein coupled receptor (13 genes), by cAMP (10 genes), transcriptional regulator 14-3-3 (7 genes), cytokine Endothelin-1 (8 genes), polypeptide hormone relaxin (9 genes) and corticotropin releasing hormone (8 genes). (d) Epileptic disorders pathways for seizures, seizure disorder and epileptic seizure. IPA canonical analysis of the 81-gene network indentifies top-ranking signaling pathways that are associated with retinoic acid receptor (6 genes), endothelin-1 (6 genes), Gaq protein (5 genes) and corticotropin releasing hormone (5 genes). (e) Cancer group. This illustrated mechanisms of cancer, malignant solid tumor, abdominal neoplasm, abdominal cancer, urogenital cancer and genital tumor that are potentially activated in the infected brain. The top 10 canonical pathways (Supplement B: Tables S8,9) reveal important mechanisms that may potentiate cancer development in the T. gondii infected brain, such as Wnt/Ca + pathway (14 genes) and role of IL-17A in arthritis (14 genes). Wnt/Ca + pathway annotation contains 6 frizzled class receptors (FZD2, FZD3, FZD4, FZD5, FZD8, FZD9) and receptor tyrosine kinase-like ROR1. Not shown in diagram is the association with the schizophrenia 19-gene network: ABAT, ABCB1, ADRA1D, ANK3, APOL1, CHRNA5, CHRNA7, E2F1, EGR3, EGR4, GAP43, GRIN2A, HOMER1, IL6, PMP22, PTGS2, SCG2, SOD2, TMTC1.
Figure 11
Figure 11
Phenotypes in NSC demonstrating functions that are biologically important empirically. NFkB (left panel): T. gondii (I, II, III) infection of S-NSC alters localization of p50-NFkB(red) and Stat 3 (second panel, red): SAG1 (Green), Hoechst (blue); T. gondii, in NSC, expresses or alters host cells’ neurotransmitters. Tyrosine Hydroxylase (red) in the infected NSCs that synthesizes dopamine is present in T. gondii (middle panels 40X, 60X). This is further exemplified in the furthest right panel by a dopamine-like immunostaining pattern in the parasite (green). The red arrow in the dopamine-like staining image points to a host cell dense perinuclear distribution of label. This suggests potential to influence neurotransmission in human NSC. This could contribute to abnormal circuitry function as seen in mice and as occurs in epilepsy in some persons, . These experiments for immunostaining each of these molecules were performed at separate times, not simultaneously.

References

    1. De Flora S, Quaglia A, Bennicelli C, Vercelli M. The epidemiological revolution of the 20th century. FASEB J. 2005;19:892–897. doi: 10.1096/fj.04-3541rev. - DOI - PubMed
    1. Bauer UE, Briss PA, Goodman RA, Bowman BA. Prevention of chronic disease in the 21st century: elimination of the leading preventable causes of premature death and disability in the USA. Lancet. 2014;384:45–52. doi: 10.1016/S0140-6736(14)60648-6. - DOI - PubMed
    1. Brown AS. Exposure to prenatal infection and risk of schizophrenia. Front Psychiatry. 2011;2:63. doi: 10.3389/fpsyt.2011.00063. - DOI - PMC - PubMed
    1. Hermes G, et al. Neurological and behavioral abnormalities, ventricular dilatation, altered cellular functions, inflammation, and neuronal injury in brains of mice due to common, persistent, parasitic infection. J Neuroinflammation. 2008;5:48. doi: 10.1186/1742-2094-5-48. - DOI - PMC - PubMed
    1. David CN, et al. GLT-1-Dependent Disruption of CNS Glutamate Homeostasis and Neuronal Function by the Protozoan Parasite Toxoplasma gondii. PLoS Pathog. 2016;12:e1005643. doi: 10.1371/journal.ppat.1005643. - DOI - PMC - PubMed

Publication types

LinkOut - more resources