. 2017 Sep 13;7(1):11462.
doi: 10.1038/s41598-017-11026-1.

In planta expression of hyperthermophilic enzymes as a strategy for accelerated lignocellulosic digestion

Affiliations

In planta expression of hyperthermophilic enzymes as a strategy for accelerated lignocellulosic digestion

Bilal Ahmad Mir et al. Sci Rep. .

Abstract

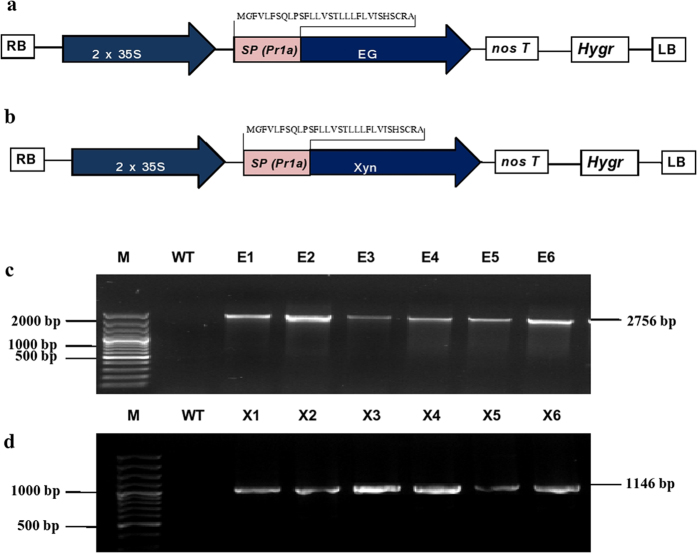
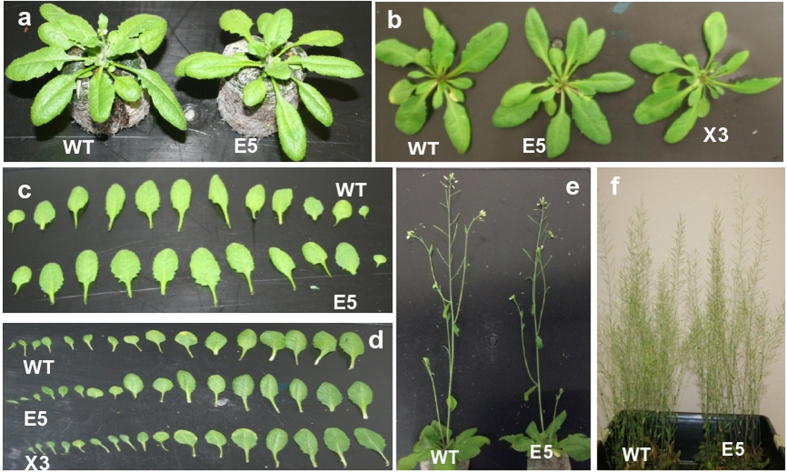
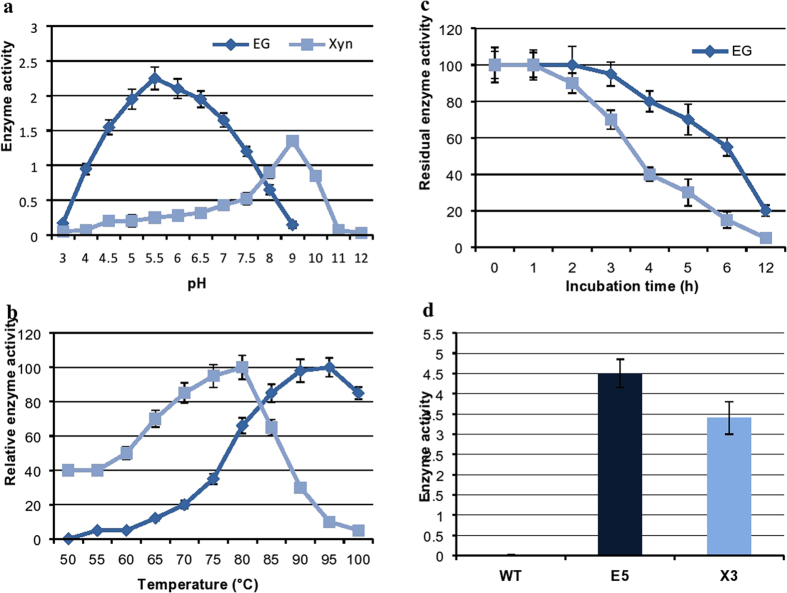
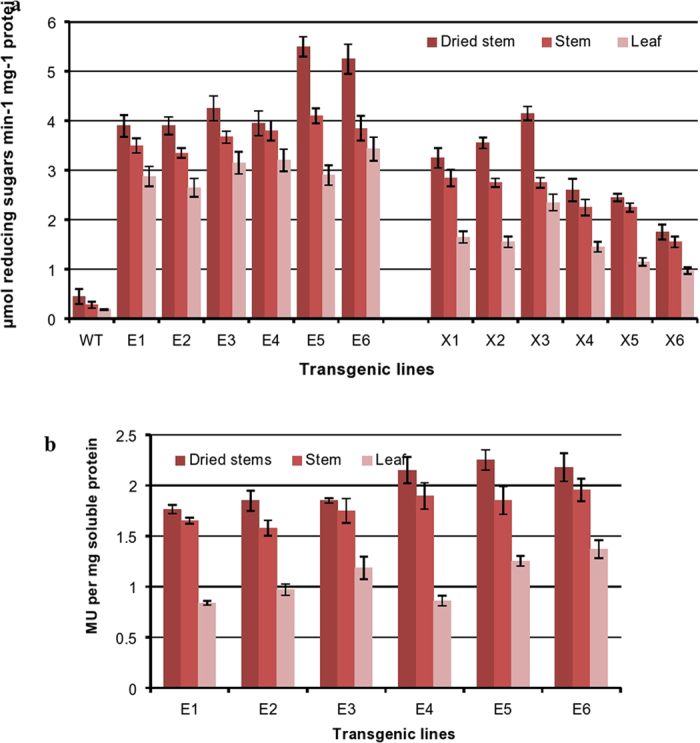
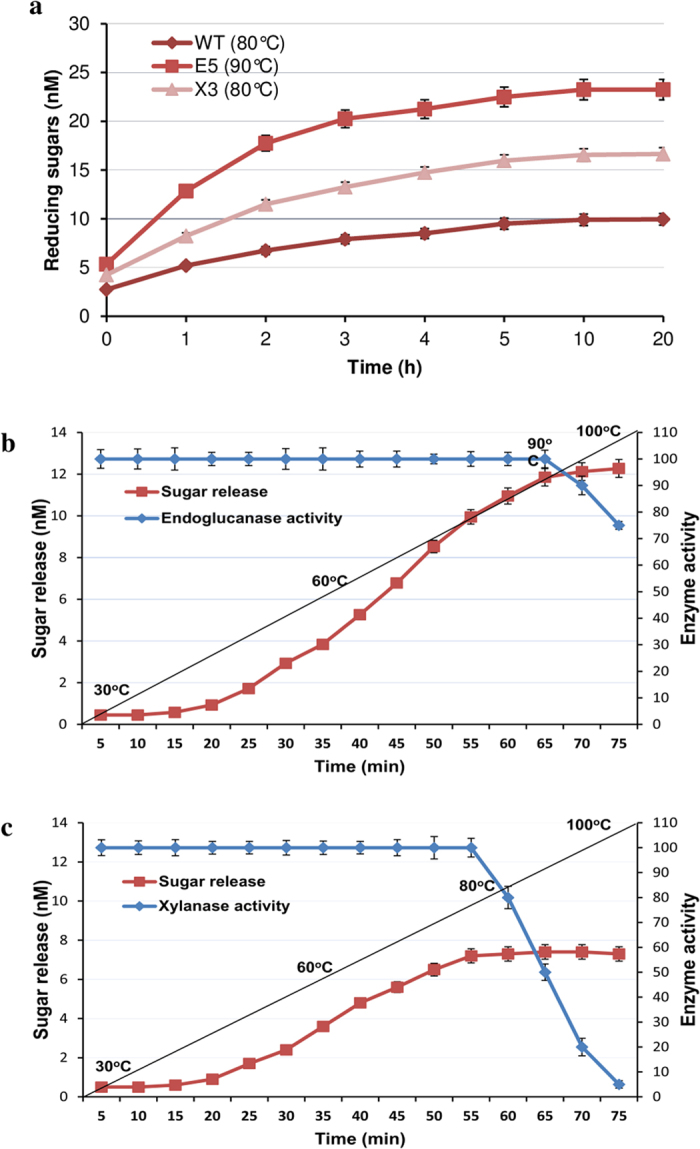
Conversion of lignocellulosic biomass to biofuels and biomaterials suffers from high production costs associated with biomass pretreatment and enzymatic hydrolysis. In-planta expression of lignocellulose-digesting enzymes is a promising approach to reduce these cost elements. However, this approach faces a number of challenges, including auto-hydrolysis of developing cell walls, plant growth and yield penalties, low expression levels and the limited stability of expressed enzymes at the high temperatures generally used for biomass processing to release fermentable sugars. To overcome these challenges we expressed codon-optimized recombinant hyperthermophilic endoglucanase (EG) and xylanase (Xyn) genes in A. thaliana. Transgenic Arabidopsis lines expressing EG and Xyn enzymes at high levels without any obvious plant growth or yield penalties were selected for further analysis. The highest enzyme activities were observed in the dry stems of transgenic lines, indicating that the enzymes were not degraded during stem senescence and storage. Biomass from transgenic lines exhibited improved saccharification efficiency relative to WT control plants. We conclude that the expression of hyperthermophilic enzymes in plants is a promising approach for combining pretreatment and enzymatic hydrolysis processes in lignocellulosic digestion. This study provides a valid foundation for further studies involving in planta co-expression of core and accessory lignocellulose-digesting enzymes.


Conflict of interest statement

The authors declare that they have no competing interests.

Figures

Figure 1
Figure 1
(a-b): Schematic representation of EG (a) and Xyn (b) expression constructs used for constitutive expression in Arabidopsis plants using pMDC32; (c-d) PCR analysis of genomic DNA from A. thaliana plants transformed with EG (c) and Xyn (d). 2X35S, Cauliflower mosaic virus (CaMV) 35SS promoter; SP, tobacco pathogenesis related protein 1a (Pr1a) signal peptide; NOS, nopaline synthase transcriptional terminator; Hyg r, Hygromycin resistance gene as a selection marker; LB and RB, left border and right border respectively. The codon optimized N-terminal amino acid sequence of Pr1a is shown in the construct. E1, E2, E3, E4, E5, and E6 represent EG expressed transgenic lines; X1, X2, X3, X4, X5 and X6 represent Xyn expressed Arabidopsis lines. WT represents the wild type control plants, M, DNA marker ladder.
Figure 2
Figure 2
Expression of EG and Xyn in Arabidopsis. (a) Quantitative RT-PCR analysis of the transgenic lines. EG and Xyn transcripts were measured by RT-qPCR in EG-over-expressed (E1, E2, E3, E4, E5, and E6) and Xyn-over-expressed (X1, X2, X3, X4, X5 and X6) Arabidopsis plants; (b) EG and Xyl expression in four week old Arabidopsis transgenic plants. WT represents the wild type control plants, M, DNA marker ladder. The values are mean ±SD of three biological replicates of each line. Actin was used as an internal control for QRT-PCR analysis; (c) Western blot analysis of total soluble proteins (TSP) extracted from the six week old stems of T3 homozygous transgenic Arabidopsis plants. Equal amount (30 µg) of TSP loaded to each well were electrophoresed through 12% SDS-PAGE, transferred onto a PVDF membrane and proteins detected by SuperSignal® West Pico (Pierce Biotechnology Inc.; Rockford, IL) Chemiluminescent substrate for the horseradish peroxidase reaction using custom synthesised peptide based rabbit anti-EG and anti-Xyn polyclonal antibodies as the primary antibody and anti-rabbit antibodies conjugated to horseradish peroxidase (Amersham) as the secondary antibody. Protein extracts from non transgenic wild type (WT) stems were used as negative control on both blots.
Figure 3
Figure 3
Effect of EG and Xyn heterologous expression in Arabidopsis. (a) WT and E5 Arabidopsis at four-week-old. (b) WT, E5 and X3; (c-d) Rosette leaves in (a) (WT versus E5) and (b) (WT versus E6 and X3) from the first to last are arranged from left to right; (e) WT and E5 in Arabidopsis at 6 weeks old. f) Arabidopsis plants at maturity (8 week) bearing siliques and displaying normal growth.
Figure 4
Figure 4
Effect of pH and temperature on the activity and stability of endoglucanase (EG) and xylanase (Xyn). (a-b) The recombinant endoglucanase and xylanase incubated in various buffers (pH 3–12) and temperatures (50–100 °C) and assayed for enzyme activities. Measurements shown in (a) were performed at 90 °C for EG and 80°C for the Xyn. Measurements shown in (b) were obtained using optimal pH for EG and Xyn as shown in A. (c) Recombinant enzyme extracts were incubated in buffers of optimum pH without substrates and kept at 90 °C for EG and 80 °C for the Xyn. Aliquots were collected at various time intervals and stored at 0 °C for calculating residual activity. Highest enzyme activity for each enzyme at time point zero is set to 100%. (d) Similarly enzyme extracts after incubation at their respective temperature and pH optima along with the WT extracts for 30 min were assayed for enzyme activities. All the measurements were performed in triplicate. The activity is expressed as µmol of reducing sugars min−1(U) mg−1 protein; for (B & C) enzyme activities are expressed as relative activity percentage where highest enzyme activity is set to 100%. Each data point represents the average enzyme activity from three biological replicates and shown as the average ± standard deviation. Activity was measured in 1% CMC in 50 mM HEPES buffer for endoglucanase and 1% Beachwood xylan in glycine-NaOH buffer for xylanase. All the transgenic lines for EG and Xyl showed similar temperature/pH versus activity profiles. The products were detected by DNS reducing sugar assay using glucose as a standard.
Figure 5
Figure 5
Enzymatic activities in various tissues of transgenic lines. (a) Enzyme activity in protein extracts of six transgenic Arabidopsis lines expressing EG (E1, E2, E3, E4, E5 and E6) and Xyn (X1, X2, X3, X4, X5 and X6). Enzyme activity was determined as the release of reducing sugars using glucose as standard on 1% CMC for endoglucanase and 1% beech-wood xylan for xylanase after incubation for 10 min at 95 °C. (b) MUCase activity in protein extracts of six western blot positive transgenic Arabidopsis lines expressing EG. Activity was expressed as nmol MU mg−1 TSP min−1. Each data point was determined in triplicate and shown as the average ± standard deviation.
Figure 6
Figure 6
a) Saccharification of EG (E5) and Xyn (X3) over-expressing lines of Arabidopsis and wild type plants (WT). Dried stem tissues (100 mg each) were ground into powder and incubated for 2 h at RT and then transferred to 80 °C (Xyn) and 90 °C (EG) for 20 h in a 5 ml reaction mixture containing optimum buffers for their activity. Reducing sugars in the hydroysates taken after 1, 2, 3, 4, 5, 10 and 20 h time intervals after centrifuged were measured by DNS assay using glucose as standard. (b) E5 and X3 transgenic lines were subjected to saccharification as above for 75 minutes with 1 °C increase in temperature after every 1 minute time period. The lysates taken after every 5 min were assayed for enzyme activity as well as release of sugars. The black line represents the temperature gradient depicting 1 °C increase in temperature after every 1 minute. Activity was expressed in nM of reducing sugars measured after the hydrolysis. The error bars represent standard deviation.

References

    1. Somerville C, et al. Feedstocks for lignocellulosic biofuels. Science. 2010;13:790–792. doi: 10.1126/science.1189268. - DOI - PubMed
    1. Li Q, et al. Plant biotechnology for lignocellulosic biofuel production. Plant Biotechnol. J. 2014;12:1174–1192. doi: 10.1111/pbi.12273. - DOI - PubMed
    1. Himmel ME, et al. Biomass recalcitrance: engineering plants and enzymes for biofuels production. Science. 2007;315:804–807. doi: 10.1126/science.1137016. - DOI - PubMed
    1. Sticklen M. Plant genetic engineering for biofuel production: towards affordable cellulosic ethanol. Nat. Rev. Genet. 2008;9:433–443. doi: 10.1038/nrg2336. - DOI - PubMed
    1. Lynd LR, et al. How biotech can transform biofuels. Nat. Biotechnol. 2008;26:169–172. doi: 10.1038/nbt0208-169. - DOI - PubMed

Publication types

LinkOut - more resources