. 2018 Jan;217(1):305-319.
doi: 10.1111/nph.14785. Epub 2017 Sep 14.

Target of rapamycin signaling orchestrates growth-defense trade-offs in plants

Affiliations

Target of rapamycin signaling orchestrates growth-defense trade-offs in plants

David De Vleesschauwer et al. New Phytol. 2018 Jan.

Abstract

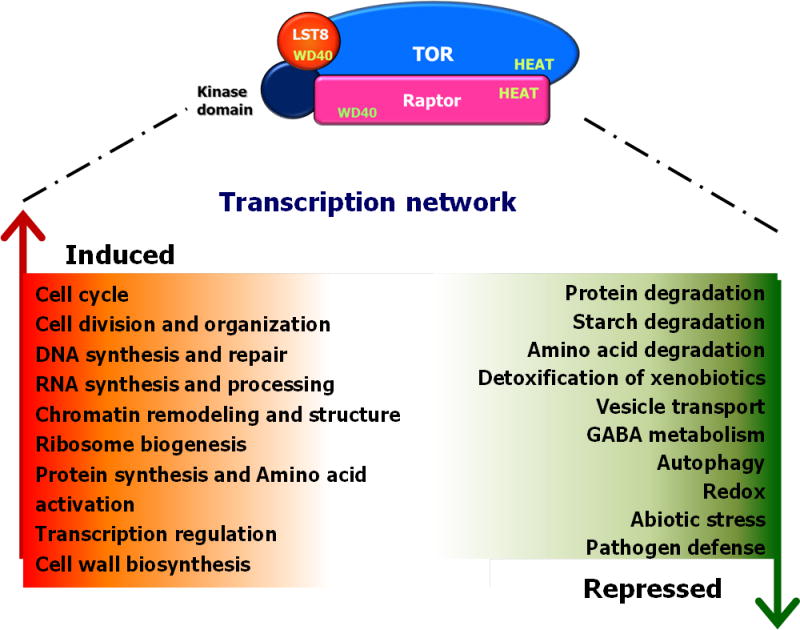
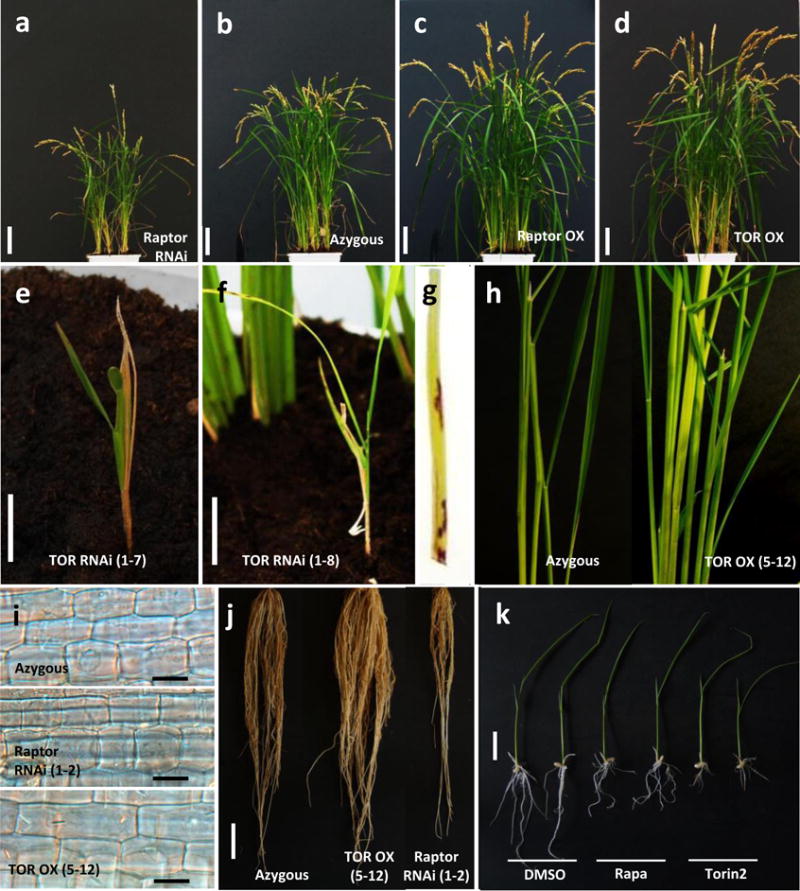
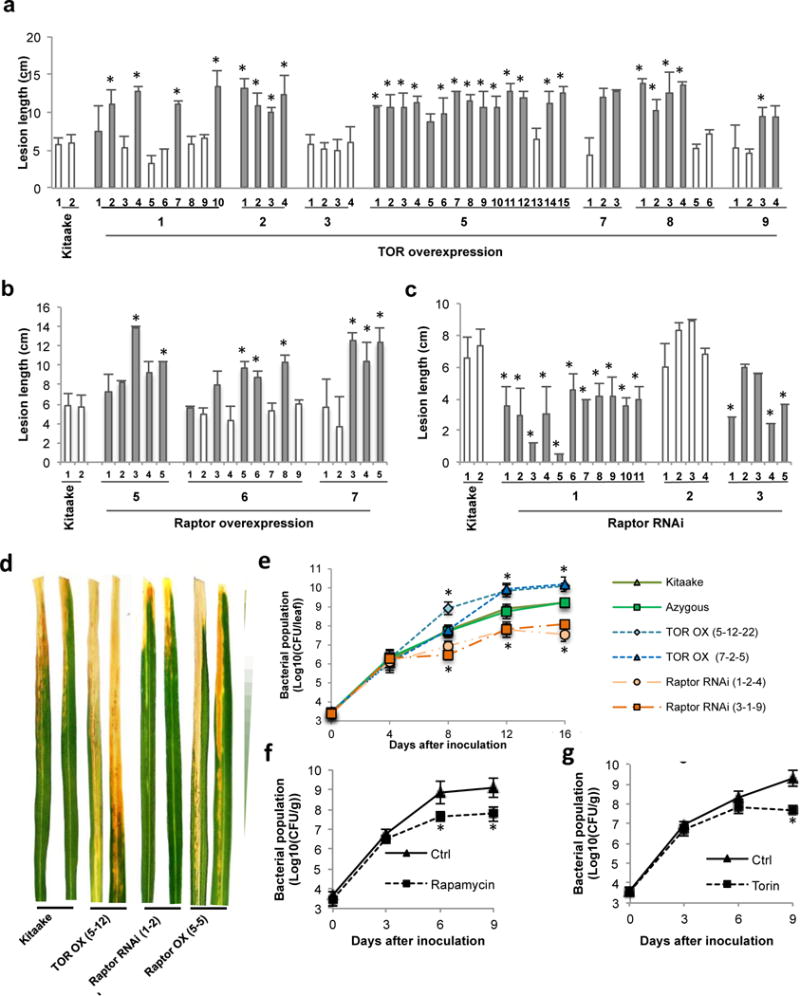
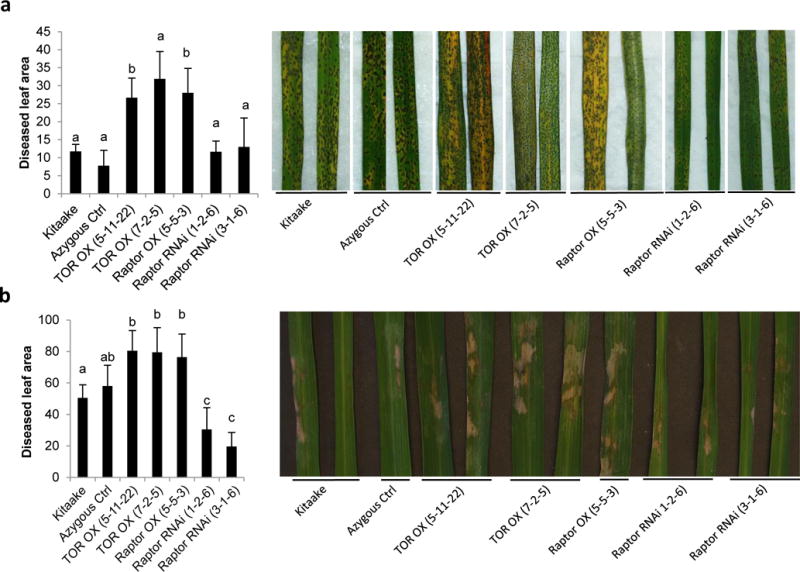
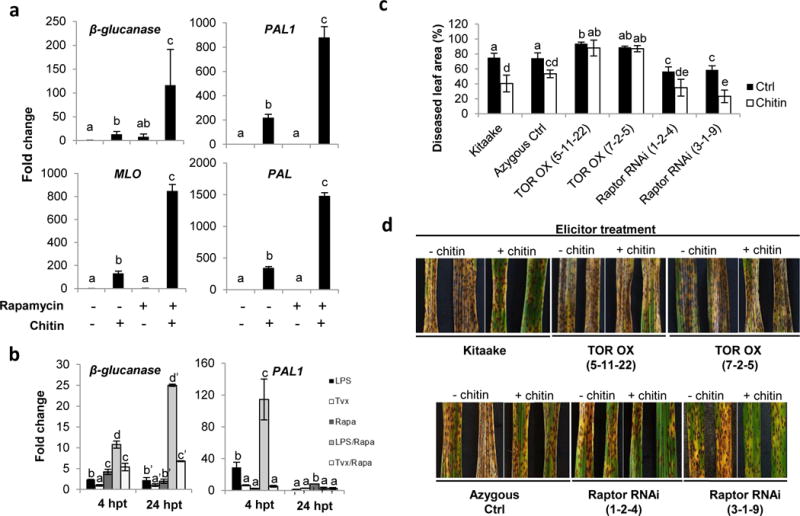
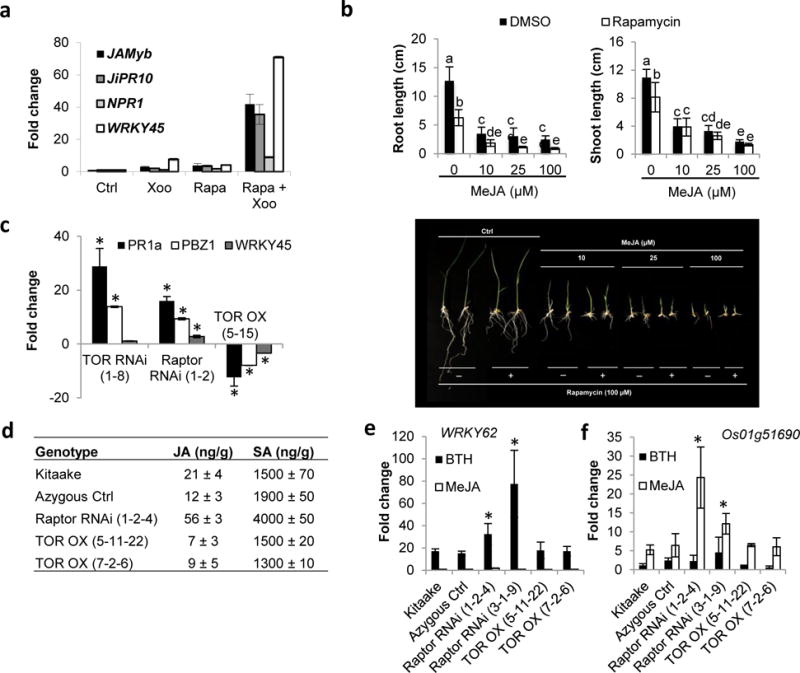
Plant defense to microbial pathogens is often accompanied by significant growth inhibition. How plants merge immune system function with normal growth and development is still poorly understood. Here, we investigated the role of target of rapamycin (TOR), an evolutionary conserved serine/threonine kinase, in the plant defense response. We used rice as a model system and applied a combination of chemical, genetic, genomic and cell-based analyses. We demonstrate that ectopic expression of TOR and Raptor (regulatory-associated protein of mTOR), a protein previously demonstrated to interact with TOR in Arabidopsis, positively regulates growth and development in rice. Transcriptome analysis of rice cells treated with the TOR-specific inhibitor rapamycin revealed that TOR not only dictates transcriptional reprogramming of extensive gene sets involved in central and secondary metabolism, cell cycle and transcription, but also suppresses many defense-related genes. TOR overexpression lines displayed increased susceptibility to both bacterial and fungal pathogens, whereas plants with reduced TOR signaling displayed enhanced resistance. Finally, we found that TOR antagonizes the action of the classic defense hormones salicylic acid and jasmonic acid. Together, these results indicate that TOR acts as a molecular switch for the activation of cell proliferation and plant growth at the expense of cellular immunity.

Keywords: growth-defense trade-offs; jasmonic acid; plant defense; rice (Oryza sativa); salicylic acid; target of rapamycin (TOR).


Figures

Fig. 1
Fig. 1
Overview of biological processes regulated by OsTOR signaling as determined by microarray analysis. Kitaake rice suspension cells were treated with 100 μM rapamycin for 24 h and subjected to genome-wide transcriptome analysis using 44k rice GeneChips. The results showed that OsTOR positively regulates anabolic processes while suppressing catabolic metabolism. In addition, OsTOR drives transcriptional reprogramming of extensive gene sets implicated in stress tolerance and plant defense responses.
Fig. 2
Fig. 2
Target of rapamycin (TOR) positively regulates growth and development in rice plants. (a–g) Phenotypes of transgenic rice lines with increased or decreased TOR signaling output. From left to right: (a) Raptor RNAi (progeny of line Raptor RNAi 1–2), (b) azygous control, (c) Raptor-overexpressing (progeny of line Raptor OX 5–15), (d) TOR-overexpressing (progeny of line TOR OX 5–12), and (e, f) TOR RNAi plants. Pictures were taken 12 wk after germination. Silencing of TOR results in dwarfed growth, sterility and formation of necrotic lesion mimics (as shown in g), whereas TOR overexpression enhances tiller number, seed yield, epidermal and mesophyllic cell elongation, and root growth (h–j). (k) Chemical disruption of TOR signaling with the TOR-specific inhibitors rapamycin (100 μM) and Torin2 (30 μM) slows vegetative growth of in vitro grown Kitaake plants. Pictures were taken 10 d after imbibition. Bars: (a–f) 5 cm. (i) 50 μM; (j, k) 2 cm.
Fig. 3
Fig. 3
OsTOR induces susceptibility against the bacterial leaf blight pathogen Xanthomonas oryzae pv. oryzae (Xoo). (a–c) Segregating T1 progeny were genotyped for the presence of the transgene using hygromycin-specific primers. Closed bars represent plants carrying the transgene, open bars indicate azygous controls. All progeny plants were inoculated with virulent Xoo strain PXO99 using the leaf clipping method and lesion lengths were measured 12 d after inoculation. Data are means ± SD of at least three leaves. Asterisks indicate statistically significant differences compared to nontransformed Kitaake controls (Mann–Whitney, α = 0.05). These results showed that target of rapamycin (TOR) signaling output is inversely correlated with resistance to Xoo. Photos showing representative disease symptoms were taken 12 d after inoculation and are shown in (d). (e) Xoo PXO99 populations in Kitaake, a null transgene control and two independent T2 TOR OX and Raptor RNAi lines at 0–16 d after inoculation. Data shown are means ± SD of three replicates of at least two pooled leaves. Asterisks indicate statistically significant differences compared to Kitaake samples for each time point separately (Duncan, α = 0.05). (f, g) Blocking TOR signaling with rapamycin (100 μM) or Torin2 (30 μM) restricts Xoo multiplication in wild-type plants. The two youngest fully developed leaves of 6-wk-old Kitaake plants were detached, smear-inoculated with PXO99, and floated on aqueous solutions containing DMSO or TOR inhibitors. Bacterial densities were determined at 3-d intervals. Data are means ± SD of three replicates of four pooled leaves. Asterisks indicate statistically significant differences compared to control Kitaake samples (Duncan, α = 0.05). One repetition of the experiment yielded similar results. CFU, colony forming units.
Fig. 4
Fig. 4
OsTOR conditions susceptibility towards the necrotrophic fungal pathogens Cochliobolus miyabeanus and Rhizoctonia solani. (a) T3 lines overexpressing target of rapamycin (TOR) or Raptor are less resistant to infection with C. miyabeanus strain Cm988 than wild-type Kitaake and null segregating control plants. Overexpressing TOR or Raptor also favors infection by the sheath blight pathogen R. solani (b). Data shown are means ± SD. Bars with different letters are significantly different (Mann Whitney, n ≥ 6, α = 0.05). Disease development was assessed using digital image analysis for quantification of symptomatic leaf areas. Leaves showing representative disease symptoms were photographed (a) 4 and (b) 5 d post inoculation, respectively. Experiments were repeated twice with similar results.
Fig. 5
Fig. 5
OsTOR signaling suppresses pathogen associated molecular pattern-triggered immunity (PTI). (a, b) Effect of rapamycin treatment (100 μM) on the expression of PTI marker genes in rice suspension cells treated with insoluble crab shell chitin (100 μg ml−1), Pseudomonas aeruginosa-derived lipopolysaccharides (LPS, 100 μg ml−1) or fungal xylanase (Tvx, 30 μg ml−1). Chitin-treated samples were harvested 4 h post treatment (hpt), LPS and Tvx-treatments were sampled at 4 and 24 hpt. Expression levels were measured by quantitative reverse transcription (qRT)-PCR and normalized to actin reference gene expression. Data shown are normalized to dimethyl sulfoxide (DMSO) (solvent control)-treated samples. Bars depict average expression level ± SD of two technical and two biological replicates. Different letters indicate statistically significant differences (T-test, α = 0.05). (c, d) Target of rapamycin (TOR) overexpression compromises chitin-induced resistance to the brown spot pathogen Cochliobolus miyabeanus. Detached leaves of wild-type Kitaake, an azygous control, and two independent TOR-overexpressing and Raptor RNAi lines were pretreated with insoluble chitin (200 μg ml−1) for 6 h before being challenged with C. miyabeanus strain Cm988. Disease development was assessed 4 d post inoculation using digital image analysis for quantification of symptomatic leaf areas. Data are from a representative experiment that was repeated twice with similar results. Bars with different letters are significantly different (Mann–Whitney, n ≥ 7, α = 0.05).
Fig. 6
Fig. 6
OsTOR signaling attenuates the action of the classic immune hormones salicylic acid (SA) and jasmonic acid (JA). (a) Pharmacological inhibition of target of rapamycin (TOR) signaling primes expression of SA and JA marker genes in rice cell cultures treated with supernatant of Xanthomonas oryzae pv. oryzae (Xoo) PXO99 cultures. Two milliliters suspension cells were treated with 100 μM rapamycin and/or 50 μl Xoo supernatant. Samples were harvested 6 h after treatment and analyzed by quantitative reverse transcription (qRT)-PCR. Data shown are expressed relative to dimethyl sulfoxide (DMSO) (solvent control)-treated samples. Bars depict average expression level ± SD of two technical and two biological replicates. Asterisks indicate statistically significant differences relative to DMSO-treated samples (T-test, α = 0.05). (b) Rapamycin treatment potentiates methyljasmonate (MeJA)-induced growth restriction. Pregerminated Kitaake seedlings were grown on medium containing increasing doses of MeJA in combination or not with 100 μM rapamycin. Root and shoot lengths were recorded 7 d after germination. Bars depict means ± SD. Data are from a representative experiment that was repeated twice with similar results. Different letters indicate statistically significant differences (Duncan, n = 12, α = 0.05). (c) OsTOR signaling antagonizes basal expression of SA and JA marker genes. Fourth leaves of 3-wk-old TOR RNAi, Raptor RNAi and TOR OX plants were harvested and analyzed by qRT-PCR. Data shown are expressed relative to the expression in azygous controls. Bars depict average expression level ± SD of three technical replicates. Asterisks indicate statistically significant differences (T-test, α = 0.05). (d) Quantification of endogenous JA and SA levels in TOR OX and Raptor RNAi plants. Data are means ± SD from three biological replicates, each representing a pooled sample from at least 10 individual plants. Different letters indicate statistically significant differences (Duncan, α = 0.05). (e, f) Silencing OsRaptor1 primes benzothiadiazole (BTH)- and MeJA-inducible gene expression. Wild-type Kitaake, null transgene controls and Raptor RNAi and TOR OX lines were treated with 500 μM BTH or 100 μM MeJA and sampled 8 h post treatment. Data are normalized to control-treated samples. Bars depict average expression level ± SD of two technical and two biological replicates. Asterisks indicate statistically significant differences compared to similarly treated Kitaake (T-test, α = 0.05).

References

    1. Bakshi A, Moin M, Kumar MU, Reddy AB, Ren M, Datla R, Siddiq EA, Kirti PB. Ectopic expression of Arabidopsis Target of Rapamycin (AtTOR) improves water-use efficiency and yield potential in rice. Sci Rep. 2017;7:42835. - PMC - PubMed
    1. Belkhadirl Y, Yang L, Hetzel J, Dangl JL, Chory J. The growth-defense pivot: crisis management in plants mediated by LRR-RK surface receptors. Trends in Biochemical Sciences. 2014;39(10):447–456. - PMC - PubMed
    1. Bjornson M, Dandekar AM, Chory J, Dehesh K. Brassinosteroid’s multi-modular interaction with the general stress network customizes stimulus-specific responses in Arabidopsis. Plant Science. 2016;250:165–177. - PubMed
    1. Brauc S, De Vooght E, Claeys M, Hofte M, Angenon G. Influence of over-expression of cytosolic aspartate aminotransferase on amino acid metabolism and defence responses against Botrytis cinerea infection in Arabidopsis thaliana. Journal of Plant Physiology. 2011;168(15):1813–1819. - PubMed
    1. Caldana C, Li Y, Leisse A, Zhang Y, Bartholomaeus L, Fernie AR, Willmitzer L, Giavalisco P. Systemic analysis of inducible target of rapamycin mutants reveal a general metabolic switch controlling growth in Arabidopsis thaliana. Plant Journal. 2013;73(6):897–909. - PubMed

MeSH terms