. 2017 Dec;65(12):2003-2023.
doi: 10.1002/glia.23210. Epub 2017 Sep 14.

Novel role of the nociceptin system as a regulator of glutamate transporter expression in developing astrocytes

Affiliations

Novel role of the nociceptin system as a regulator of glutamate transporter expression in developing astrocytes

Logan C Meyer et al. Glia. 2017 Dec.

Abstract

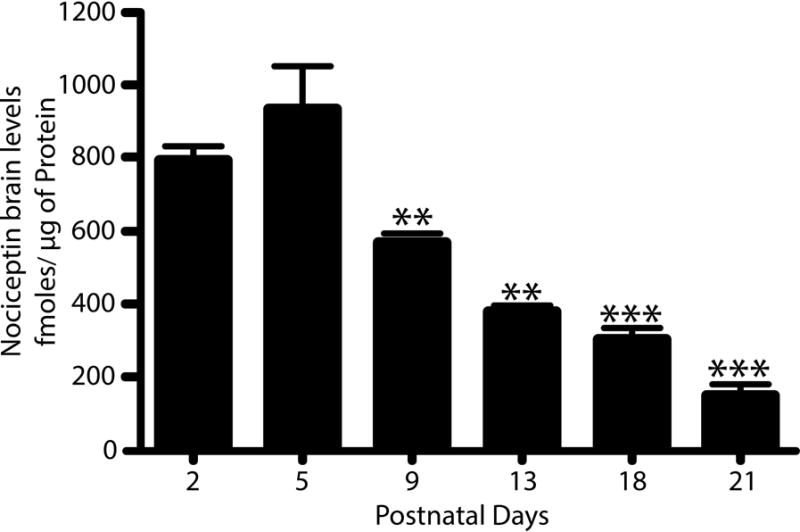
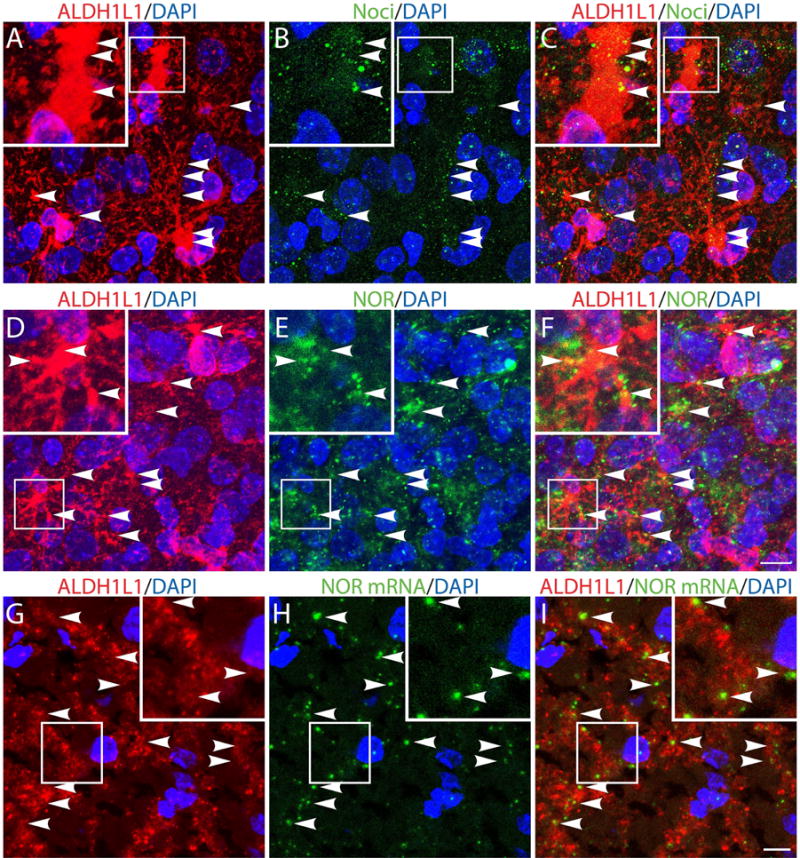
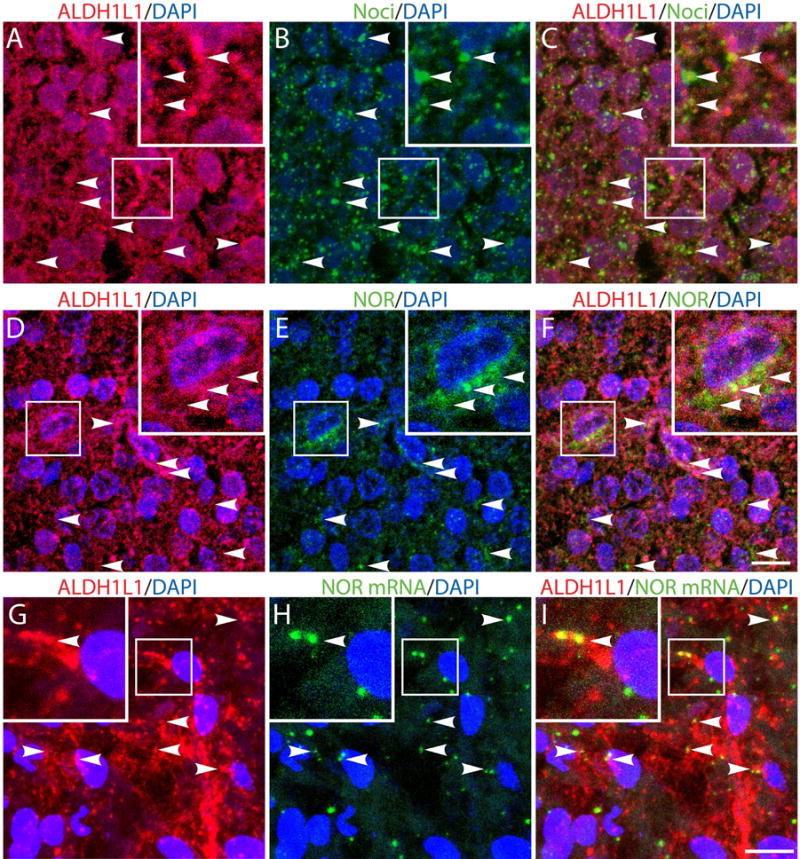
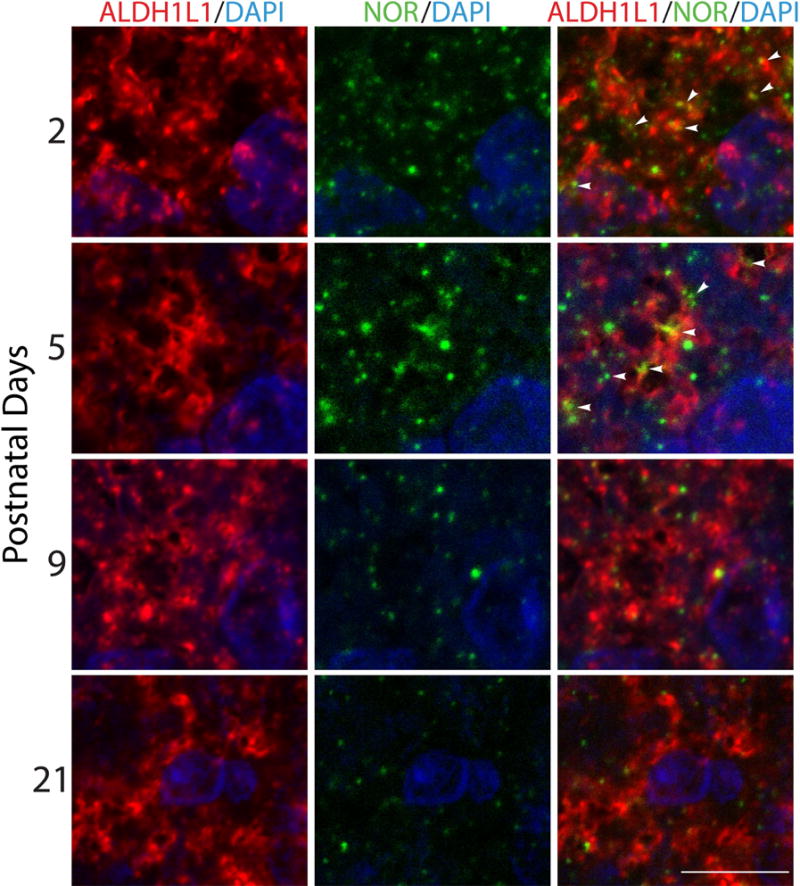
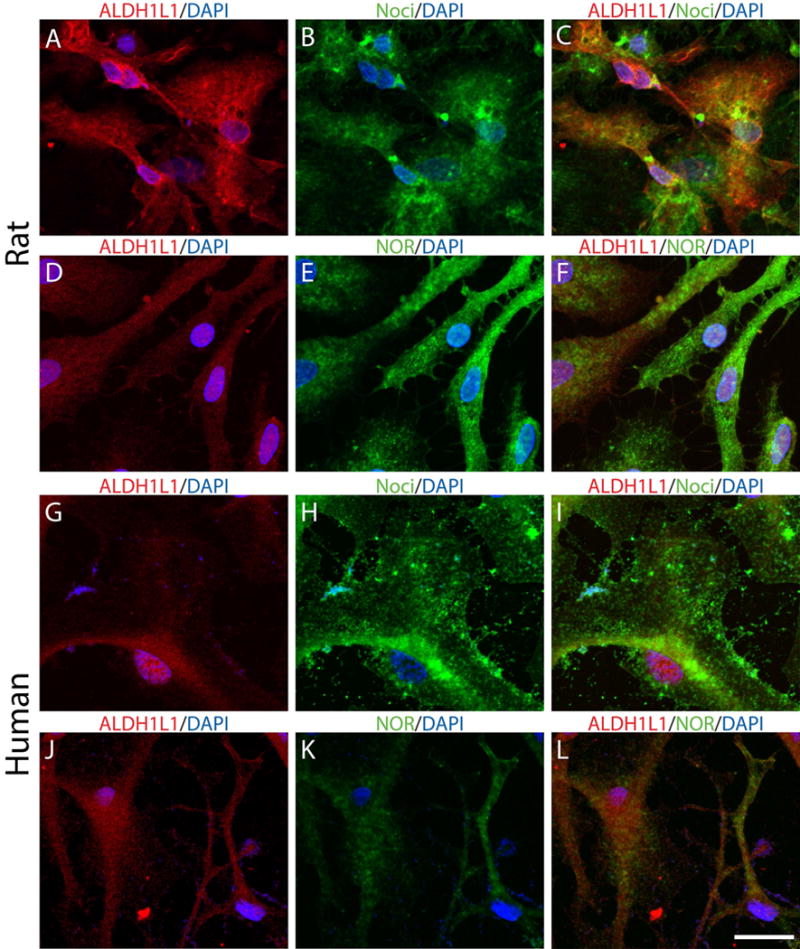
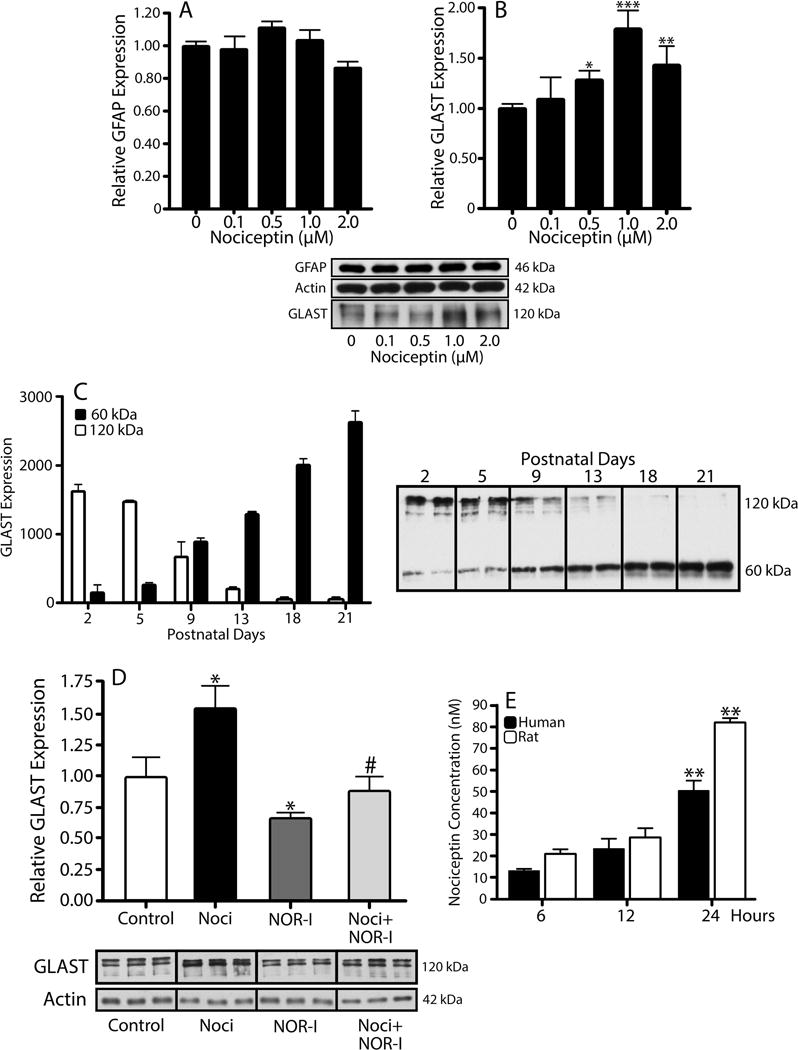
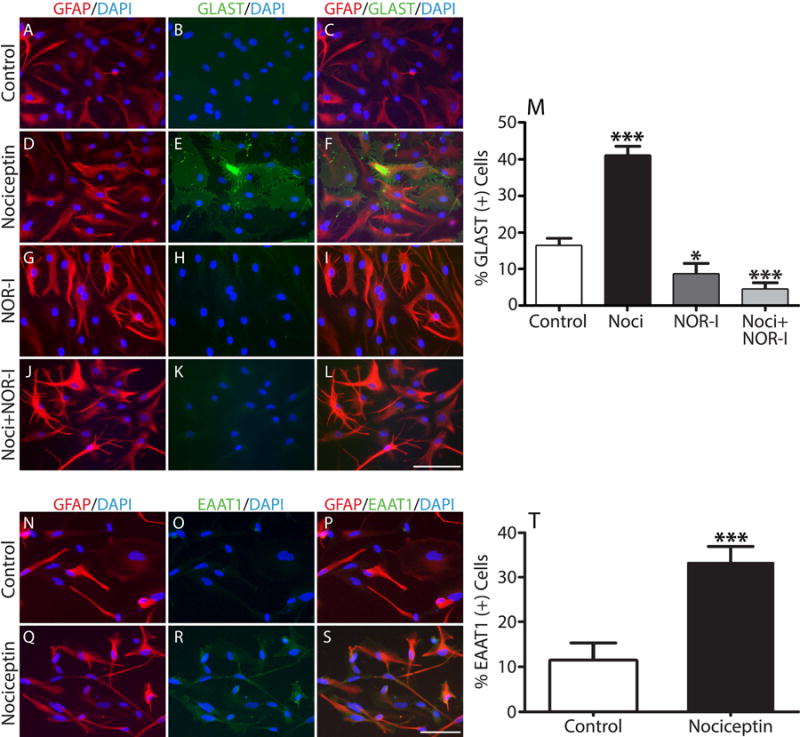
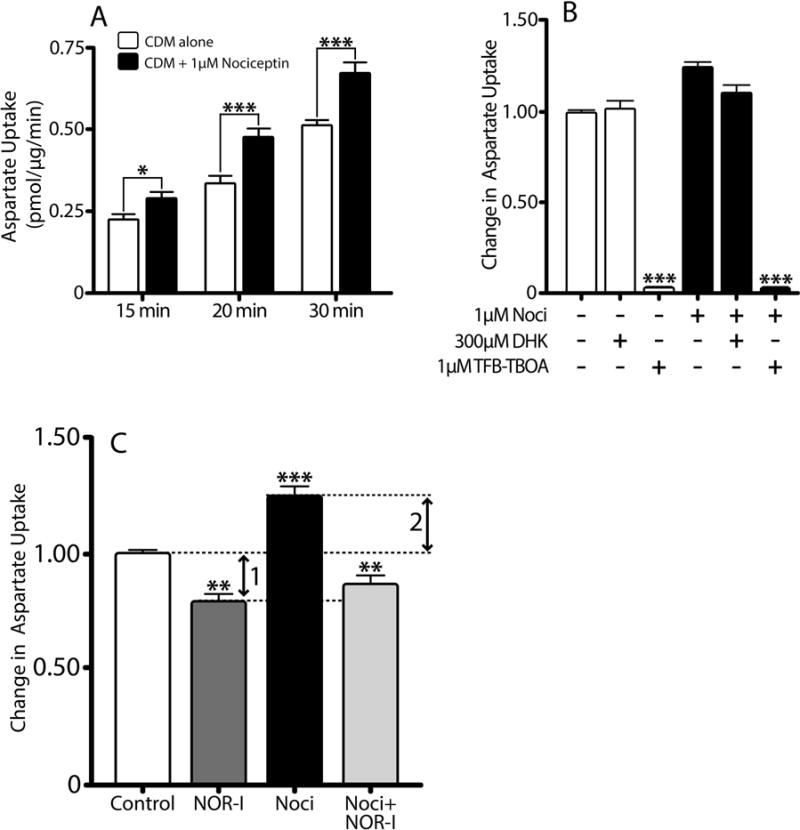
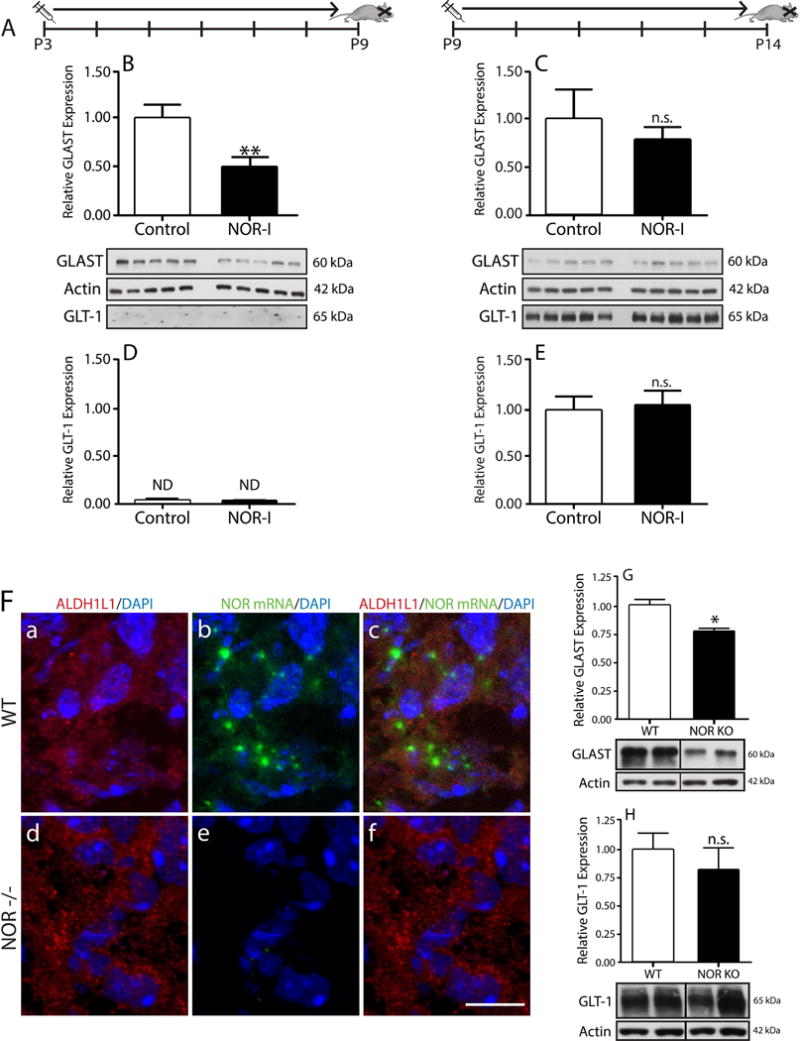
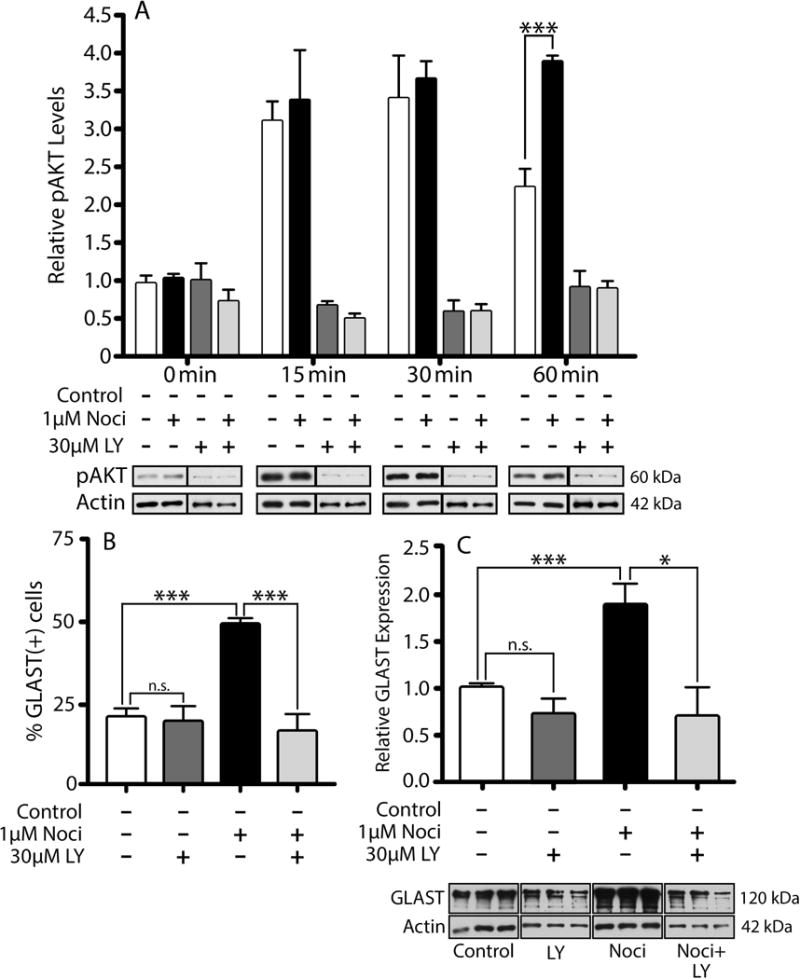
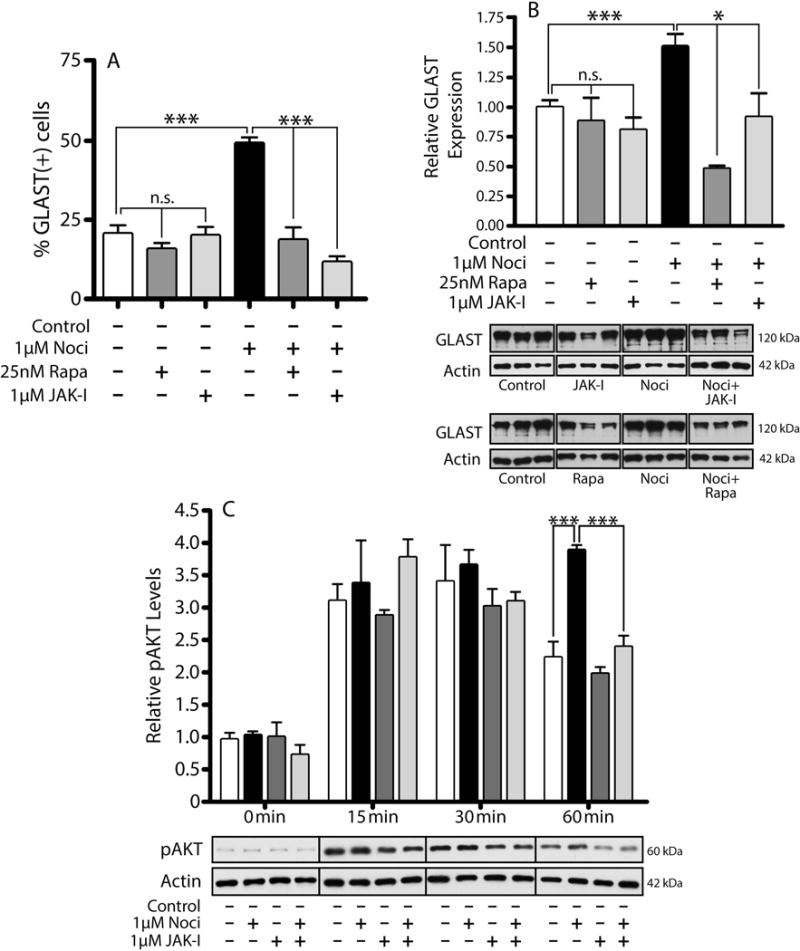
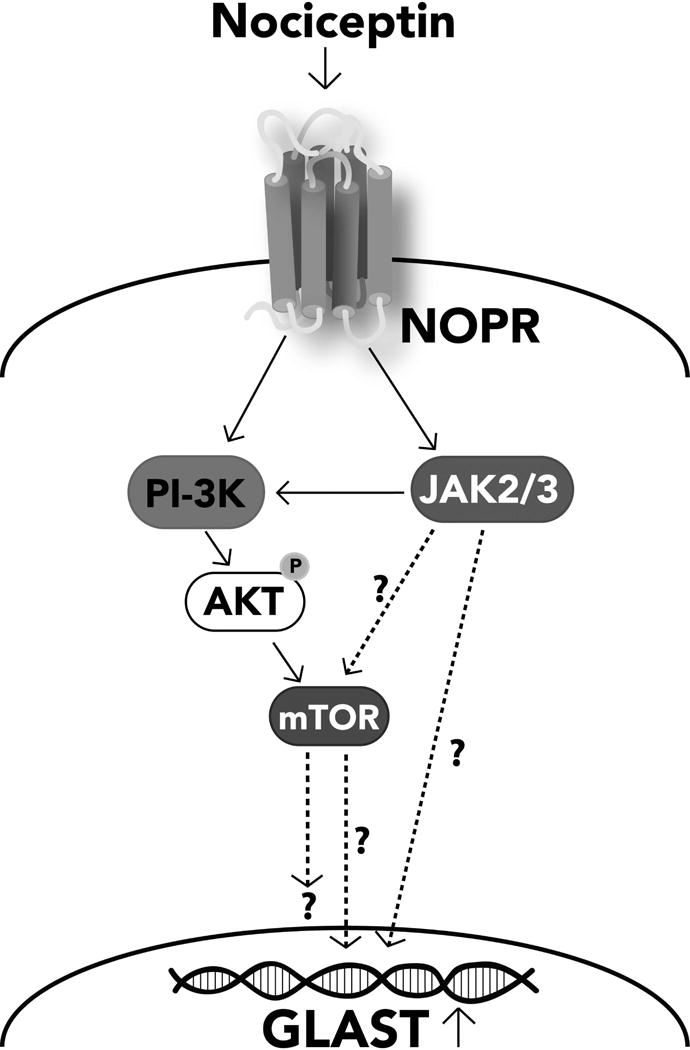
Our previous results showed that oligodendrocyte development is regulated by both nociceptin and its G-protein coupled receptor, the nociceptin/orphanin FQ receptor (NOR). The present in vitro and in vivo findings show that nociceptin plays a crucial conserved role regulating the levels of the glutamate/aspartate transporter GLAST/EAAT1 in both human and rodent brain astrocytes. This nociceptin-mediated response takes place during a critical developmental window that coincides with the early stages of astrocyte maturation. GLAST/EAAT1 upregulation by nociceptin is mediated by NOR and the downstream participation of a complex signaling cascade that involves the interaction of several kinase systems, including PI-3K/AKT, mTOR, and JAK. Because GLAST is the main glutamate transporter during brain maturation, these novel findings suggest that nociceptin plays a crucial role in regulating the function of early astrocytes and their capacity to support glutamate homeostasis in the developing brain.

Keywords: GLAST; astrocytes; brain development; glutamate transporters; nociceptin.


Figures

Figure 1
Figure 1. Postnatal brain maturation is accompanied by a progressive decrease in nociceptin expression
Nociceptin levels were measured by dot blot analysis of total homogenates prepared from cerebral hemispheres of rat pups at 2-, 5-, 9-, 13-, 18-, and 21- postnatal days. Purified nociceptin was used to generate a standard curve as indicated under “Methods”. The results, expressed as fmoles of nociceptin/μg of protein, are the average ± SEM from at least 3 animals per age, PD5 vs. PD2, not significant (n.s.); PD5 vs. PD9 and PD13, **p<0.01; PD5 vs. PD18 and PD21, ***p<0.001.
Figure 2
Figure 2. In vivo expression of nociceptin (Noci) and nociceptin receptor (NOR) in developing rat astrocytes
(A-F) Cortical brain tissue slices from 5-day-old rats were subjected to immunohistochemistry using (A and D) anti-ALDH1L1 together with (B) anti-Noci or (E) anti-NOR antibodies. (G-I) Cortical brain slices were subjected to immunohistochemical staining with (G) anti-ALDH1L1 antibody and to in situ hybridization using (H) a digoxigenin-labeled probe for NOR mRNA, as indicated under “Methods”. Notice the presence of nociceptin (C), NOR protein (F) and NOR mRNA in the ALDH1L1-labeled astrocytes (I). Nuclei were counterstained with DAPI. Scale bar: 10μm. Controls for immunocytochemistry using the appropriate normal sera as well as in situ hybridization controls using nonsense deoxyoligonucleotide probes are shown in Supplemental Figures 1 and 2, respectively.
Figure 3
Figure 3. In vivo expression of nociceptin (Noci) and nociceptin receptor (NOR) in developing human astrocytes
(A-F) Gestational week 23, fetal cortical brain tissue slices were subjected to immunohistochemistry using (A and D) anti-ALDH1L1 together with (B) anti-Noci or (E) anti-NOR antibodies. (G-I) Cortical brain slices were subjected to immunohistochemical staining with (G) anti-ALDH1L1 antibody and to in situ hybridization using (H) a digoxigenin-labeled probe for NOR mRNA, as indicated under “Methods”. Notice the presence of nociceptin (C), NOR protein (F) and NOR mRNA in the ALDH1L1-labeled astrocytes (I). Scale bar: 10μm. Controls for immunocytochemistry using the appropriate normal sera as well as in situ hybridization controls using nonsense deoxyoligonucleotide probes are shown in Supplemental Figures 1 and 2, respectively.
Figure 4
Figure 4. Astrocytic NOR expression during postnatal rat brain development
Cortical tissue slices from 2-, 5-, 9-, and 21-postnatal day rat pups were subjected to immunohistochemistry with anti-ALDH1L1 (red) and anti-NOR (green) antibodies to assess astrocytic NOR localization throughout postnatal development. Notice that NOR expression in astrocytes is developmentally regulated and decreases with brain maturation. Scale bar: 10μm.
Figure 5
Figure 5. Nociceptin and NOR are present in cultured primary human and rat brain astrocytes
(A-F) Primary rat astrocytes were cultured in chemically defined medium (CDM). Immunocytochemistry was used to analyze the expression of (A and D) ALDH1L1 together with (B) nociceptin or (E) NOR. (G-L) Primary human astrocytes were also cultured in CDM alone and similarly stained for (G and J) ALDH1L1 and (H) nociceptin or (K) NOR expression. Scale Bar: 50μm.
Figure 6
Figure 6. Treatment of astrocytes with nociceptin results in a dose-dependent increase in GLAST expression
Astrocytes isolated from 3-day-old rat brains were treated for 24 hrs with increasing concentrations of nociceptin. (A) GFAP and (B) GLAST expression were evaluated by western blot analysis, using β-actin as loading control. Results are expressed as change relative to control values and represent the mean ± SEM, n=3, *p<0.05, **p<0.01, ***p<0.001. (C) GLAST levels in total brain homogenates from 2-, 5-, 9-, 13-, 18-, and 21-day-old rats were determined using western blot. Each gel lane was loaded with 5μg of protein and levels for the 60 kDa (black bars) and 120 kDa (open bars) molecular forms of GLAST correspond to the mean ± SEM from 3 animals per age. (D) Western blot analysis was used to determine relative GLAST levels after a 24 hr incubation in CDM alone, 1μM nociceptin (Noci), 100nM BAN-ORL24 (NOR-I), or 1μM Noci + 100nM NOR-I. The results are expressed as change relative to control values and represent the mean ± SEM from at least 3 experiments; control vs. Noci and control vs. NOR-I, *p<0.05; Noci vs. Noci + NOR-I, #p<0.03. (E) Secretion of endogenous nociceptin was assessed by dot blot analysis of medium collected from cultured rat (open bars) and human (black bars) astrocytes after 6, 12, and 24 hrs in CDM alone. The results are the mean ± SEM from 6 different cultures. Rat, 6 hrs and 12 hrs vs. 24 hrs, **p<0.01. Human, 6 hrs vs. 24 hrs, **p<0.01.
Figure 7
Figure 7. GLAST/EAAT1 expression increases after nociceptin treatment in both rat and human developing astrocytes
(A-L) Immunocytochemistry with anti-GFAP (red) and anti-GLAST/EAAT1 (green) antibodies was used to evaluate GLAST expression in cultures treated for 24 hrs with (A-C) CDM alone (controls), (D-F) 1μM nociceptin, (G-I) 100nM NOR-I or (J-L) 100nM NOR-I + 1μM nociceptin. Scale Bar: 100μm. (M) Determination of GLAST(+) cells as % of GFAP(+) cells/field. Results are the mean ± SEM from 4 independent experiments in which ten fields/well, 3 wells/condition, containing approximately 100 cells per field were analyzed. Control vs. Noci, *** p<0.001; control vs. NOR-I, * p<0.05; Noci vs. Noci + NOR-I, *** p<0.001. (N-T) Immunocytochemistry of developing human fetal astrocytes with anti-GFAP (red) and anti-GLAST/EAAT1 (green) antibodies. Cells were incubated for 24 hrs in (N-P) CDM alone or (Q-S) CDM supplemented with 1μM nociceptin. Scale Bar: 100μm. (T) Determination of EAAT1(+) cells as % of GFAP(+) cells/field. Results are the mean ± SEM from 3 independent experiments in which ten fields/well, 3 wells/condition, containing approximately 100 cells per field were analyzed, control vs. nociceptin, *** p<0.001.
Figure 8
Figure 8. 3H-Aspartate uptake increases in primary rat astrocytes treated with nociceptin
(A) Aspartate uptake in primary rat astrocytes after 24 hr pre-incubation in CDM alone (controls, open bars) or CDM with 1μM nociceptin (black bars) was determined using a 3H-D-aspartate uptake assay, as described under Methods. Results expressed as pmol/μg protein/min and are the mean ± SEM from at least 10 replicates/condition, *p<0.05, ***p<0.001. (B) Aspartate uptake was assessed in cell cultures after 24 hours pre-treatment in CDM alone (white bars) or CDM supplemented with 1μM nociceptin (black bars). Prior to the assay, parallel controls and nociceptin-treated cultures were in addition pre-incubated for 10 min with either 300μM DHK or 1μM TFB-TBOA. Results are expressed as change in uptake over 30 min and represent the mean ± SEM from at least six replicates/condition, control vs control with TFB-TBOA and nociceptin vs. nociceptin with TFB-TBOA, ***p<0.0001. (C) Aspartate uptake was assessed in primary rat cultures treated for 24 hrs with CDM alone (control), or CDM supplemented with either 100nM NOR-I, 1μM nociceptin, or 1μM nociceptin with 100nM NOR-I. Results are expressed as change in uptake over 30 min and represent the mean ± SEM from at least six replicates/condition. Control vs. NOR-I, **p<0.01; control vs. nociceptin, ***p<0.001; nociceptin vs. nociceptin with NOR-I, ***p<0.001. Arrow 1: aspartate uptake due to endogenously produced nociceptin. Arrow 2: aspartate uptake due to exogenously added nociceptin.
Figure 9
Figure 9. In vivo treatment with an NOR inhibitor or genetic ablation of NOR affect GLAST brain expression
(A) Rat pups were given daily IP injections of BAN-ORL24 (NOR-I) on two different timelines: from postnatal day 3 to 9, or postnatal day 9 to 14. Total homogenates prepared from brains collected at the end of each timeline were subjected to western blot analysis for GLAST and GLT-1. (B and C) GLAST expression in total brain homogenates of animals injected from (B) postnatal day 3 to 9 and (C) postnatal day 9 to 14. (D and E) GLT-1 levels in brain homogenates from pups injected from (D) postnatal day 3 to 9 and (E) postnatal day 9 to 14. The results are expressed as change relative to control values and represent the mean ± SEM from at least 5 animals. **p<0.01; n.s., not significant; ND, not detected. (F) 5-day-old WT and NOR KO mouse cortical brain tissue slices were subjected to immunohistochemical staining with (a and d) anti-ALDH1L1 antibody and in situ hybridization using (b and e) a digoxigenin-labeled probe for NOR mRNA, as indicated under “Methods”. Notice the presence of NOR mRNA in ALDH1L1-labeled astrocytes in WT mice (a-c) and lack of NOR mRNA in the NOR KO animals (d-f). Scale bar: 10μm. (G and H) Total brain homogenates from 14-day-old WT and NOR knockout mice were subjected to western blot analysis to evaluate expression of (G) GLAST and (H) GLT-1, using β-actin as loading control. Results are represented as change relative to WT and are the mean ± SEM from 4 animals, * p<0.01.
Figure 10
Figure 10. Involvement of PI-3K/AKT in the nociceptin-dependent upregulation of GLAST expression
(A) Astrocyte cultures were first pre-incubated for 2 hrs in DMEM-F12 alone; and then for increasing times (0-60 min) in CDM alone (white bars), CDM with 1μM nociceptin (Noci), CDM with 30μM LY294002 (LY) (PI-3K inhibitor) or CDM with 1μM Noci and 30μM LY. Cell lysates were then subjected to western blot analysis with anti-phosphorylated AKT (pAKT) antibody. The results are the mean ± SEM from 3 different cultures; control vs. Noci at 60 min, ***p<0.001. (B) Immunocytochemistry was used to evaluate GLAST expression in rat astrocytes after a 24 hr treatment with CDM alone, or CDM supplemented with one of the following: 1μM Noci, 30μM LY, or 1μM Noci + 30μM LY. The bar graph shows the number of GLAST positive cells as a % of the GFAP(+) cells/field under each condition. Results are the mean ± SEM from twelve fields/well, 3 wells/condition. Control vs. LY, n.s.; control vs. Noci,***p<0.001; Noci vs. Noci + LY, ***p<0.001. (C) Astrocytes treated for 24 hrs as in (B), were subjected to western blot analysis for GLAST. GLAST levels in the bar graph are expressed as change relative to control values. The results are the mean ± SEM, n=3, Control vs. LY, n.s.; control vs. Noci,***p<0.001; Noci vs. Noci + LY, ***p<0.05.
Figure 11
Figure 11. The nociceptin dependent upregulation of GLAST is also mediated by mTOR and JAK signaling complexes
(A) Immunocytochemistry was used to evaluate GLAST expression in rat astrocytes after a 24 hr incubation in CDM alone, or CDM supplemented with one of the following: 25nM Rapamycin (Rapa), 1μM JAK Inhibitor I (JAK-I), 1μM Noci, 1μM Noci + 25nM Rapa, or 1μM Noci + 1μM JAK-I. The bar graph shows the number of GLAST positive cells as a % of the GFAP(+) cells/field under each condition. Results are the mean ± SEM from twelve fields/well, 3 wells/condition. Control vs. Rapa and JAK-I, n.s.; control vs. Noci ***p<0.001; Noci vs. Noci + Rapa and Noci + JAK-I, ***p<0.001. (B) Astrocytes treated for 24 hrs in the conditions listed above, were subjected to western blot analysis for GLAST. GLAST levels in the bar graph are expressed as change relative to control values. The results are the mean ± SEM, n=3. Control vs. Rapa and JAK-I, n.s.; control vs. Noci ***p<0.001; Noci vs. Noci + Rapa and Noci + JAK-I, *p<0.05. (C) Astrocyte cultures were first pre-incubated for 2 hrs in DMEM-F12 alone; and then for increasing times (0-60 min) in CDM alone, CDM + 1μM Noci, CDM + 1μM JAK-I, or CDM + 1μM Noci + 1μM JAK-I. Cell lysates were then subjected to western blot analysis for pAKT. The results are expressed as change relative to control and are the mean ± SEM from 3 different cultures; control vs. Noci at 60 min, ***p<0.001; controls vs. JAK-I, n.s.; Noci vs. Noci + JAK-I, ***p<0.001.
Figure 12
Figure 12. Proposed signaling pathway of nociceptin-mediated GLAST expression
The effects of different inhibitors (Figs. 10 and 11) indicate that nociceptin effects on GLAST expression are mediated by a signaling cascade that involves the interaction of PI-3K/AKT, mTOR and JAK. Solid lines represent experimentally supported interactions. Dashed arrows represent possible interactions that require further investigation.

Similar articles

Cited by

References

    1. Aparicio LC, Candeletti S, Binaschi A, Mazzuferi M, Mantovani S, Di Benedetto M, Landuzzi D, Lopetuso G, Romualdi P, Simonato M. Kainate seizures increase nociceptin/orphanin FQ release in the rat hippocampus and thalamus: A microdialysis study. J Neurochem. 2004;91:30–37. - PubMed
    1. Aschner M. Neuron-astrocyte interactions: implications for cellular energetics and antioxidant levels. Neurotoxicology. 2000;21:1101–7. - PubMed
    1. Bar-Peled O, Ben-Hur H, Biegon A, Groner Y, Dewhurst S, Furuta A, Rothstein JD. Distribution of glutamate transporter subtypes during human brain development. J Neurochem. 1997;69:2571–80. - PubMed
    1. Bayrakdar ET, Bojnik E, Armagan G, Kanit L, Benyhe S, Borsodi A, Yalcin A. Kainic acid-induced seizure activity alters the mRNA expression and G-protein activation of the opioid/nociceptin receptors in the rat brain cortex. Epilepsy Res. 2013;105:13–19. - PubMed
    1. Behar TN, Scott CA, Greene CL, Wen X, Smith SV, Maric D, Liu Q-YY, Colton CA, Barker JL. Glutamate Acting at NMDA Receptors Stimulates Embryonic Cortical Neuronal Migration. J Neurosci. 1999;19:4449–4461. - PMC - PubMed

MeSH terms