

Quality of Care in the United States Territories, 1999-2012
- PMID: 28906314
- PMCID: PMC6482857
- DOI: 10.1097/MLR.0000000000000797
Quality of Care in the United States Territories, 1999-2012
Abstract
Background: Millions of Americans live in the US territories, but health outcomes and payments among Medicare beneficiaries in these territories are not well characterized.
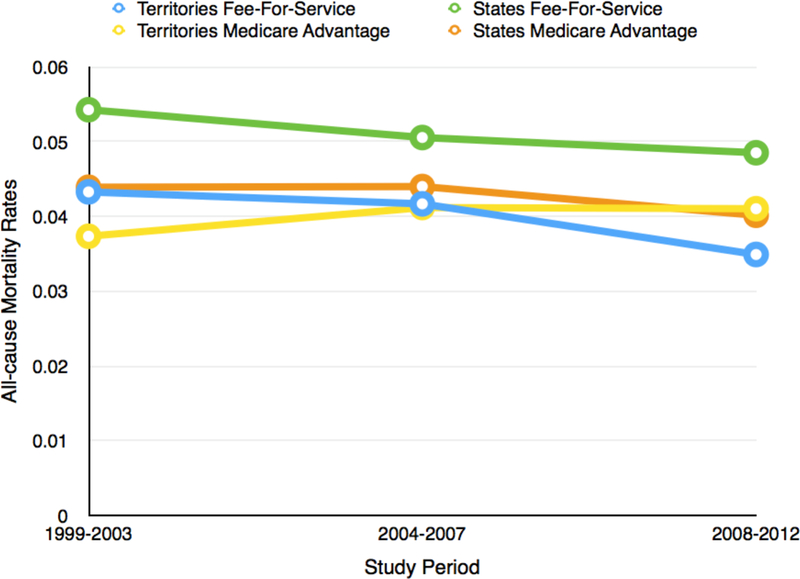
Methods: Among Fee-for-Service Medicare beneficiaries aged 65 years and older hospitalized between 1999 and 2012 for acute myocardial infarction (AMI), heart failure (HF), and pneumonia, we compared hospitalization rates, patient outcomes, and inpatient payments in the territories and states.
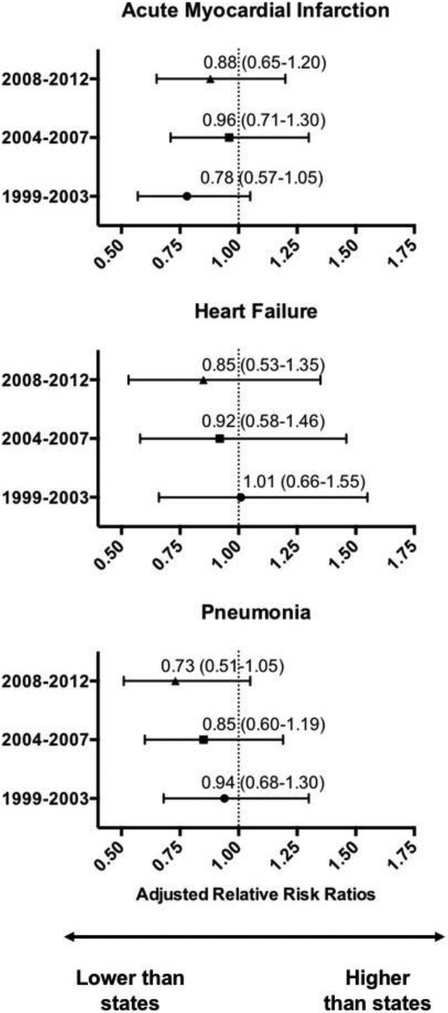
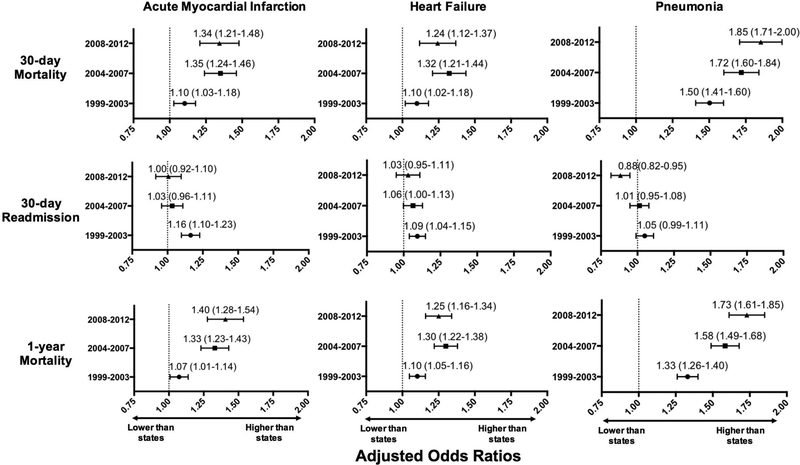
Results: Over 14 years, there were 4,350,813 unique beneficiaries in the territories and 402,902,615 in the states. Hospitalization rates for AMI, HF, and pneumonia declined overall and did not differ significantly. However, 30-day mortality rates were higher in the territories for all 3 conditions: in the most recent time period (2008-2012), the adjusted odds of 30-day mortality were 1.34 [95% confidence interval (CI), 1.21-1.48], 1.24 (95% CI, 1.12-1.37), and 1.85 (95% CI, 1.71-2.00) for AMI, HF, and pneumonia, respectively; adjusted odds of 1-year mortality were also higher. In the most recent study period, inflation-adjusted Medicare in-patient payments, in 2012 dollars, were lower in the territories than the states, at $9234 less (61% lower than states), $4479 less (50% lower), and $4403 less (39% lower) for AMI, HF, and pneumonia hospitalizations, respectively (P<0.001 for all).
Conclusions and relevance: Among Medicare Fee-for-Service beneficiaries, in 2008-2012 mortality rates were higher, or not significantly different, and hospital reimbursements were lower for patients hospitalized with AMI, HF, and pneumonia in the territories. Improvement of health care and policies in the territories is critical to ensure health equity for all Americans.
Conflict of interest statement
Conflicts of Interest/Financial Disclosure
Dr. Krumholz chairs a cardiac scientific advisory board for UnitedHealth, is a participant/participant representative of the IBM Watson Health Life Sciences Board, and is the founder of Hugo, a personal health information platform. Dr. Ross receives support from the Blue Cross and Blue Shield Association for projects to better understand medical technology, and from the Laura and John Arnold Foundation to support the Collaboration on Research Integrity and Transparency (CRIT) at Yale. Drs. Ross and Krumholz are the recipients of research agreements from Medtronic and from Johnson & Johnson (Janssen), through Yale University, to develop methods of clinical trial data sharing and from Medtronic and the Food and Drug Administration, through Yale University, to develop methods for post-market surveillance of medical devices. Drs. Krumholz, Ross, and Normand work under contract to the Centers for Medicare & Medicaid Services to develop and maintain performance measures. Dr. Masoudi has a contract with the American College of Cardiology as the Senior Medical Officer of the National Cardiovascular Data Registries. The other authors do not have disclosures to report.
Figures
References
-
- Social Security Administration. Annual statistical supplement to the Social Security bulletin, 2013. Washington, DC: Social Security Administration, February 2014
-
- United States Government Accountability Office. U.S. Insular Areas: multiple factors affect federal health care funding: report to Congressional requesters. United States Government Accountability Office; 2005
-
- Gutierrez N Understanding health care disparities in the U.S. territories. Arch Intern Med 2011;171:1579–1581. - PubMed
-
- H.R.3966 - Territories Medicare Prescription Drug Assistance Equity Act of 2014. Available at: https://www.congress.gov/bill/113th-congress/house-bill/3966. Accessed June 2, 2016.
MeSH terms
Grants and funding
LinkOut - more resources
Full Text Sources
Other Literature Sources
Medical
Research Materials
Miscellaneous
