

Stereolithographic printing of ionically-crosslinked alginate hydrogels for degradable biomaterials and microfluidics
- PMID: 28906525
- PMCID: PMC5636682
- DOI: 10.1039/c7lc00694b
Stereolithographic printing of ionically-crosslinked alginate hydrogels for degradable biomaterials and microfluidics
Abstract
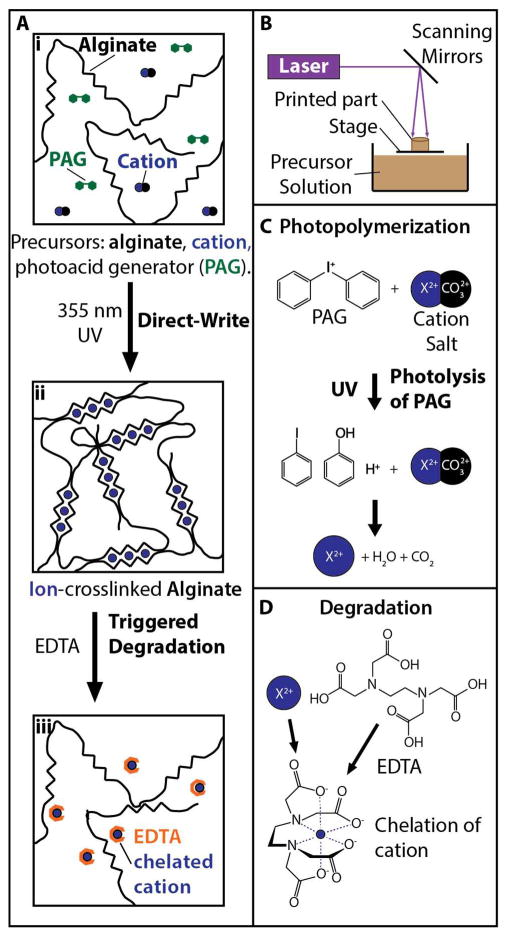
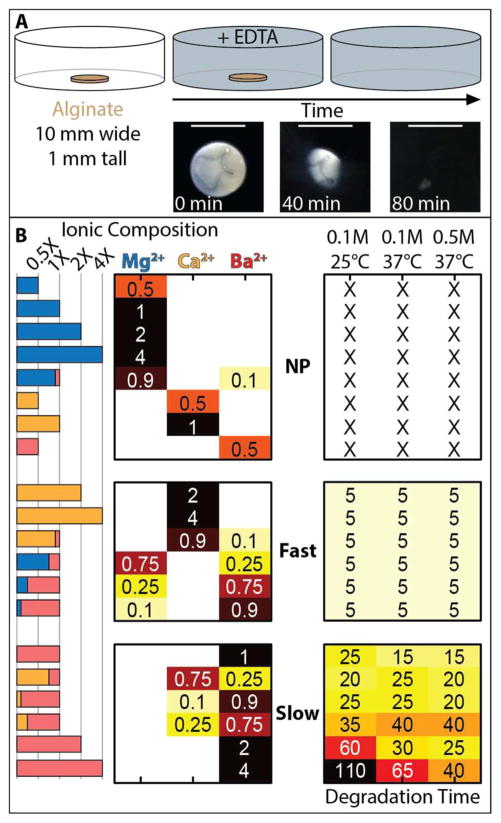
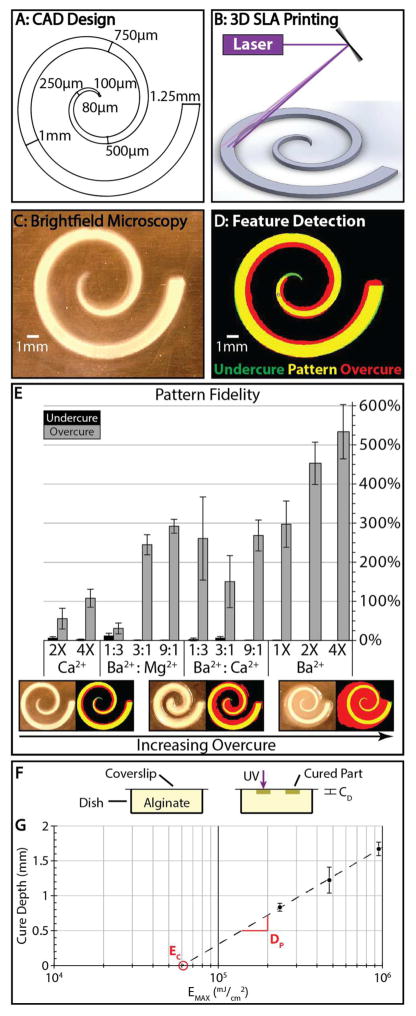
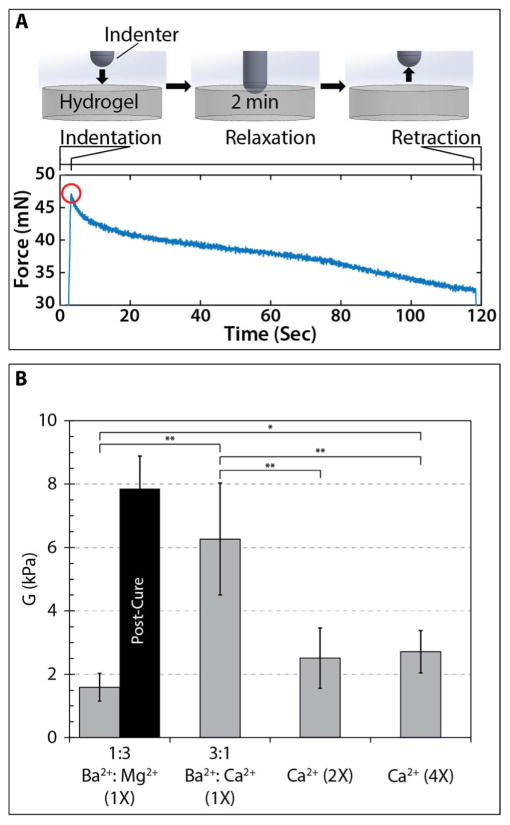
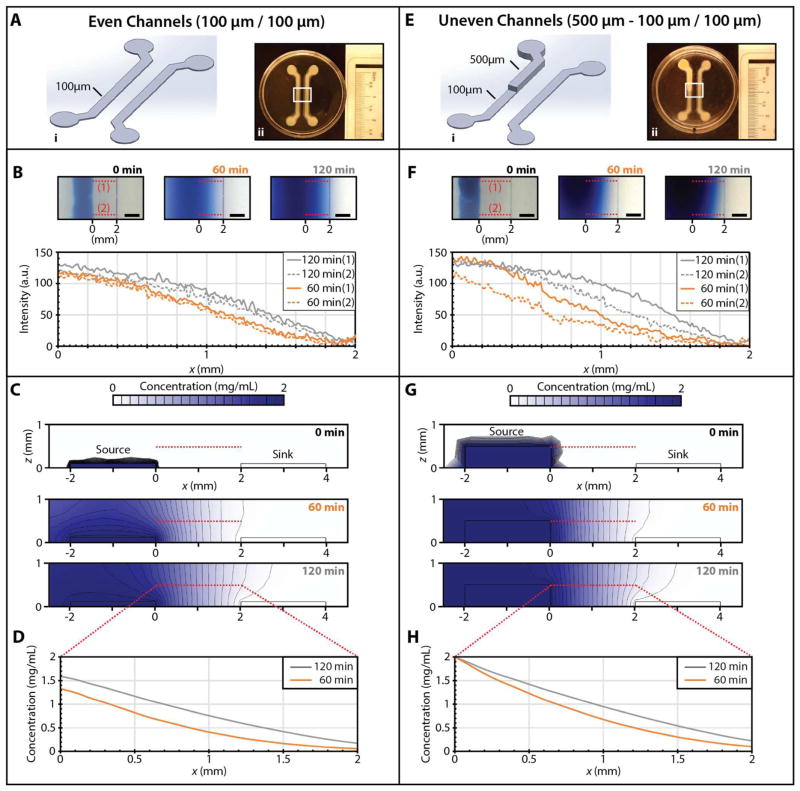
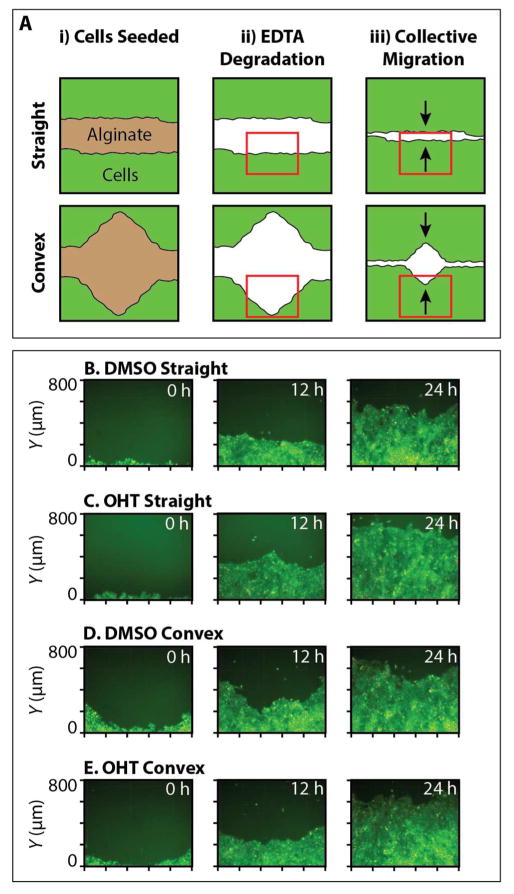
3D printed biomaterials with spatial and temporal functionality could enable interfacial manipulation of fluid flows and motile cells. However, such dynamic biomaterials are challenging to implement since they must be responsive to multiple, biocompatible stimuli. Here, we show stereolithographic printing of hydrogels using noncovalent (ionic) crosslinking, which enables reversible patterning with controlled degradation. We demonstrate this approach using sodium alginate, photoacid generators and various combinations of divalent cation salts, which can be used to tune the hydrogel degradation kinetics, pattern fidelity, and mechanical properties. This approach is first utilized to template perfusable microfluidic channels within a second encapsulating hydrogel for T-junction and gradient devices. The presence and degradation of printed alginate microstructures were further verified to have minimal toxicity on epithelial cells. Degradable alginate barriers were used to direct collective cell migration from different initial geometries, revealing differences in front speed and leader cell formation. Overall, this demonstration of light-based 3D printing using non-covalent crosslinking may enable adaptive and stimuli-responsive biomaterials, which could be utilized for bio-inspired sensing, actuation, drug delivery, and tissue engineering.
Figures

Similar articles
-
Engineering interconnected 3D vascular networks in hydrogels using molded sodium alginate lattice as the sacrificial template.Lab Chip. 2014 Aug 7;14(15):2709-16. doi: 10.1039/c4lc00069b. Epub 2014 Jun 2. Lab Chip. 2014. PMID: 24887141
-
Investigation of cell viability and morphology in 3D bio-printed alginate constructs with tunable stiffness.J Biomed Mater Res A. 2017 Apr;105(4):1009-1018. doi: 10.1002/jbm.a.35971. Epub 2017 Feb 1. J Biomed Mater Res A. 2017. PMID: 27935198
-
Development of a novel alginate-polyvinyl alcohol-hydroxyapatite hydrogel for 3D bioprinting bone tissue engineered scaffolds.J Biomed Mater Res A. 2017 May;105(5):1457-1468. doi: 10.1002/jbm.a.36036. Epub 2017 Feb 25. J Biomed Mater Res A. 2017. PMID: 28187519
-
Hydrogels for in vivo-like three-dimensional cellular studies.Wiley Interdiscip Rev Syst Biol Med. 2012 Jul-Aug;4(4):351-65. doi: 10.1002/wsbm.1174. Epub 2012 May 21. Wiley Interdiscip Rev Syst Biol Med. 2012. PMID: 22615143 Review.
-
Alginate based hydrogel as a potential biopolymeric carrier for drug delivery and cell delivery systems: present status and applications.Curr Drug Deliv. 2012 Nov;9(6):539-55. doi: 10.2174/156720112803529800. Curr Drug Deliv. 2012. PMID: 22998675 Review.
Cited by
-
Modeling Neurovascular Disorders and Therapeutic Outcomes with Human-Induced Pluripotent Stem Cells.Front Bioeng Biotechnol. 2018 Jan 30;5:87. doi: 10.3389/fbioe.2017.00087. eCollection 2017. Front Bioeng Biotechnol. 2018. PMID: 29441348 Free PMC article. Review.
-
Facile Photopatterning of Perfusable Microchannels in Synthetic Hydrogels to Recreate Microphysiological Environments.Adv Mater. 2023 Dec;35(52):e2306765. doi: 10.1002/adma.202306765. Epub 2023 Nov 22. Adv Mater. 2023. PMID: 37775089 Free PMC article.
-
Shaping and Patterning Supramolecular Materials─Stem Cell-Compatible Dual-Network Hybrid Gels Loaded with Silver Nanoparticles.ACS Biomater Sci Eng. 2022 May 9;8(5):1829-1840. doi: 10.1021/acsbiomaterials.1c01560. Epub 2022 Apr 1. ACS Biomater Sci Eng. 2022. PMID: 35364810 Free PMC article.
-
Application of Microfluidic Chip Technology in Food Safety Sensing.Sensors (Basel). 2020 Mar 24;20(6):1792. doi: 10.3390/s20061792. Sensors (Basel). 2020. PMID: 32213909 Free PMC article. Review.
-
Facile photopatterning of perfusable microchannels in hydrogels for microphysiological systems.Nat Protoc. 2025 Jan;20(1):272-292. doi: 10.1038/s41596-024-01041-8. Epub 2024 Sep 12. Nat Protoc. 2025. PMID: 39266725 Review.
References
Publication types
MeSH terms
Substances
Grants and funding
LinkOut - more resources
Full Text Sources
Other Literature Sources