

Rates and Trends of Pediatric Acute Lymphoblastic Leukemia - United States, 2001-2014
- PMID: 28910269
- PMCID: PMC5657918
- DOI: 10.15585/mmwr.mm6636a3
Rates and Trends of Pediatric Acute Lymphoblastic Leukemia - United States, 2001-2014
Abstract
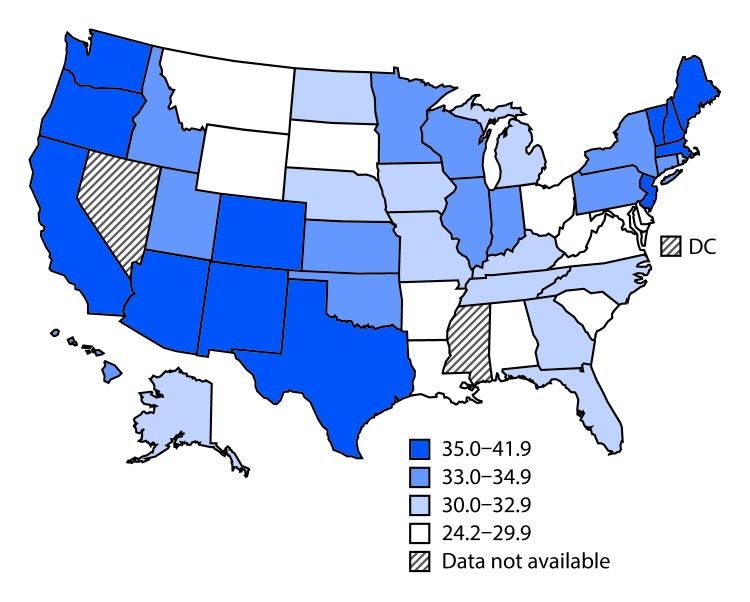
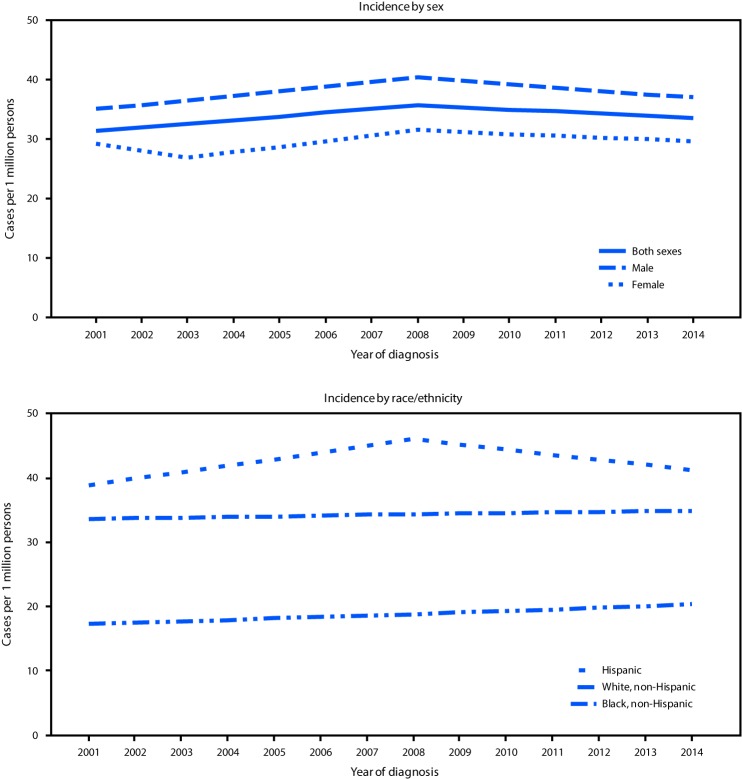
Acute lymphoblastic leukemia (ALL) is the most prevalent cancer among children and adolescents in the United States, representing 20% of all cancers diagnosed in persons aged <20 years, or >3,000 new cases each year (1). Past studies reported increasing trends of ALL overall and among Hispanics, but these represented ≤28% of the U.S. population and did not provide state-based estimates (1-3). To describe U.S. ALL incidence rates and trends among persons aged <20 years during 2001-2014, CDC analyzed rigorous data (based on established publication criteria) from the United States Cancer Statistics data set, which includes incidence data on approximately 15,000 new cases per year of all types of invasive cancer among children and adolescents aged <20 years (4). The data set represented 98% of the U.S. population during the study period. Overall incidence of pediatric ALL during 2001-2014 was 34.0 cases per 1 million persons and among all racial/ethnic groups was highest among Hispanics (42.9 per 1 million). Both overall and among Hispanics, pediatric ALL incidence increased during 2001-2008 and remained stable during 2008-2014. ALL incidence was higher in the West than in any other U.S. Census region. State-specific data indicated that the highest rates of pediatric ALL incidence were in California, New Mexico, and Vermont. These demographic and geographic ALL incidence data might better inform public health interventions targeting the following areas: exposures to recognized risk factors for leukemia; ALL treatment, including clinical trial enrollment; survivorship care planning; and studies designed to understand the factors affecting changes in pediatric cancer incidence.
Conflict of interest statement
Figures
References
-
- US Cancer Statistics Working Group; CDC; National Cancer Institute. United States cancer statistics: 1999–2014 incidence and mortality web-based report. Atlanta, GA: US Department of Health and Human Services, CDC; 2017. https://www.cdc.gov/uscs
MeSH terms
LinkOut - more resources
Full Text Sources
Other Literature Sources
Miscellaneous
