A quantitative systems pharmacology approach, incorporating a novel liver model, for predicting pharmacokinetic drug-drug interactions
- PMID: 28910306
- PMCID: PMC5598964
- DOI: 10.1371/journal.pone.0183794
A quantitative systems pharmacology approach, incorporating a novel liver model, for predicting pharmacokinetic drug-drug interactions
Abstract
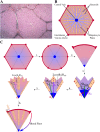
All pharmaceutical companies are required to assess pharmacokinetic drug-drug interactions (DDIs) of new chemical entities (NCEs) and mathematical prediction helps to select the best NCE candidate with regard to adverse effects resulting from a DDI before any costly clinical studies. Most current models assume that the liver is a homogeneous organ where the majority of the metabolism occurs. However, the circulatory system of the liver has a complex hierarchical geometry which distributes xenobiotics throughout the organ. Nevertheless, the lobule (liver unit), located at the end of each branch, is composed of many sinusoids where the blood flow can vary and therefore creates heterogeneity (e.g. drug concentration, enzyme level). A liver model was constructed by describing the geometry of a lobule, where the blood velocity increases toward the central vein, and by modeling the exchange mechanisms between the blood and hepatocytes. Moreover, the three major DDI mechanisms of metabolic enzymes; competitive inhibition, mechanism based inhibition and induction, were accounted for with an undefined number of drugs and/or enzymes. The liver model was incorporated into a physiological-based pharmacokinetic (PBPK) model and simulations produced, that in turn were compared to ten clinical results. The liver model generated a hierarchy of 5 sinusoidal levels and estimated a blood volume of 283 mL and a cell density of 193 × 106 cells/g in the liver. The overall PBPK model predicted the pharmacokinetics of midazolam and the magnitude of the clinical DDI with perpetrator drug(s) including spatial and temporal enzyme levels changes. The model presented herein may reduce costs and the use of laboratory animals and give the opportunity to explore different clinical scenarios, which reduce the risk of adverse events, prior to costly human clinical studies.
Conflict of interest statement
Figures


Similar articles
-
Development of a Physiologically Based Pharmacokinetic Model for Itraconazole Pharmacokinetics and Drug-Drug Interaction Prediction.Clin Pharmacokinet. 2016 Jun;55(6):735-49. doi: 10.1007/s40262-015-0352-5. Clin Pharmacokinet. 2016. PMID: 26692192
-
Extrapolating in vitro metabolic interactions to isolated perfused liver: predictions of metabolic interactions between R-bufuralol, bunitrolol, and debrisoquine.J Pharm Sci. 2010 Oct;99(10):4406-26. doi: 10.1002/jps.22136. J Pharm Sci. 2010. PMID: 20310018
-
Semi-mechanistic physiologically-based pharmacokinetic modeling of clinical glibenclamide pharmacokinetics and drug-drug-interactions.Eur J Pharm Sci. 2013 Aug 16;49(5):819-28. doi: 10.1016/j.ejps.2013.06.009. Epub 2013 Jun 24. Eur J Pharm Sci. 2013. PMID: 23806476
-
Dealing with the complex drug-drug interactions: towards mechanistic models.Biopharm Drug Dispos. 2015 Mar;36(2):71-92. doi: 10.1002/bdd.1934. Epub 2015 Feb 10. Biopharm Drug Dispos. 2015. PMID: 25545151 Review.
-
Novel pre-clinical methodologies for pharmacokinetic drug-drug interaction studies: spotlight on "humanized" animal models.Drug Metab Rev. 2014 Nov;46(4):475-93. doi: 10.3109/03602532.2014.967866. Epub 2014 Oct 1. Drug Metab Rev. 2014. PMID: 25270219 Review.
Cited by
-
Liver Bioreactor Design Issues of Fluid Flow and Zonation, Fibrosis, and Mechanics: A Computational Perspective.J Funct Biomater. 2020 Feb 28;11(1):13. doi: 10.3390/jfb11010013. J Funct Biomater. 2020. PMID: 32121053 Free PMC article. Review.
-
Streamlining physiologically-based pharmacokinetic model design for intravenous delivery of nanoparticle drugs.CPT Pharmacometrics Syst Pharmacol. 2022 Apr;11(4):409-424. doi: 10.1002/psp4.12762. Epub 2022 Feb 7. CPT Pharmacometrics Syst Pharmacol. 2022. PMID: 35045205 Free PMC article.
-
Virtual Lobule Models Are the Key for Multiscale Biomechanical and Pharmacological Modeling for the Liver.Front Physiol. 2020 Sep 2;11:1061. doi: 10.3389/fphys.2020.01061. eCollection 2020. Front Physiol. 2020. PMID: 32982791 Free PMC article. No abstract available.
-
Liver Microphysiological Systems for Predicting and Evaluating Drug Effects.Clin Pharmacol Ther. 2019 Jul;106(1):139-147. doi: 10.1002/cpt.1458. Epub 2019 Jun 4. Clin Pharmacol Ther. 2019. PMID: 30993668 Free PMC article. Review.
References
-
- U S Food and Drug Administration. Guidance for industry: Drug metabolism/drug interaction studies in the drug development process: Studies in vitro.; 1997. April. Available from: http://www.fda.gov/downloads/AboutFDA/CentersOffices/CDER/UCM142439.pdf.
MeSH terms
Substances
LinkOut - more resources
Full Text Sources
Other Literature Sources

