

Dealing with AFLP genotyping errors to reveal genetic structure in Plukenetia volubilis (Euphorbiaceae) in the Peruvian Amazon
- PMID: 28910307
- PMCID: PMC5598967
- DOI: 10.1371/journal.pone.0184259
Dealing with AFLP genotyping errors to reveal genetic structure in Plukenetia volubilis (Euphorbiaceae) in the Peruvian Amazon
Abstract
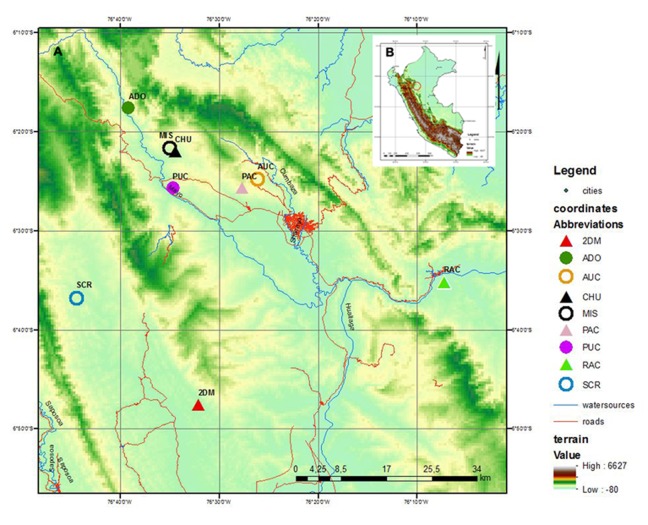
An analysis of the population structure and genetic diversity for any organism often depends on one or more molecular marker techniques. Nonetheless, these techniques are not absolutely reliable because of various sources of errors arising during the genotyping process. Thus, a complex analysis of genotyping error was carried out with the AFLP method in 169 samples of the oil seed plant Plukenetia volubilis L. from small isolated subpopulations in the Peruvian Amazon. Samples were collected in nine localities from the region of San Martin. Analysis was done in eight datasets with a genotyping error from 0 to 5%. Using eleven primer combinations, 102 to 275 markers were obtained according to the dataset. It was found that it is only possible to obtain the most reliable and robust results through a multiple-level filtering process. Genotyping error and software set up influence both the estimation of population structure and genetic diversity, where in our case population number (K) varied between 2-9 depending on the dataset and statistical method used. Surprisingly, discrepancies in K number were caused more by statistical approaches than by genotyping errors themselves. However, for estimation of genetic diversity, the degree of genotyping error was critical because descriptive parameters (He, FST, PLP 5%) varied substantially (by at least 25%). Due to low gene flow, P. volubilis mostly consists of small isolated subpopulations (ΦPT = 0.252-0.323) with some degree of admixture given by socio-economic connectivity among the sites; a direct link between the genetic and geographic distances was not confirmed. The study illustrates the successful application of AFLP to infer genetic structure in non-model plants.
Conflict of interest statement
Figures


Similar articles
-
Sacha Inchi Oil (Plukenetia volubilis L.), effect on adherence of Staphylococus aureus to human skin explant and keratinocytes in vitro.J Ethnopharmacol. 2015 Aug 2;171:330-4. doi: 10.1016/j.jep.2015.06.009. Epub 2015 Jun 16. J Ethnopharmacol. 2015. PMID: 26087228
-
Simple regression models as a threshold for selecting AFLP loci with reduced error rates.BMC Bioinformatics. 2012 Oct 16;13:268. doi: 10.1186/1471-2105-13-268. BMC Bioinformatics. 2012. PMID: 23072295 Free PMC article.
-
Microsatellite marker development in tung trees (Vernicia montanaand V. fordii, Euphorbiaceae).Am J Bot. 2011 Aug;98(8):e226-8. doi: 10.3732/ajb.1100151. Am J Bot. 2011. PMID: 21821587
-
A call for more transparent reporting of error rates: the quality of AFLP data in ecological and evolutionary research.Mol Ecol. 2012 Dec;21(24):5911-7. doi: 10.1111/mec.12069. Epub 2012 Nov 5. Mol Ecol. 2012. PMID: 23121160 Review.
-
Sacha inchi (Plukenetia volubilis L.): An emerging source of nutrients, omega-3 fatty acid and phytochemicals.Food Chem. 2022 Mar 30;373(Pt B):131459. doi: 10.1016/j.foodchem.2021.131459. Epub 2021 Oct 23. Food Chem. 2022. PMID: 34731811 Review.
Cited by
-
BinMat: A molecular genetics tool for processing binary data obtained from fragment analysis in R.Biodivers Data J. 2022 Mar 11;10:e77875. doi: 10.3897/BDJ.10.e77875. eCollection 2022. Biodivers Data J. 2022. PMID: 35437391 Free PMC article.
-
Biological Activity of Sacha Inchi (Plukenetia volubilis Linneo) and Potential Uses in Human Health: A Review.Food Technol Biotechnol. 2021 Sep;59(3):253-266. doi: 10.17113/ftb.59.03.21.6683. Food Technol Biotechnol. 2021. PMID: 34759758 Free PMC article. Review.
-
Transcriptome analyses reveals the dynamic nature of oil accumulation during seed development of Plukenetia volubilis L.Sci Rep. 2020 Nov 24;10(1):20467. doi: 10.1038/s41598-020-77177-w. Sci Rep. 2020. PMID: 33235240 Free PMC article.
-
De novo transcriptome assembly of the eight major organs of Sacha Inchi (Plukenetia volubilis) and the identification of genes involved in α-linolenic acid metabolism.BMC Genomics. 2018 May 22;19(1):380. doi: 10.1186/s12864-018-4774-y. BMC Genomics. 2018. PMID: 29788925 Free PMC article.
-
Sacha inchi (Plukenetia volubilis L.)-from lost crop of the Incas to part of the solution to global challenges?Planta. 2020 Mar 17;251(4):80. doi: 10.1007/s00425-020-03377-3. Planta. 2020. PMID: 32185506 Review.
References
-
- Guillén MD, Ruiz A, Cabo N, Chirinos R, Pascual G. Characterization of sacha inchi (Plukenetia volubilis L.) Oil by FTIR spectroscopy and 1H NMR. Comparison with linseed oil. J Am Oil Chem Soc. 2003;80: 755–762.
-
- Gillespie LJ. A synopsis of neotropical Plukenetia (Euphorbiaceae) including two new species. Syst. Bot. 1993;18: 575–592.
-
- Hamaker BR, Valles C, Gilman R, Hardmeier RM, Clark D, García HH, et al. Amino acid and fatty acid profiles of the inca peanut (Plukenetia volubilis L.). Cereal Chem. 1992;69: 461–463.
-
- Gutiérrez L-F, Rosada L-M, Jiméneza Á. Chemical composition of sacha inchi (Plukenetia volubilis L.) seeds and characteristics of their lipid fraction. Grasas Aceites. 2011;62: 76–83.
-
- Chirinos R, Zuloeta G, Pedreschi R, Mignole E, Larondelle Y, Campos D. Sacha inchi (Plukenetia volubilis): A seed source of polyunsaturated fatty acids, tocopherols, phytosterols, phenolic compounds and antioxidant capacity. Food Chem. 2013;141: 1732–1739. doi: 10.1016/j.foodchem.2013.04.078 - DOI - PubMed
MeSH terms
LinkOut - more resources
Full Text Sources
Other Literature Sources
Research Materials
Miscellaneous
