

The evolution of Lachancea thermotolerans is driven by geographical determination, anthropisation and flux between different ecosystems
- PMID: 28910346
- PMCID: PMC5599012
- DOI: 10.1371/journal.pone.0184652
The evolution of Lachancea thermotolerans is driven by geographical determination, anthropisation and flux between different ecosystems
Abstract
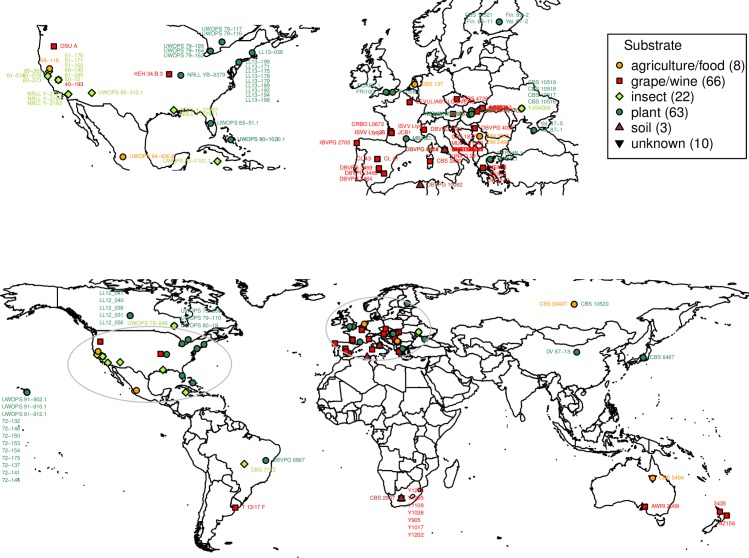
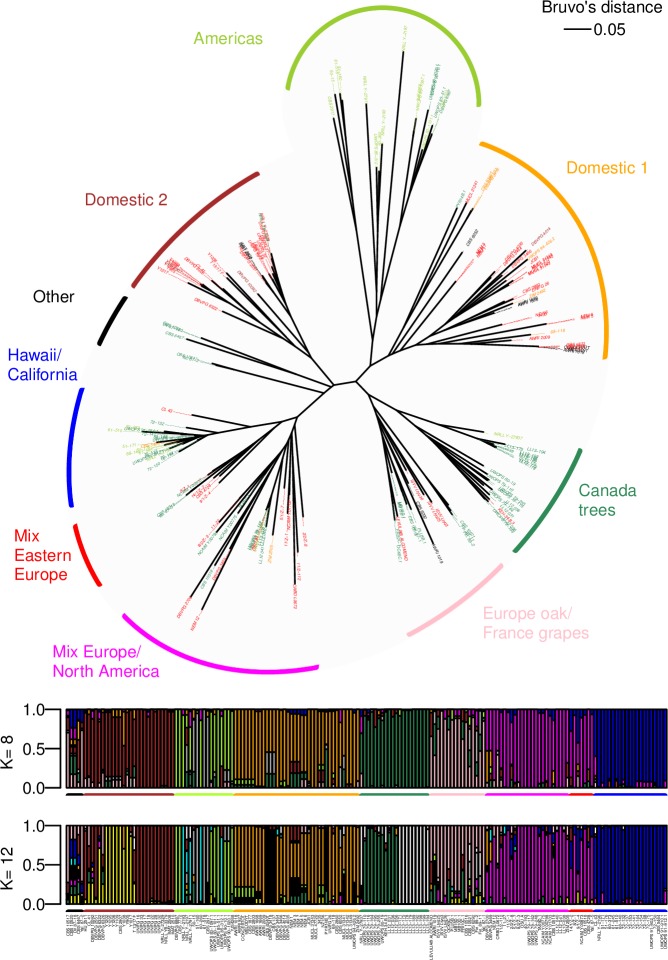
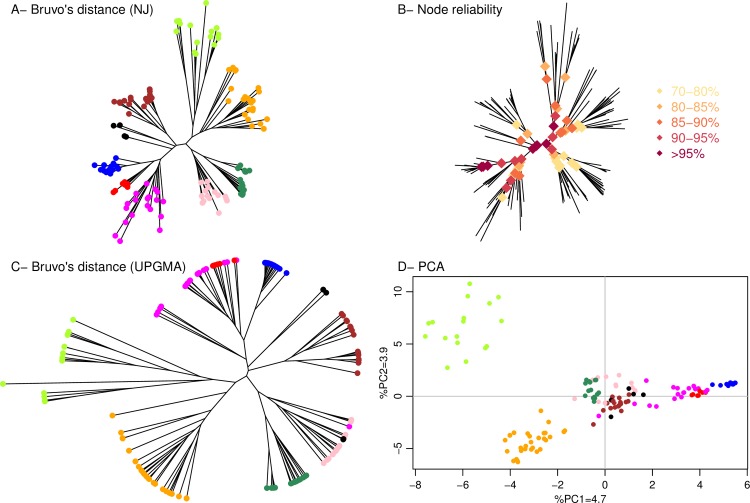
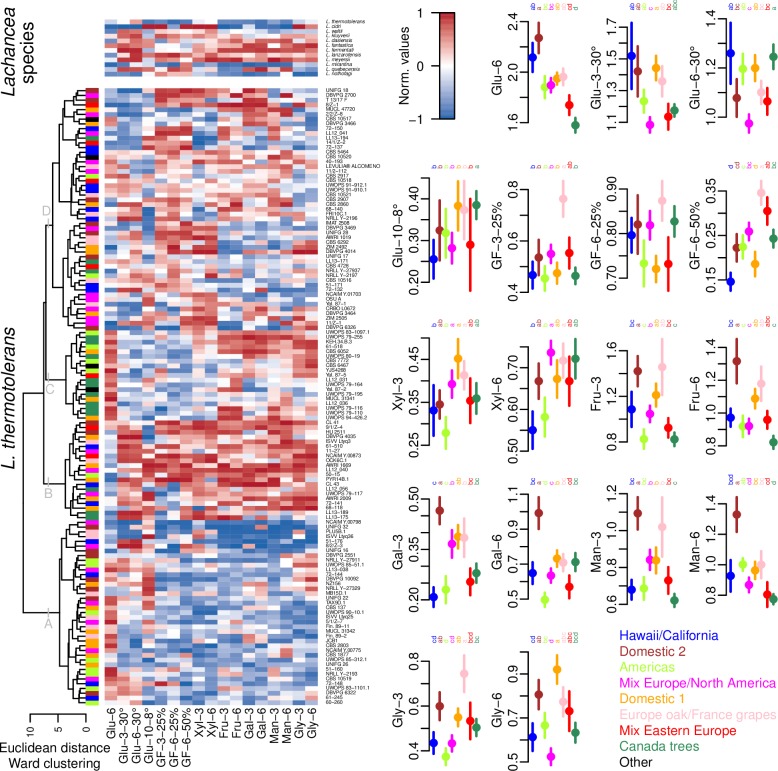
The yeast Lachancea thermotolerans (formerly Kluyveromyces thermotolerans) is a species with remarkable, yet underexplored, biotechnological potential. This ubiquist occupies a range of natural and anthropic habitats covering a wide geographic span. To gain an insight into L. thermotolerans population diversity and structure, 172 isolates sourced from diverse habitats worldwide were analysed using a set of 14 microsatellite markers. The resultant clustering revealed that the evolution of L. thermotolerans has been driven by the geography and ecological niche of the isolation sources. Isolates originating from anthropic environments, in particular grapes and wine, were genetically close, thus suggesting domestication events within the species. The observed clustering was further validated by several means including, population structure analysis, F-statistics, Mantel's test and the analysis of molecular variance (AMOVA). Phenotypic performance of isolates was tested using several growth substrates and physicochemical conditions, providing added support for the clustering. Altogether, this study sheds light on the genotypic and phenotypic diversity of L. thermotolerans, contributing to a better understanding of the population structure, ecology and evolution of this non-Saccharomyces yeast.
Conflict of interest statement
Figures
Similar articles
-
Oenological traits of Lachancea thermotolerans show signs of domestication and allopatric differentiation.Sci Rep. 2018 Oct 4;8(1):14812. doi: 10.1038/s41598-018-33105-7. Sci Rep. 2018. PMID: 30287912 Free PMC article.
-
Development of microsatellite markers for Lachancea thermotolerans typing and population structure of wine-associated isolates.Microbiol Res. 2016 Dec;193:1-10. doi: 10.1016/j.micres.2016.08.010. Epub 2016 Aug 24. Microbiol Res. 2016. PMID: 27825476
-
Microsatellite typing of Lachancea thermotolerans for wine fermentation monitoring.Int J Food Microbiol. 2023 Jun 2;394:110186. doi: 10.1016/j.ijfoodmicro.2023.110186. Epub 2023 Mar 21. Int J Food Microbiol. 2023. PMID: 36963240
-
Lachancea yeast species: Origin, biochemical characteristics and oenological significance.Food Res Int. 2019 May;119:378-389. doi: 10.1016/j.foodres.2019.02.003. Epub 2019 Feb 4. Food Res Int. 2019. PMID: 30884668 Review.
-
An Integrative View of the Role of Lachancea thermotolerans in Wine Technology.Foods. 2021 Nov 21;10(11):2878. doi: 10.3390/foods10112878. Foods. 2021. PMID: 34829158 Free PMC article. Review.
Cited by
-
Oenological traits of Lachancea thermotolerans show signs of domestication and allopatric differentiation.Sci Rep. 2018 Oct 4;8(1):14812. doi: 10.1038/s41598-018-33105-7. Sci Rep. 2018. PMID: 30287912 Free PMC article.
-
Subpopulation-specific gene expression in Lachancea thermotolerans uncovers distinct metabolic adaptations to wine fermentation.Curr Res Food Sci. 2024 Dec 11;10:100954. doi: 10.1016/j.crfs.2024.100954. eCollection 2025. Curr Res Food Sci. 2024. PMID: 39760014 Free PMC article.
-
Contribution of Non-Saccharomyces Yeasts to Wine Freshness. A Review.Biomolecules. 2019 Dec 25;10(1):34. doi: 10.3390/biom10010034. Biomolecules. 2019. PMID: 31881724 Free PMC article. Review.
-
Impact of Lachancea thermotolerans on Chemical Composition and Sensory Profiles of Viognier Wines.J Fungi (Basel). 2022 Apr 30;8(5):474. doi: 10.3390/jof8050474. J Fungi (Basel). 2022. PMID: 35628730 Free PMC article.
-
Insights Into the Cultivable Microbial Ecology of "Manna" Ash Products Extracted From Fraxinus angustifolia (Oleaceae) Trees in Sicily, Italy.Front Microbiol. 2019 May 21;10:984. doi: 10.3389/fmicb.2019.00984. eCollection 2019. Front Microbiol. 2019. PMID: 31164870 Free PMC article.
References
-
- Sicard D, Legras JL. Bread, beer and wine: yeast domestication in the Saccharomyces sensu stricto complex. Comptes Rendus Biologies. 2011. March; 334(3):229–36. doi: 10.1016/j.crvi.2010.12.016 - DOI - PubMed
-
- Liti G, Carter DM, Moses AM, Warringer J, Parts L, James SA et al. Population genomics of domestic and wild yeasts. Nature. 2009. March; 458(7236):337–41. doi: 10.1038/nature07743 - DOI - PMC - PubMed
-
- Strope PK, Skelly DA, Kozmin SG, Mahadevan G, Stone EA, Magwene PM et al. The 100-genomes strains, an S. cerevisiae resource that illuminates its natural phenotypic and genotypic variation and emergence as an opportunistic pathogen. Genome research. 2015. May; 25(5):762–74. doi: 10.1101/gr.185538.114 - DOI - PMC - PubMed
-
- Kelly DE, Lamb DC, Kelly SL. Genome‐wide generation of yeast gene deletion strains. Comparative and functional genomics. 2001. August; 2(4):236–42. doi: 10.1002/cfg.95 - DOI - PMC - PubMed
MeSH terms
Substances
LinkOut - more resources
Full Text Sources
Other Literature Sources
