. 2017 Sep 13;95(6):1395-1405.e3.
doi: 10.1016/j.neuron.2017.08.025.

Dopamine Neurons Respond to Errors in the Prediction of Sensory Features of Expected Rewards

Affiliations

Dopamine Neurons Respond to Errors in the Prediction of Sensory Features of Expected Rewards

Yuji K Takahashi et al. Neuron. .

Abstract

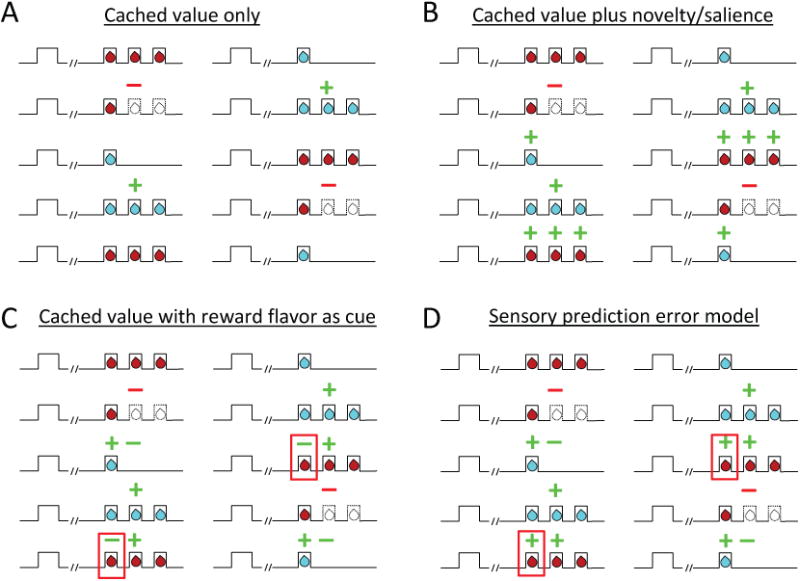
Midbrain dopamine neurons have been proposed to signal prediction errors as defined in model-free reinforcement learning algorithms. While these algorithms have been extremely powerful in interpreting dopamine activity, these models do not register any error unless there is a difference between the value of what is predicted and what is received. Yet learning often occurs in response to changes in the unique features that characterize what is received, sometimes with no change in its value at all. Here, we show that classic error-signaling dopamine neurons also respond to changes in value-neutral sensory features of an expected reward. This suggests that dopamine neurons have access to a wider variety of information than contemplated by the models currently used to interpret their activity and that, while their firing may conform to predictions of these models in some cases, they are not restricted to signaling errors in the prediction of value.

Keywords: dopamine; learning; prediction error; rodent; single unit.


Figures

Figure 1
Figure 1. Identification, waveform features of putative dopamine neurons
(A) Result of cluster analysis based on the half time of the spike duration and the ratio comparing the amplitude of the first positive and negative waveform segments ((n – p) / (n + p)). Data on the left show VTA neurons (n = 473) from the experimental group, plotted as reward-responsive (filled black circles) and nonresponsive dopamine neurons (filed gray circles), and neurons that classified with other clusters, no clusters or more than on cluster (open circles). Data on the right show VTA neurons (n = 556) from rats that received AAV1-Flex-taCasp3-TEVp infusions, plotted as dopamine (filled red circles) or non dopamine neurons (open red circles) based on whether they were assigned to the dopamine cluster from the experimental data. Drawings on right show electrode tracks in experimental (n = 8, gray) and Casp3 groups (n = 5, red) and a representative coronal brain slices showing unilateral loss of TH-positive neurons in VTA in a Casp3-infused rat (left hemisphere, avg loss vs intact side 76.5%, range 65-85% over all 5 rats). (B) Bar graph indicating average amplitude ratio of putative dopamine neurons, non dopamine neurons recorded from experimental rats, and VTA neurons recorded from Casp3-infused rats. (C) Bar graph indicating average half duration of putative dopamine, non dopamine neurons recorded from experimental rats, and VTA neurons recorded in Casp3-infused rats. Error bars, S.E.M. The average amplitude ratio and spike duration of the neurons recorded in the Casp3 rats did not differ from neurons in non-dopamine clusters recorded in the experimental rats (amplitude ratio, t-test, t946 = 0.99, p = 0.32; spike duration, t-test, t946 = 1.40, p = 0.16). Indeed only 6 of the neurons recorded in these rats (filled red circles in A) classified as the putative dopamine neurons (1% vs 17%, X2 = 87.7, p < 0.0000001). This amounted to an average of 0.06 putative dopamine neurons per session in the Casp3 group versus 0.79 neurons per session observed in the experimental rats (t-test, p < 0.01). The prevalence of the non-dopamine neurons actually increased from 3.84 neurons per session in the experimental rats to 5.44 neurons per session in the Casp3 group (t-test, p < 0.01), perhaps due to network effects of the loss of the TH+ neurons.
Figure 2
Figure 2. Task design and behavior
(A) Picture of apparatus used in the task, showing the odor port (∼2.5 cm diameter) and two fluid wells. (B) Line deflections indicate the time course of stimuli (odors and rewards) presented to the animal on each trial. Dashed lines show when a reward was omitted, and solid lines show when reward was delivered. At the start of each recording session one well was randomly designated to deliver the big reward, which consisted of 3 drops of flavored milk (chocolate or vanilla). One drop of the other flavored milk was delivered in the other well (block 1). In the second and fourth blocks, number of drops delivered in the two wells were switched without changing the flavors (value shift). In the third and fifth blocks, the flavors delivered in the two wells were switched without changing the number of drops (identity shift). (C) Chocolate and vanilla flavored milk were equally preferred in 2-min consumption tests conducted at the end of some sessions. Gray lines indicate data from individual rats. (D – E) Choice rates in last 15 trials before and first 40 trials after a switch in reward number (D) or flavor (E). Y-axis indicates percent choice of side designated as big reward after block switch. Inset bar graphs show average choice rates in the last 15 before and first 40 trials after the switch. (F) Reaction times on the last 10 forced-choice trials in response to big and small amounts of each flavor. (G) Percentage correct on the last 10 forced-choice trials in response to big and small amounts of each flavor. (H) Number of licks in 500 ms after 1st drop of reward on the last 10 trials in response to big and small amounts of each flavor. B, big; S, small. Error bars, S.E.M.
Figure 3
Figure 3. Changes in reward-evoked activity of reward-responsive dopamine neurons (n = 60) to changes in reward number
(A – B) Average firing on first 5 (red) and last 5 (blue) trials after a shift in reward number. (A) shows firing to the 3 drops of the big reward when the small reward had been expected, and (B) shows firing to the single drop of the small reward when the big reward had been expected. Big-B, 3 drops of reward B; small-A, one drop of reward A. (C) Distributions of difference scores comparing firing to 1st (left), 2nd (middle) and 3rd drops (right) of the big reward in the first 5 versus last 5 trials in a number shift block. (D) Distributions of difference scores comparing firing to the single drop of the small reward (left), and omissions of 2nd (middle) and 3rd drops (right) of the big reward in the first 5 versus last 5 trials in a number shift block. Difference scores were computed from the average firing rate of each neuron. The numbers in each panel indicate results of Wilcoxon signed-rank test (p) and the average difference score (u). (E) Changes in average firing before and after reward number shift. Light-gray, black and dark-gray solid lines indicate firing at the time of the 1st, 2nd, and 3rd drop of reward on big trials. Light-gray, black and dark-gray dashed-lines indicate firing at the time of the small reward, and omissions of the 2nd and 3rd drops thereafter on small trials. Error bars, S.E.M. (F) Correlation between differences scores representing changes in firing to delivery and omission of the 2nd drop of the big reward.
Figure 4
Figure 4. Changes in reward-evoked activity of reward-responsive dopamine neurons (n = 48) to changes in reward identity
(A – B) Average firing on last 5 trials before (green) and first 5 trials after (red) a shift in reward identity for the big (A) and small (B) rewards. Big-A, 3 drops of reward A; Big-B, 3 drops of reward B; small-A, one drop of reward A; small-B, one drop of reward B. (C) Distributions of difference scores comparing firing to 1st (left), 2nd (middle) and 3rd drops (right) of the big reward in the last 5 versus first 5 trials before and after identity shift. (D) Distributions of difference scores comparing firing to the single drop of the small reward (left), and omissions of 2nd (middle) and 3rd drops (right) of the big reward in the last 5 versus first 5 small trials before and after an identity shift. Difference scores were computed from the average firing rate of each neuron. The numbers in each panel indicate results of Wilcoxon signed-rank test (p) and the average difference score (u). (E) Changes in average firing before and after reward identity shift. Black line indicates average firing at the time of the 1st and 2nd drops of the big reward and the small reward. Gray dashed line indicates average firing 0.5 s and 1.0 s after small reward. Error bars, S.E.M. (F) Correlation between changes in firing to shifts in reward identity, shown here, and changes in firing to delivery (blue dots) or omission (red dots) of the 2nd drop of the big reward, shown in Fig 3.
Figure 5
Figure 5. Schematic illustrating different ways that error signals might appear in response to changes in reward number and identity in the behavioral design reproduced from Fig 2, depending on what information dopaminergic errors reflect
(A) If dopamine neuron firing reflects errors in cached value only, then the conventional prediction would be increased firing only to the second drop of the big reward and decreased firing only on omission of this second drop of reward, since these are the only places in the design where cached value predictions are clearly violated. (B) If dopamine neuron firing reflects errors in cached value plus a novelty bonus or salience, then the prediction is for the same cached value errors shown in panel A on number shifts, plus increased firing to each drop of reward after an identity shift, assuming the unexpected flavor of each drop is salient or novel. (C) If dopamine neuron firing reflects errors in cached value, based on both the odor cues and also the sensory features of the first drop of each reward, then the prediction is for the same cached value errors shown in panel A for number shifts, plus a mixture of increased and decreased firing to identity shifts dependent on cached value accrued by the first drop's flavor in the prior block. For example, when chocolate was the small reward previously and becomes the large reward, one would expect the first drop to evoke decreased firing because it would be less valuable than expected (since its flavor predicts no more drops), followed by increased firing to subsequent drops because they would be unexpected. This again assumes the rat is using the flavor of the first drop to make predictions about subsequent drops. Note this does not apply if the two wells deliver similar amounts of different rewards, and as illustrated in Fig. S2, dopamine neurons also exhibited errors in response to identity shifts under these conditions. (D) Finally if dopamine neuron firing reflects errors in the prediction of sensory information or features, either instead of or in addition to cached value errors, then the predictions are for increased firing to unexpected events generally and decreased firing to their omission. See text for full description. (green = positive errors, red = negative errors, red boxes highlight only place of divergence of predictions between C and D)

Comment in

References

    1. Bayer HM, Glimcher P. Midbrain dopamine neurons encode a quantitative reward prediction error signal. Neuron. 2005;47:129–141. - PMC - PubMed
    1. Brogden WJ. Sensory pre-conditioning. Journal of Experimental Psychology. 1939;25:323–332. - PubMed
    1. Bromberg-Martin ES, Hikosaka O. Midbrain dopamine neurons signal preference for advance information about upcoming rewards. Neuron. 2009;63:119–126. - PMC - PubMed
    1. Bromberg-Martin ES, Matsumoto M, Hikosaka O. Dopamine in motivational control: rewarding, aversive and alerting. Neuron. 2010a;68:815–834. - PMC - PubMed
    1. Bromberg-Martin ES, Matsumoto M, Hong S, Hikosaka O. A pallidus-habenula-dopamine pathway signals inferred stimulus values. Journal of Neurophysiology. 2010b;104:1068–1076. - PMC - PubMed