. 2017 Sep 6;45(15):9149-9163.
doi: 10.1093/nar/gkx547.

Structure/cleavage-based insights into helical perturbations at bulge sites within T. thermophilus Argonaute silencing complexes

Affiliations

Structure/cleavage-based insights into helical perturbations at bulge sites within T. thermophilus Argonaute silencing complexes

Gang Sheng et al. Nucleic Acids Res. .

Abstract

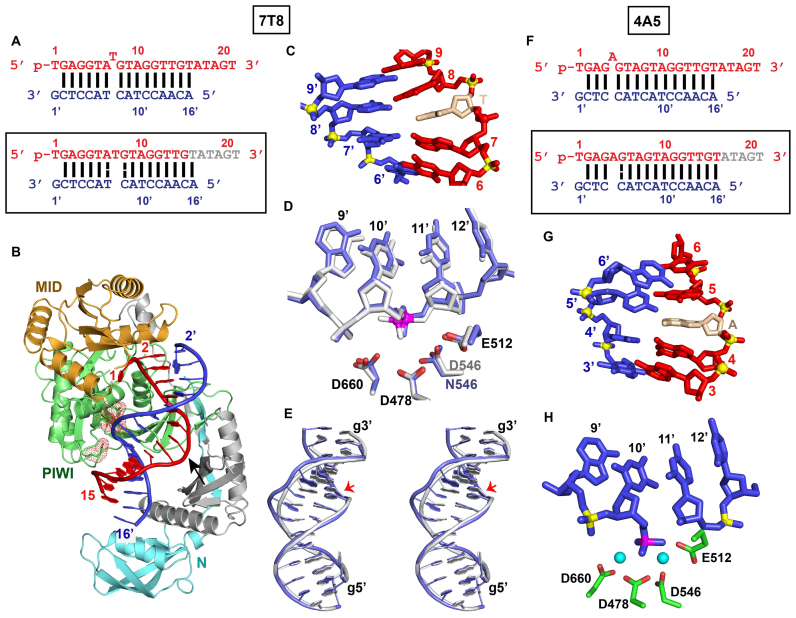
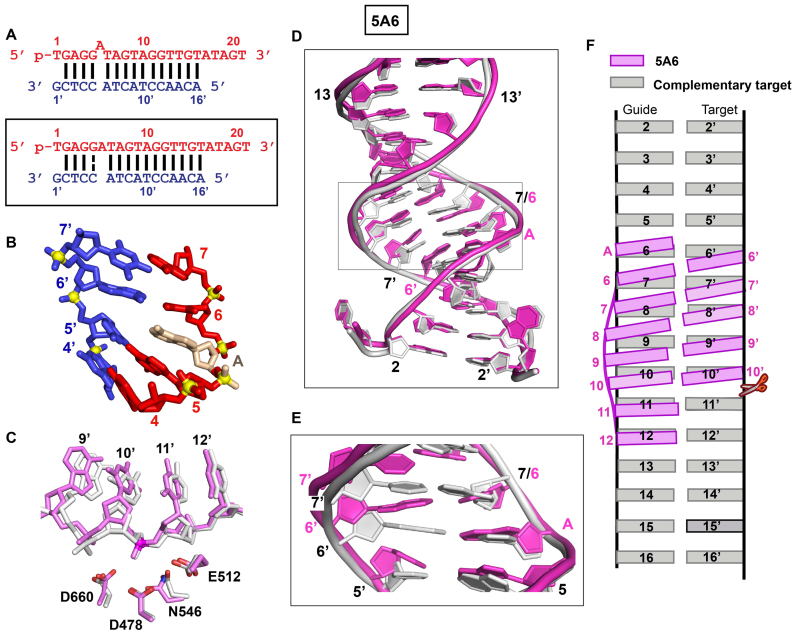
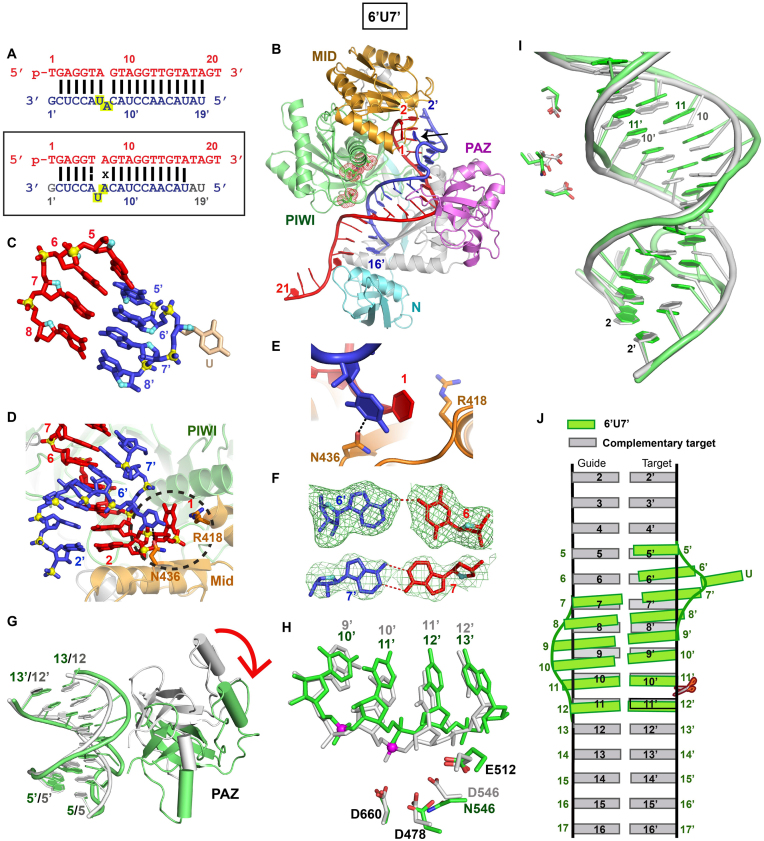
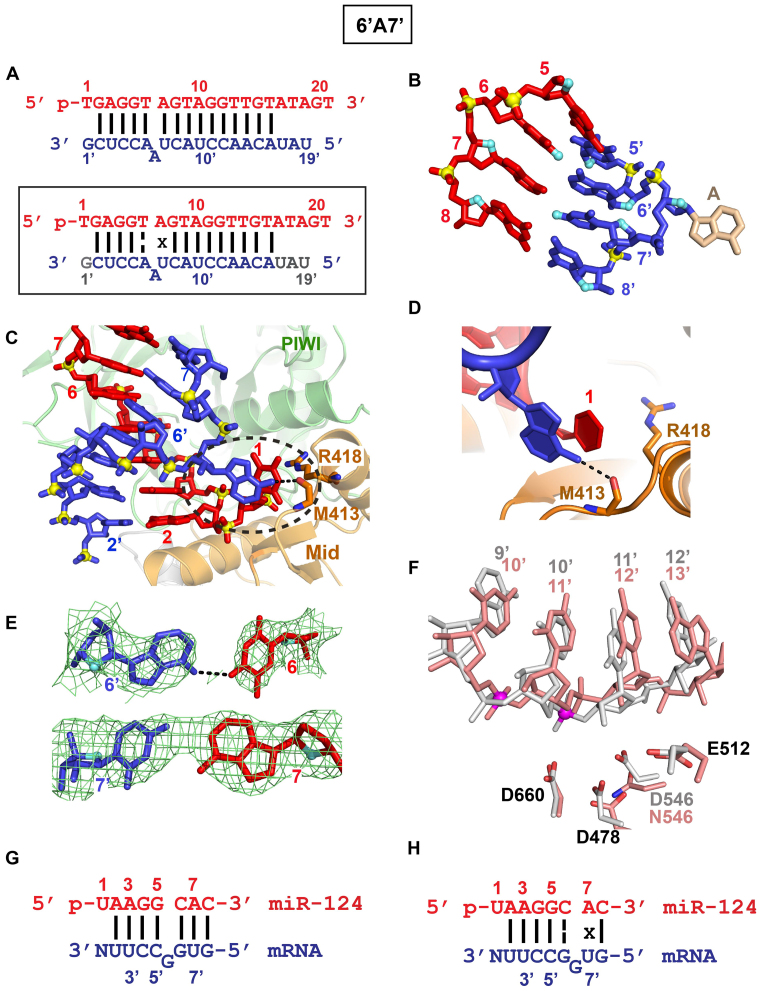
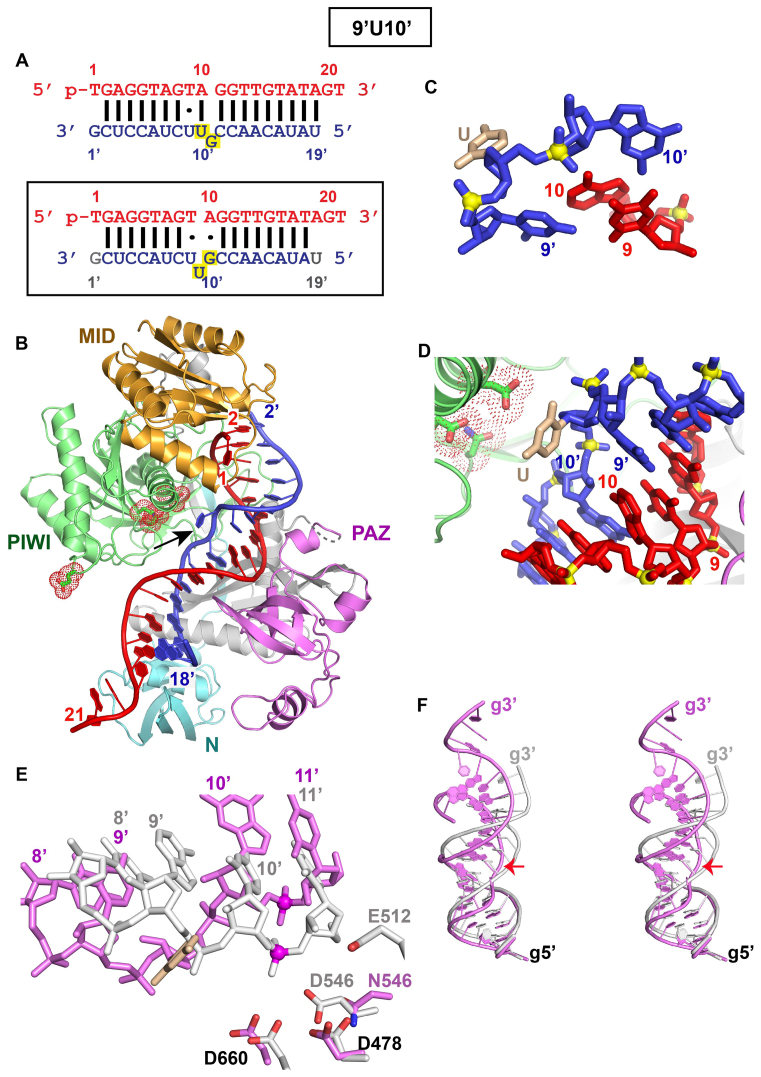
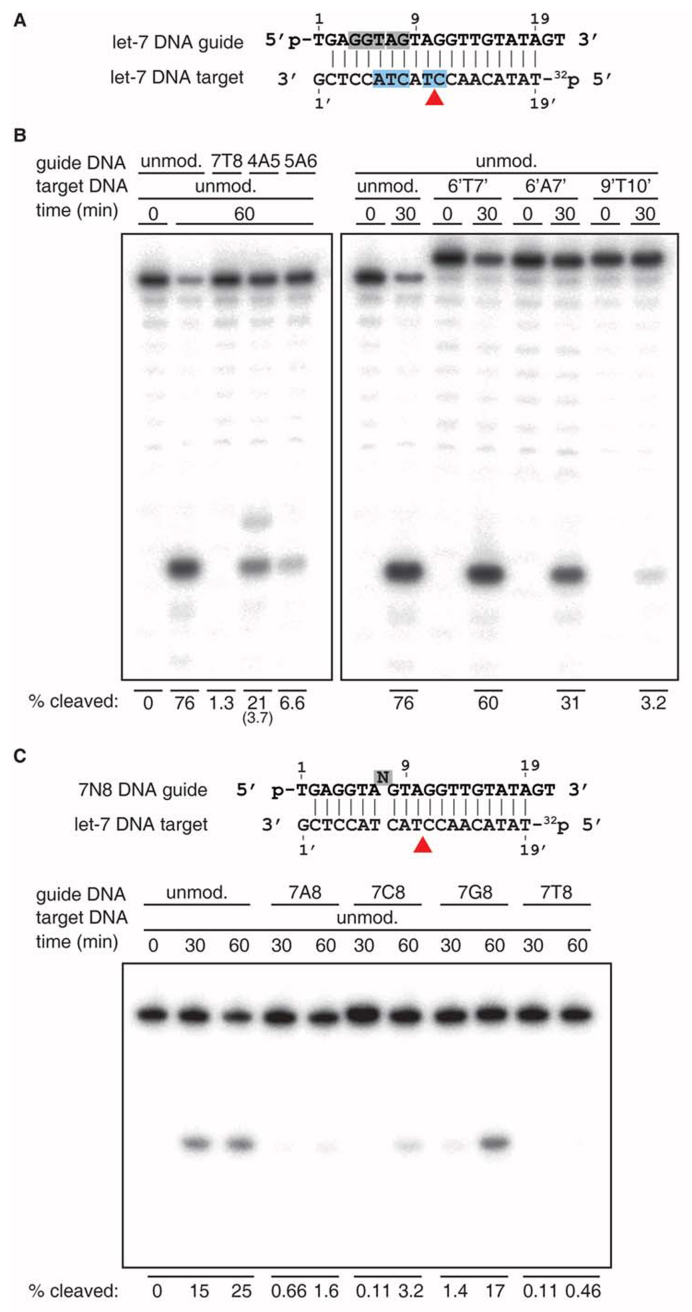
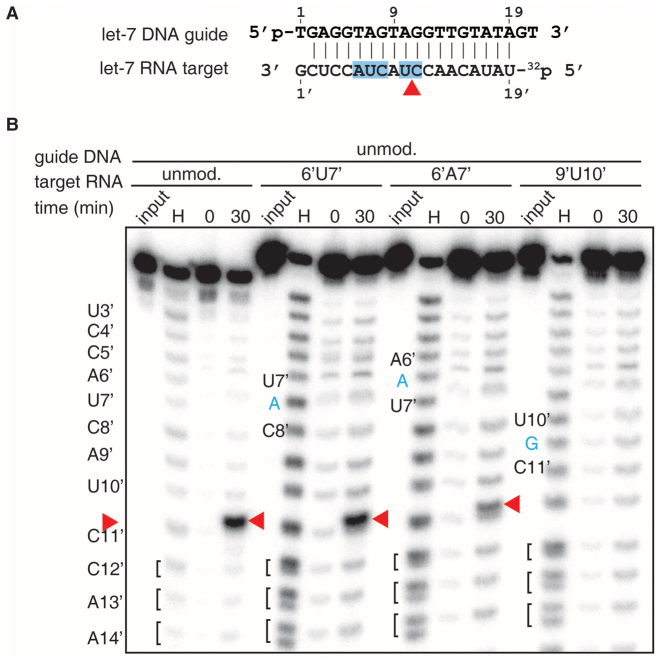
We have undertaken a systematic structural study of Thermus thermophilus Argonaute (TtAgo) ternary complexes containing single-base bulges positioned either within the seed segment of the guide or target strands and at the cleavage site. Our studies establish that single-base bulges 7T8, 5A6 and 4A5 on the guide strand are stacked-into the duplex, with conformational changes localized to the bulge site, thereby having minimal impact on the cleavage site. By contrast, single-base bulges 6'U7' and 6'A7' on the target strand are looped-out of the duplex, with the resulting conformational transitions shifting the cleavable phosphate by one step. We observe a stable alignment for the looped-out 6'N7' bulge base, which stacks on the unpaired first base of the guide strand, with the looped-out alignment facilitated by weakened Watson-Crick and reversed non-canonical flanking pairs. These structural studies are complemented by cleavage assays that independently monitor the impact of bulges on TtAgo-mediated cleavage reaction.


Figures

Figure 1.
Figure 1.
Crystal Structure of TtAgo Bound to 5′-phosphorylated 22-nt Guide DNA and 19-nt Target DNA Containing a 7T8 (TtAgo D546N Catalytic Mutant) and 4A5 (TtAgo Wild-type) Bulges Positioned Within the Seed Segment on the Guide Strand. (A) Sequence of the guide DNA–target DNA duplex (top panel), with the actual alignment of the bulge in the crystal structure of the ternary complex (bottom boxed panel), where a thymine stacks into the duplex between positions 7 and 8 of the guide strand. The traceable segments of the nucleotides of the guide DNA and target DNA in the structure of the ternary complex are shown in red and blue, respectively. The dashed lines show weakened Watson–Crick pairs. (B) 2.9 Å structure of TtAgo (N546 catalytic mutant) bound to 5′-phosphorylated 22-nt guide DNA (in red) and 19-nt target DNA (in blue) containing a 7T8 bulge positioned on the guide strand within the seed segment. There is one molecule of the complex in the asymmetric unit. The PAZ domain is disordered and the 3′-end of the guide strand cannot be monitored in the complex. (C) A stick representation of the bulge site and two flanking base pairs, with the stacked-in thymine highlighted in biscuit color in the 7T8 bulge-containing ternary complex. (D) The positioning of the DNA target strand of the control containing no bulge (in silver) and in the 7T8 bulge (in blue) relative to the catalytic residues (D478, D660, E512 and D546N mutant) of the RNase H fold of the PIWI domain in the TtAgo ternary complex. The catalytic residues are equidistant from the phosphate linking the 10’–11’ step (colored in magenta) in the control (in silver) and 7T8 bulge (in blue)-containing Ago ternary complexes. (E) Superposition of the guide-target duplex containing no bulge (in silver) and 7T8 bulge (in blue) in Ago ternary complexes. The guide strand is labeled g and the 10’–11’ phosphate at the cleavage site on the target strand is indicated by a red arrow. (F) Sequence of the guide DNA–target DNA duplex (top panel), with the actual alignment of the bulge in the crystal structure of the ternary complex (bottom boxed panel), where a adenine stacks into the duplex between positions 4 and 5 of the guide strand. Wild-type TtAgo was used to generate crystals of this complex. (G) A stick representation of the bulge site and two flanking base pairs, with the stacked- in adenine highlighted in biscuit color in the 3.1 Å structure of the 4A5 bulge-containing ternary complex. There is one molecule of the complex in the asymmetric unit and the 3′-end of the guide strand is inserted into the PAZ pocket of an adjacent molecule in the crystal lattice (not shown). (H) The positioning of the DNA target strand of the 4A5 bulge (in blue) relative to the catalytic residues (D478, D660, E512 and D546) of the RNase H fold of the PIWI domain in the wild-type TtAgo ternary complex. Note that the backbone has cleaved at the 10’–11’ step in the target strand and that a pair of Mg2+ cations were identified at the cleavage site in the wild-type TtAgo ternary complex.
Figure 2.
Figure 2.
Crystal structures of TtAgo (TtAgo D546N catalytic mutant) bound to 5′-phosphorylated 22-nt guide DNA and 19-nt target DNA containing a 5A6 bulge positioned on the guide strand within the seed segment and conformational adjustments on proceeding from control to 5A6 bulge-containing ternary complexes. (A) Sequence of the guide DNA–target DNA duplex (top panel), with the actual alignment of the bulge in the crystal structure of the ternary complex (bottom boxed panel), where an adenine stacks into the duplex between positions 5 and 6 of the guide strand. (B) A stick representation of the bulge site and two flanking base pairs, with the stacked- in adenine highlighted in biscuit color in the 2.8 Å structure of the 5A6 bulge-containing ternary complex. There are two molecules of the complex in the asymmetric unit and the 3′-end of the guide strand is inserted into the PAZ pocket of an adjacent molecule in the crystal lattice (not shown). (C) The positioning of the DNA target strand of the control containing no bulge (in silver) and in the 5A6 bulge (in magenta) relative to the catalytic residues (D478, D660, E512 and D546N mutant) of the RNase H fold of the PIWI domain in the TtAgo ternary complexes. The catalytic residues are equidistant from the phosphate linking the 10’–11’ step (colored in red) in the control (in silver) and 5A6 bulge (in magenta)-containing Ago ternary complexes. (D, E) Superposition of the seed and cleavage site segments of the guide-target duplex in the no-bulge control (in silver) and 5A6 bulge-containing (in magenta) Ago ternary complexes. The segment spans 1–1’ to 14–14’ in panel D and spans 5–5′ to 8–8’ in panel E. (F) Schematic emphasizing base tilting of the guide strand between 5–5′ and 11–11’ pairs in the duplex of the 5A6 bulge-containing Ago ternary complex (in magenta), relative to the duplex of the no-bulge control ternary complex (in silver).
Figure 3.
Figure 3.
Crystal structure of TtAgo (D546N catalytic mutant) bound to 5′-phosphorylated 21-nt guide DNA and 20-nt target RNA containing a 6’U7’ bulge positioned on the target strand within the seed segment and conformational adjustments on proceeding from control to 6’U7’ bulge-containing ternary complexes. (A) Sequence of the intended guide DNA–target RNA duplex (top panel), with the actual alignment of the bulge in the crystal structure of the ternary complex (bottom boxed panel), where an adjacent uracil loops out of the duplex between positions 6’ and 7’ of the target strand. The traceable segments of the nucleotides of the guide DNA and target RNA in the structure of the ternary complex are shown in red and blue, respectively. The dashed line for the T6–A6’ pair represents a weakened Watson–Crick pair stabilized by one hydrogen bond, while x shown for the A7•A7’ pair represents a reversed non-canonical pairing alignment. (B) 2.8 Å structure of TtAgo (D546N catalytic mutant) bound to 5′-phosphorylated 21-nt guide DNA (in red) and 20-nt target RNA (in blue) containing a 6’U7’ bulge positioned on the target strand within the seed segment. The black arrow points to the looped out bulge base. There is one molecule of the complex in the asymmetric unit and the 3′-end of the guide strand is inserted into the PAZ pocket of an adjacent molecule in the crystal lattice (see Supplementary Figure S3A). (C) A stick representation of the bulge site and two flanking base pairs on either side, with the looped out uracil highlighted in biscuit color in the 6’U7’ bulge-containing ternary complex. Note the opposing directionalities of the sugar ring oxygens (in cyan) on either side of the bulge site. (D) An overall view highlighting the looped-out uracil of the target RNA and its stacking on sheared-apart base 1 of the guide DNA in the 6’U7’ bulge-containing ternary complex. (E) Stacking of the looped our uracil with unpaired first base of the guide strand and hydrogen bonding with the side chain of Asn436 in the 6’U7’ bulge-containing ternary complex. (F) An omit map (3σ) identifying pairing alignment for the weakened Watson–Crick A6•U6’ pair (top panel) and the reversed A7•A7’ pair (bottom panel) flanking the bulged looped out uracil in the 6’U7’ bulge-containing ternary complex. (G) Superposition of the PAZ domain and guide-target duplex containing no bulge (in silver) and 6’U7’ bulge (in green) in Ago ternary complexes. A red arrow indicates the large conformational transition observed for the PAZ domain on proceeding from the no bulge (in silver) to 6’U7’ bulge (in green) ternary complexes. (H) The positioning of the RNA target strand in the no bulge-containing control (in silver) and in the 6’U7’ bulge-containing (in green) Ago ternay complexes relative to the catalytic residues of the RNase H fold of the PIWI domain in the complex. The catalytic residues are distant from the phosphate linking the 10’–11’ step (colored in magenta) and closer to the phosphate linking the 11’–12’ step in the 6’U7’ bulge-containing Ago ternary complex (in green). (I) Superposition of the seed and cleavage site segments of the guide-target duplex in the no-bulge control (in silver) and 6’U7’ bulge-containing (in green) Ago ternary complexes. (J) Schematic emphasizing base displacement of the target strand between 5–5′ and 11–11’ pairs in the duplex of the 6’U7’ bulge-containing Ago ternary complex (in green), relative to the duplex of the no-bulge control ternary complex (in silver).
Figure 4.
Figure 4.
Crystal structure of TtAgo (D546N catalytic mutant) bound to 5′-phosphorylated 21-nt guide DNA and 20-nt target RNA containing a 6’A7’ bulge positioned within the seed segment on the RNA target strand and alternate alignments of guanine bulge associated with pairing of miR-124 guide and its complementary mRNA target. (A) Sequence of the guide DNA-target RNA duplex (top panel), with the actual alignment of the bulge in the crystal structure of the ternary complex (bottom boxed panel), where the adenine loops-out of the duplex between positions 6’ and 7’ of the target strand. The traceable segments of the nucleotides of the guide DNA and target RNA in the structure of the ternary complex are shown in red and blue, respectively. The dashed line shown for T6–A6’ represents a weakened Watson–Crick pair stabilized by one hydrogen bond. The x shown for A7•U7’ represents a reversed non-canonical pairing alignment. (B) A stick representation of the bulge site and two flanking base pairs, with the looped out adenine highlighted in biscuit color in the 6’A7’ bulge-containing ternary complex. Note the opposing directionalities of the sugar ring oxygens (in cyan) on either side of the bulge site. (C) An overall view highlighting the looped-out adenine of the target RNA and its stacking on the unpaired first base of the guide DNA in the 6’A7’ bulge-containing ternary complex. (D) Stacking of the looped our adenine with sheared-apart base 1 of the guide strand and hydrogen bonding with the side chain of Met413 in the 6’A7’ bulge-containing ternary complex. (E) Omit maps (3σ) identifying pairing alignment of the weakened Watson–Crick T6•A6’ pair stabilized by one hydrogen bond (denoted by dashed line in panel A, boxed bottom panel) and reversed A7•U7’ pair (denoted by x in panel A, boxed bottom panel) flanking the looped-out adenine in the 6’A7’ bulge-containing ternary complex. (F) The positioning of the RNA target strand of the control Ago ternary complex containing no bulge (in silver) and in the 6’A7’ bulge (in salmon) relative to the catalytic residues (D478, D660, E512 and D546N mutant) of the RNase H fold of the PIWI domain in the complex. The catalytic residues are distant from the phosphate linking the 10’–11’ step (colored in magenta) and closer to the phosphate linking the 11’–12’ step in the 6’A7’ bulge (in salmon)-containing Ago ternary complex. (G) The guanine bulge is positioned at 5’G6’ on the target strand following the analysis by Chi et al. (2012). The dots represent non-canonical pairs. (H) An alternate alignment where the guanine bulge is positioned at 6’G7’ on the target strand based on structural studies on relabelled 6’U7’ and 6’A7’ bulges on the target strand of Ago ternary complexes reported in this study. The structural studies would predict that the bulged G positioned between 6’ and 7’ would loop out of the duplex and stack on base 1 of the guide strand and that the C6•G6’ pair would adopt a weakened Watson–Crick alignment (labelled by a dashed line), while the A7•C7’ pair would adopt a reversed non-canonical pairing alignment (labelled with an x).
Figure 5.
Figure 5.
Crystal structure of TtAgo containing D546N catalytic mutant bound to 5′-phosphorylated 21-nt guide DNA and 20-nt target RNA containing a 9’U10’ bulge positioned on the target strand within the cleavage site segment. (A) Sequence of the guide DNA-target RNA duplex (top panel), with the actual alignment of the bulge in the crystal structure of the ternary complex (bottom boxed panel), where an adjacent uracil loops out of the duplex between positions 9’ and 10’ of the target strand. The traceable segments of the nucleotides of the guide DNA and target RNA in the structure of the ternary complex are shown in red and blue, respectively. The dots shown for T9•U9’ and A10•G10’ (lower panel) represent non-canonical pairing alignments, with the latter forming a non-canonical sheared G•A pair. (B) 2.9 Å structure of TtAgo containing N546 catalytic mutant bound to 5′-phosphorylated 21-nt guide DNA (in red) and 20-nt target RNA (in blue) containing a 9’U10’ bulge positioned on the target strand within the seed segment. The black arrow points to the looped out bulge base. There is one molecule of the complex in the asymmetric unit and the 3′-end of the guide strand is inserted into the PAZ pocket of an adjacent molecule in the crystal lattice (not shown). (C) A stick representation of the bulge site spanning T9•U9’ and A10•G10’ non-canonical pairs, with the looped out uracil highlighted in biscuit color in the 9’U10’ bulge-containing ternary complex. (D) A stick representation of the bulge site of the guide-target duplex, with the looped out uracil highlighted in biscuit color in the 9’U10’ bulge-containing ternary complex. Note that the looped out uracil is directed towards the catalytic residues. (E) The positioning of the RNA target strand of the control Ago ternary complex containing no bulge (in silver) and in the 9’U10’ bulge (in magenta) relative to the catalytic residues (D478, D660 and D546N mutant) of the RNase H fold of the PIWI domain in the complex. The catalytic residues are distant from the phosphate linking the 10’-11’ step (colored in magenta) in the 9’U10’ bulge-containing Ago ternary complex (in magenta). (F) Superposition of the guide-target duplex containing no bulge (in silver) and 9’U10’ bulge (in magenta) in Ago ternary complexes. The guide strand is labeled g and the 10’–11’ phosphate at the cleavage site on the target strand is indicated by a red arrow.
Figure 6.
Figure 6.
Effect of bulges on DNA cleavage. (A) Schematic representation of guide and target DNAs. The guide strand 5′ phosphate and the radiolabeled 32P-phosphate of the target strand are indicated. The locations of nucleotide insertions in guide and target strands are in-between gray and blue highlighted nucleotides, respectively. The red arrowhead indicates the canonical cleavage site located between position 10’ and 11’ of the target strand. (B) Effect of bulges on DNA cleavage. TtAgo was pre-incubated with 5′ phosphorylated guide DNAs at 55°C for 30 min prior to addition of 5′ radiolabeled DNA substrate, followed by incubation at 75°C for indicated times. Cleavage products were resolved on a 15% denaturing polyacrylamide gel. The bulge positions are indicated according to structural studies. The fraction of target cleaved was quantified by phosphorimaging and shown at the bottom. The cleavage fraction corresponding to the minor product observed for the 4A5 guide is indicated in parenthesis below the fraction of the major product. (C) Effect of the identity of guide insertions on DNA cleavage. Cleavage assays were performed for every possible insertion between positions 7 and 8 on the guide DNA. The reduction in TtAgo activity in comparison to (C) is due to an additional freeze-thaw cycle of the TtAgo enzyme, which results in partial loss of activity.
Figure 7.
Figure 7.
Effect of bulges on RNA cleavage. (A) Schematic representation of guide DNA and target RNAs. (B) TtAgo was pre-incubated with 5′ phosphorylated guide DNA at 55°C for 30 min prior to addition of 5′ radiolabeled RNA substrates, followed by incubation at 75°C for indicated times. Products were resolved on a 15% denaturing polyacrylamide gel. Red arrowheads indicate the cleavage site. The sequence of let-7 is shown on the left to annotate the hydrolysis and cleavage positions. The bulge positions are indicated according to structural studies and inserted nucleotides are shown in blue. H, alkaline hydrolysis ladder of 5′ labeled target RNA. Hydrolysis yields terminal 2′,3′-cyclic phosphate, which further hydrolyze to 2′- and 3′-monophosphate. These distinctly charged products resolve towards the bottom of the gel into double bands and are grouped by brackets. TtAgo cleavage products carry a 3′-OH and therefore migrate slower than the RNA hydrolysis products of the same sequence.

References

    1. Dykxhoorn D.M., Novina C.D., Sharp P.A.. Killing the messenger: short RNAs that silence gene expression. Nat. Rev. Mol. Cell Biol. 2003; 4:457–467. - PubMed
    1. Baulcombe D. RNA silencing in plants. Nature. 2004; 431:356–363. - PubMed
    1. Filipowicz W. RNAi: the nuts and bolts of the RISC machine. Cell. 2005; 122:17–20. - PubMed
    1. Rana T.M. Illuminating the silence: understanding the structure and function of small RNAs. Nat. Rev. Mol. Cell Biol. 2007; 8:23–36. - PubMed
    1. Hutvagner G., Simard M.J.. Argonaute proteins: key players in RNA silencing. Nat. Rev. Mol. Cell Biol. 2008; 9:22–32. - PubMed

MeSH terms

LinkOut - more resources