. 2017 Sep 6;45(15):8968-8977.
doi: 10.1093/nar/gkx584.

Genome-wide analysis of influenza viral RNA and nucleoprotein association

Affiliations

Genome-wide analysis of influenza viral RNA and nucleoprotein association

Nara Lee et al. Nucleic Acids Res. .

Abstract

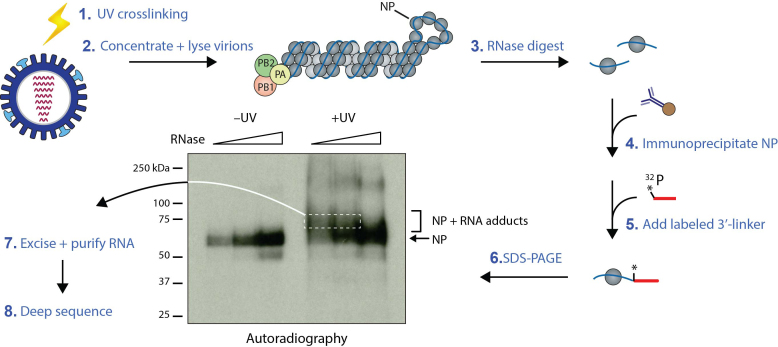
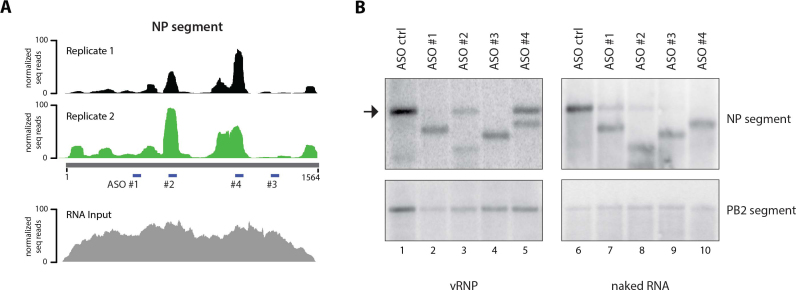
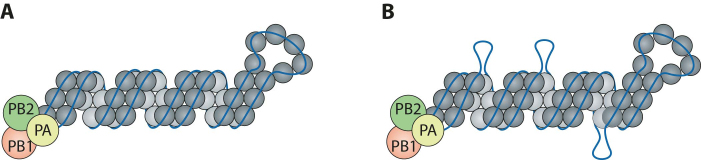
Influenza A virus (IAV) genomes are composed of eight single-stranded RNA segments that are coated by viral nucleoprotein (NP) molecules. Classically, the interaction between NP and viral RNA (vRNA) is depicted as a uniform pattern of 'beads on a string'. Using high-throughput sequencing of RNA isolated by crosslinking immunoprecipitation (HITS-CLIP), we identified the vRNA binding profiles of NP for two H1N1 IAV strains in virions. Contrary to the prevailing model for vRNA packaging, NP does not bind vRNA uniformly in the A/WSN/1933 and A/California/07/2009 strains, but instead each vRNA segment exhibits a unique binding profile, containing sites that are enriched or poor in NP association. Intriguingly, both H1N1 strains have similar yet distinct NP binding profiles despite extensive sequence conservation. Peaks identified by HITS-CLIP were verified as true NP binding sites based on insensitivity to DNA antisense oligonucleotide-mediated RNase H digestion. Moreover, nucleotide content analysis of NP peaks revealed that these sites are relatively G-rich and U-poor compared to the genome-wide nucleotide content, indicating an as-yet unidentified sequence bias for NP association in vivo. Taken together, our genome-wide study of NP-vRNA interaction has implications for the understanding of influenza vRNA architecture and genome packaging.


Figures

Figure 1.
Figure 1.
Schematic representation of the HITS-CLIP protocol for influenza virions. Culture supernatant containing intact influenza virus particles were subjected to UV light irradiation, and virions were subsequently harvested by ultracentrifugation on a 30% sucrose cushion to obtain highly pure samples. Virions were then lysed, subjected to a partial RNase A digestion and immunoprecipitation using an anti-NP antibody. Actual autoradiograph of a representative NP HITS-CLIP with IAV strain A/WSN/1933 is shown. Only following UV treatment (+UV), crosslinked NP–RNA adducts (bracket) appear, which migrate slower in the gel than monomeric NP (arrow) and contain viral RNA footprints of NP present in virions. Size selection was performed by excising these slower migrating bands in the +UV sample (white dashed box), followed by isolation of RNA and preparation of deep sequencing libraries. Sequencing was performed on the Illumina NextSeq500 platform, and reads were mapped to influenza reference genomes.
Figure 2.
Figure 2.
NP binding profile determined by HITS-CLIP for A/WSN/1933 (WSN, black) and A/California/07/2009 (H1N1pdm, blue) strains. (A–H) IGV tracks of all eight IAV segments are shown; their names and nucleotide lengths are indicated at the bottom of each track. Abundance of HITS-CLIP reads (y-axis) were normalized against the highest peak in each individual vRNA segment and arbitrarily set to 100. Profiles of both H1N1 viruses do not adhere to the classical model of uniform and random association of NP with vRNA, but exhibit specific NP peaks as well as regions not enriched for NP. Both H1N1 strains have a similar yet distinct NP binding profile, reflected by a Pearson correlation coefficient of 0.411, indicative of a moderate positive correlation.
Figure 3.
Figure 3.
Validation of NP binding sites identified by HITS-CLIP. (A) The NP HITS-CLIP results from two independent biological replicates are shown for the NP segment as a representative. The NP binding profiles of the replicates are highly reproducible, evidenced by a Pearson correlation coefficient of 0.798 (please also see Supplementary Table S1 for details). The RNA-seq track of total RNA input is shown in the bottom panel, which does not display the same peaks observed in the HITS-CLIP experiments. Note that the 5′ and 3′ ends of the segments are underrepresented due to the fact that tagmentation was used for library preparation. Sites targeted by DNA ASO #1–4 used in RNase H digestion assays are indicated. (B) DNA ASO-mediated RNase H digestion assay. vRNA accessibility assay was performed on WSN viral lysate containing vRNA segments complexed with NP. DNA ASO #1–4 were used to target regions of the NP segment depicted in A. Northern blot analysis for NP segment was carried out to examine accessibility as determined by RNase H digestion. NP peaks identified by HITS-CLIP are greatly protected from degradation, demonstrating NP binding at regions targeted by ASO #2 and 4, while predicted NP-depleted regions targeted by ASO #1 and 3 are not. The same assay was performed with purified naked viral RNA (lanes 6–10), resulting in robust RNase H-mediated degradation by all ASOs. Unlike viral lysate, addition of ASO #1 to naked RNA results in partial segment degradation (compare lanes 2 and 6), probably due to formation of secondary structures of naked RNA, which interferes with the accessibility of ASOs. Arrow indicates full-length/non-degraded NP segment. Northern blot against the PB2 segment is shown as a negative control.
Figure 4.
Figure 4.
Analysis of nucleotide contents of NP peaks and non-peaks. (A) The peak-finding algorithm MACS was used to predict NP binding sites. The WSN PB2 segment is shown as a representative. The BED track (blue) underneath the HITS-CLIP profile indicates the called peaks. Non-peaks were defined as regions not called as peaks in MACS and those containing less than 5% read coverage of the maximum peak height for each HITS-CLIP experiment (orange BED track). The dashed red line indicates the 5%-threshold. For mean peak widths, see Supplementary Table S2. (B) Nucleotide compositions of each WSN peak defined by MACS (blue) and non-peak (orange) are graphed as a scatter plot as a percentage of the corresponding sequence. Mean and standard deviations are shown. The overall genome-wide nucleotide composition of WSN vRNA segments is displayed in green. A statistically significant difference, denoted by an asterisk, in the G and U content between peaks and non-peaks was observed (two-way ANOVA analysis, P-value < 0.0001). No statistically significant differences were observed for the percentages of A and C bases. All peak and non-peak regions from WSN segments are plotted as a representative; H1N1pdm peaks show the same trend in that peaks are G-rich and U-poor compared to the overall genome-wide nucleotide content (Supplementary Table S2).
Figure 5.
Figure 5.
Proposed revised model for NP–vRNA packaging. Based on our data, not all regions of the influenza genome are coated uniformly by NP as previously suggested (A). (B) Instead, some regions may be tightly associated with NP (peaks), while other regions (non-peaks) may provide a more dynamic association with NP and reveal regions free of NP (shown here as loops).

References

    1. Hutchinson E.C., Charles P.D., Hester S.S., Thomas B., Trudgian D., Martinez-Alonso M., Fodor E.. Conserved and host-specific features of influenza virion architecture. Nat. Commun. 2014; 5:4816. - PMC - PubMed
    1. Ortega J., Martin-Benito J., Zurcher T., Valpuesta J.M., Carrascosa J.L., Ortin J.. Ultrastructural and functional analyses of recombinant influenza virus ribonucleoproteins suggest dimerization of nucleoprotein during virus amplification. J. Virol. 2000; 74:156–163. - PMC - PubMed
    1. Arranz R., Coloma R., Chichon F.J., Conesa J.J., Carrascosa J.L., Valpuesta J.M., Ortin J., Martin-Benito J.. The structure of native influenza virion ribonucleoproteins. Science. 2012; 338:1634–1637. - PubMed
    1. Moeller A., Kirchdoerfer R.N., Potter C.S., Carragher B., Wilson I.A.. Organization of the influenza virus replication machinery. Science. 2012; 338:1631–1634. - PMC - PubMed
    1. Eisfeld A.J., Neumann G., Kawaoka Y.. At the centre: influenza A virus ribonucleoproteins. Nat. Rev. Microbiol. 2015; 13:28–41. - PMC - PubMed

MeSH terms