Extensive transcriptomic and epigenomic remodelling occurs during Arabidopsis thaliana germination
- PMID: 28911330
- PMCID: PMC5599894
- DOI: 10.1186/s13059-017-1302-3
Extensive transcriptomic and epigenomic remodelling occurs during Arabidopsis thaliana germination
Abstract
Background: Seed germination involves progression from complete metabolic dormancy to a highly active, growing seedling. Many factors regulate germination and these interact extensively, forming a complex network of inputs that control the seed-to-seedling transition. Our understanding of the direct regulation of gene expression and the dynamic changes in the epigenome and small RNAs during germination is limited. The interactions between genome, transcriptome and epigenome must be revealed in order to identify the regulatory mechanisms that control seed germination.
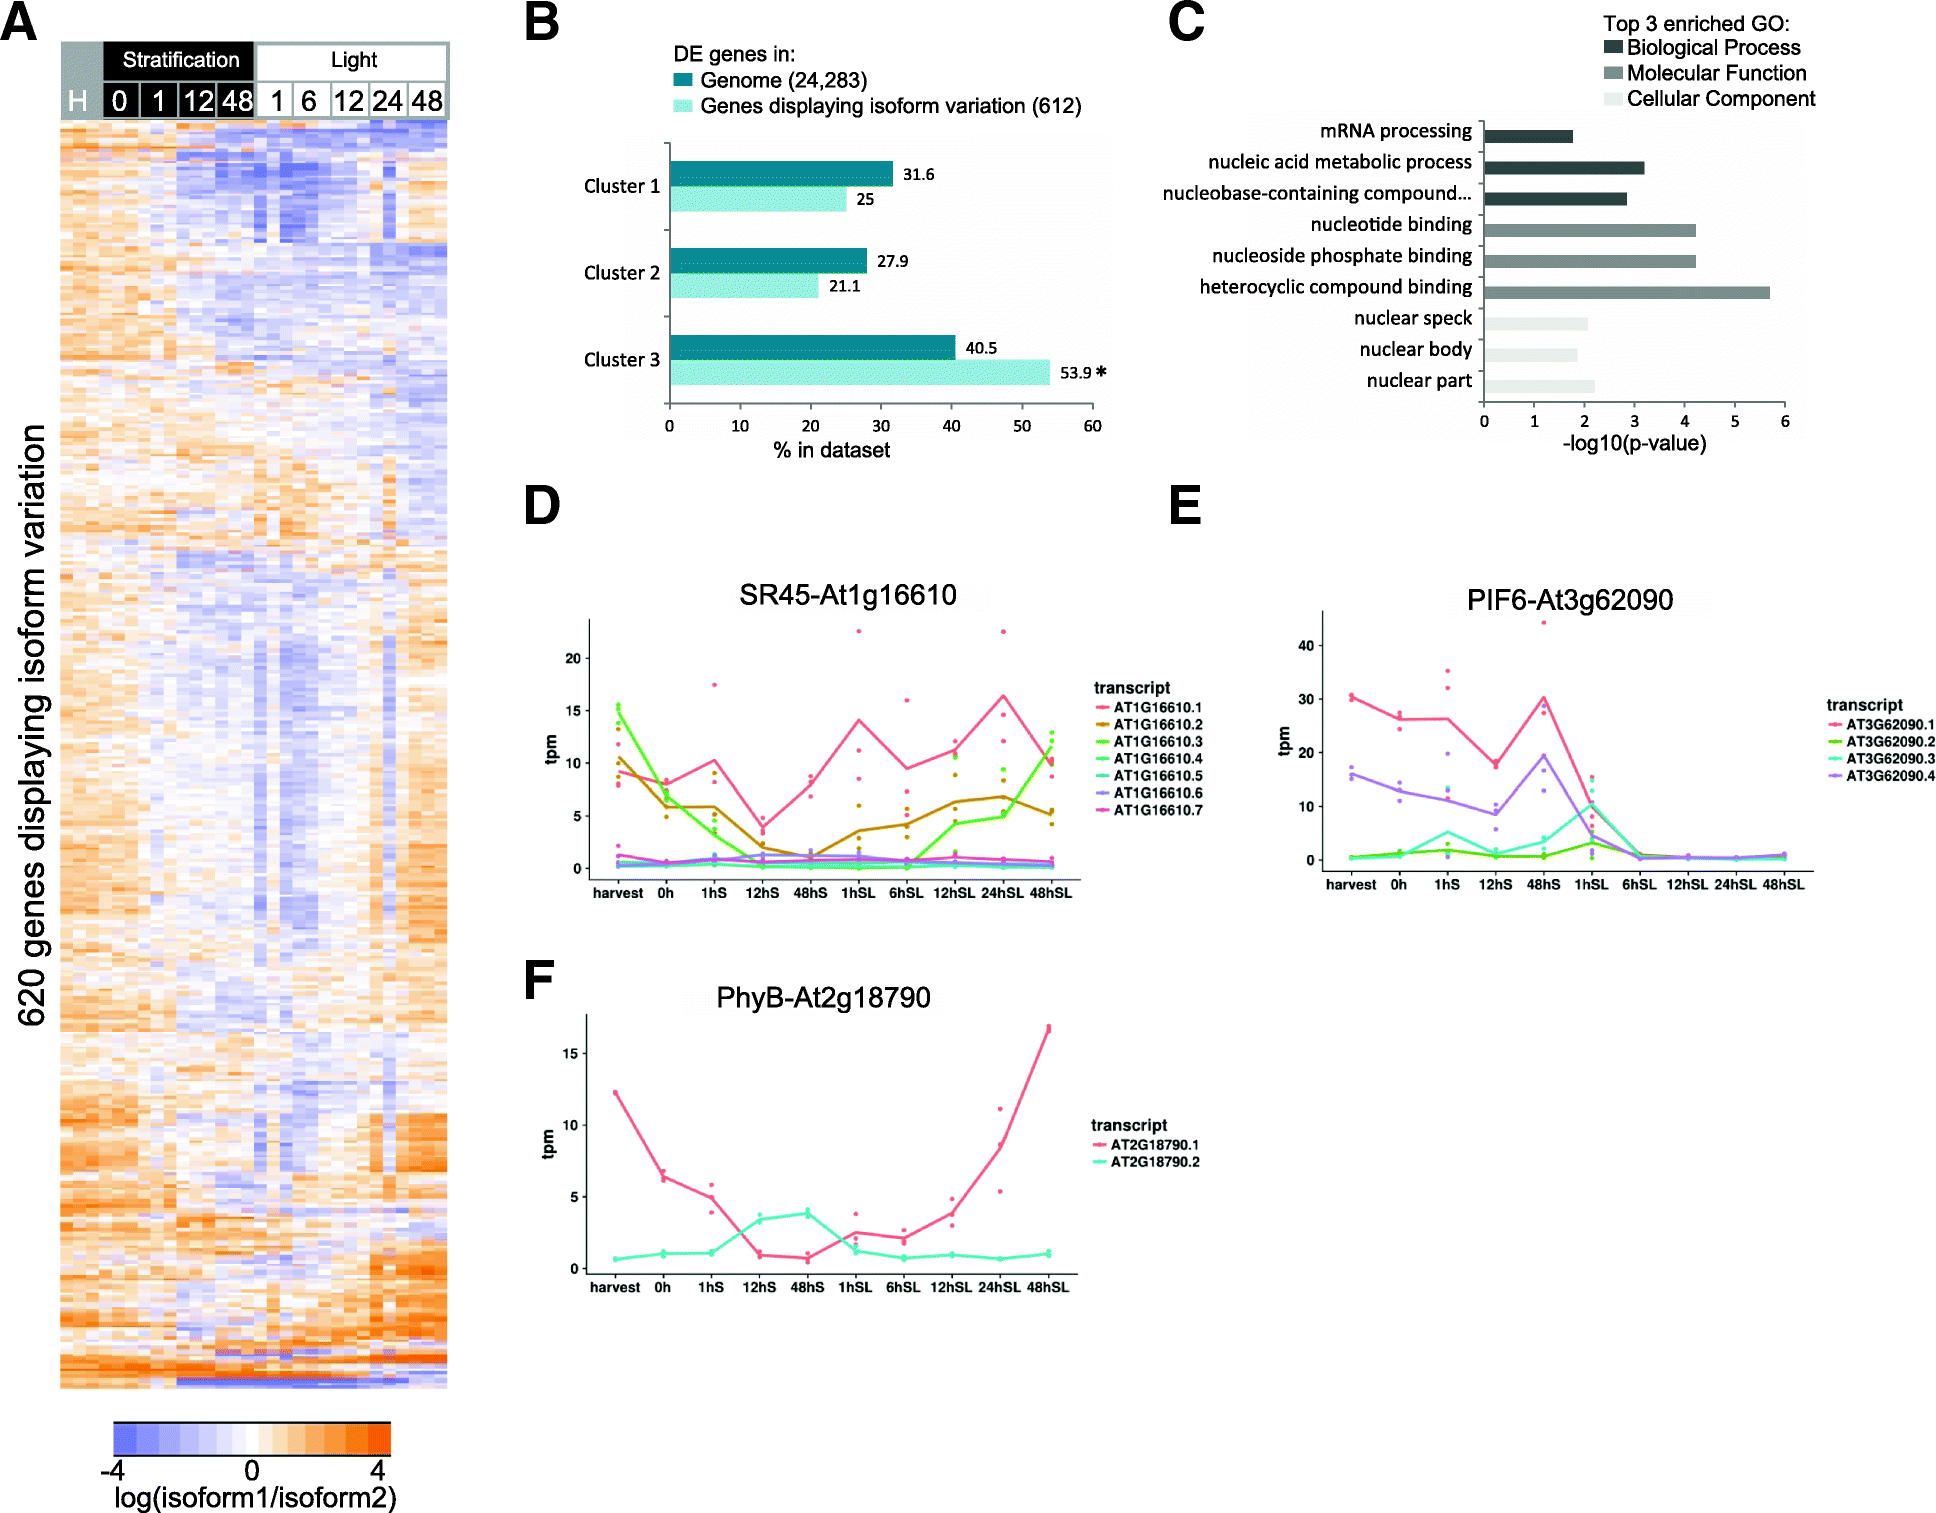
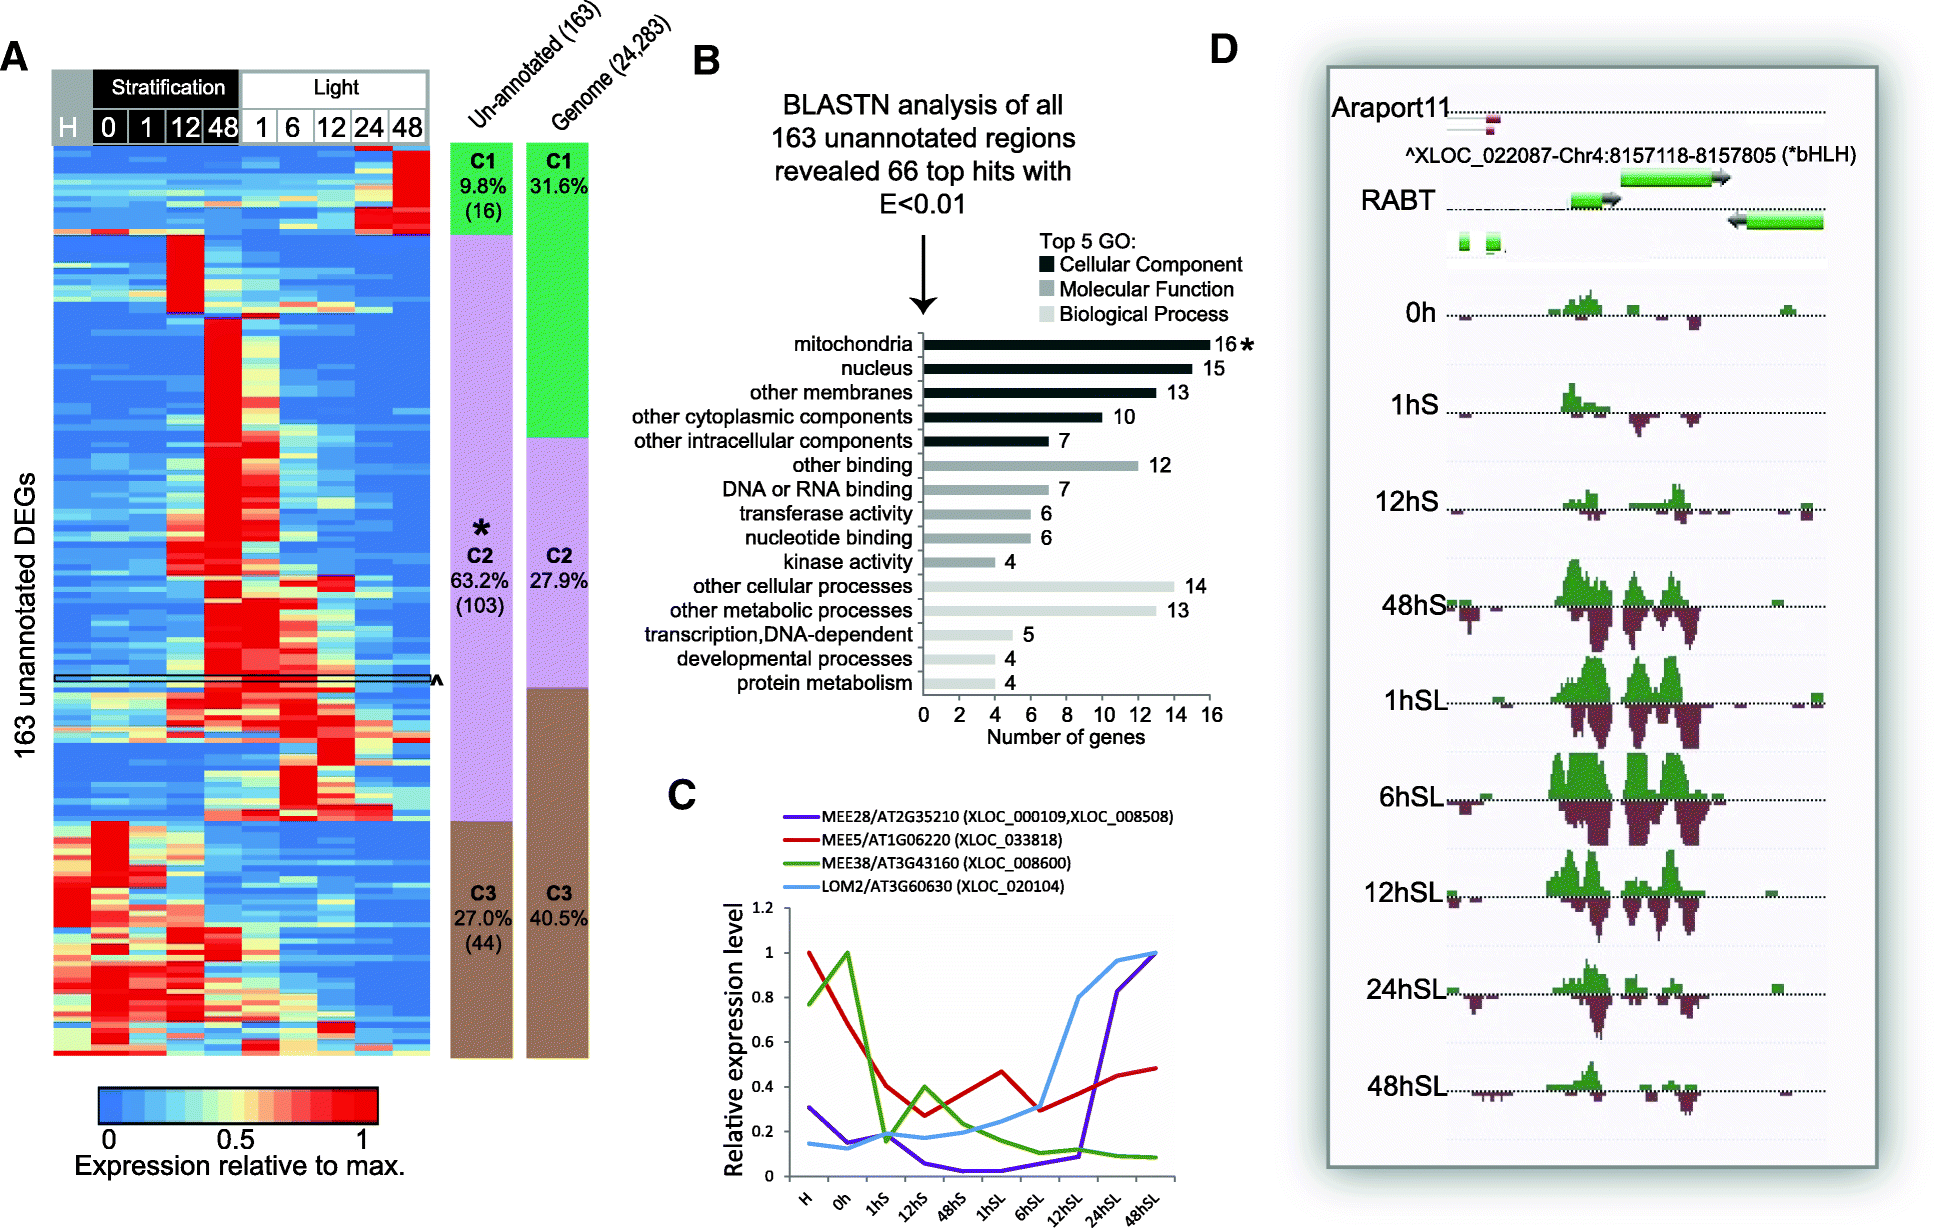
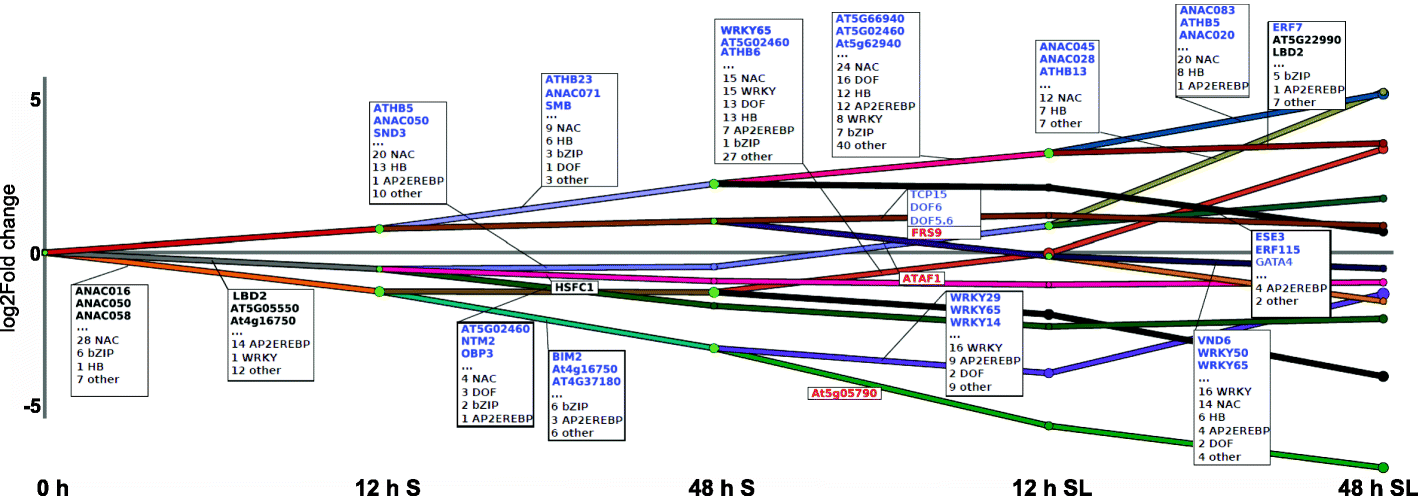
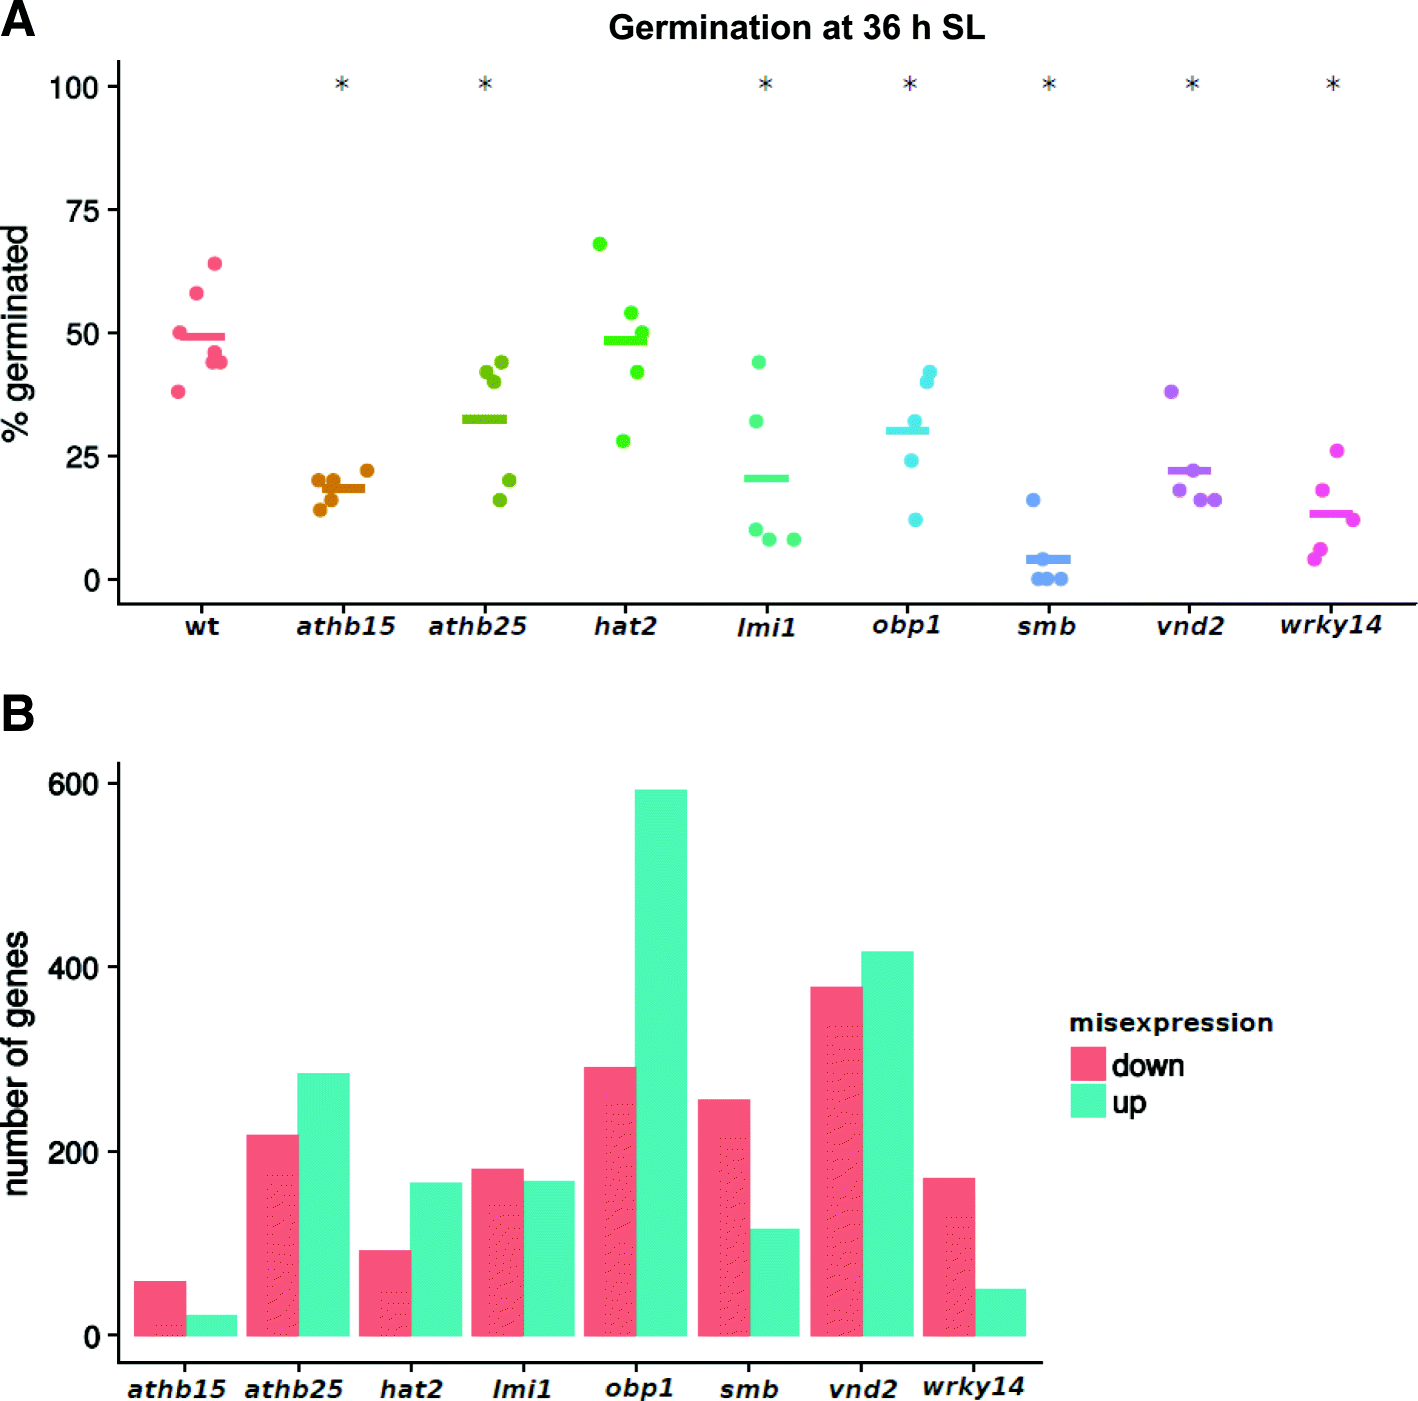
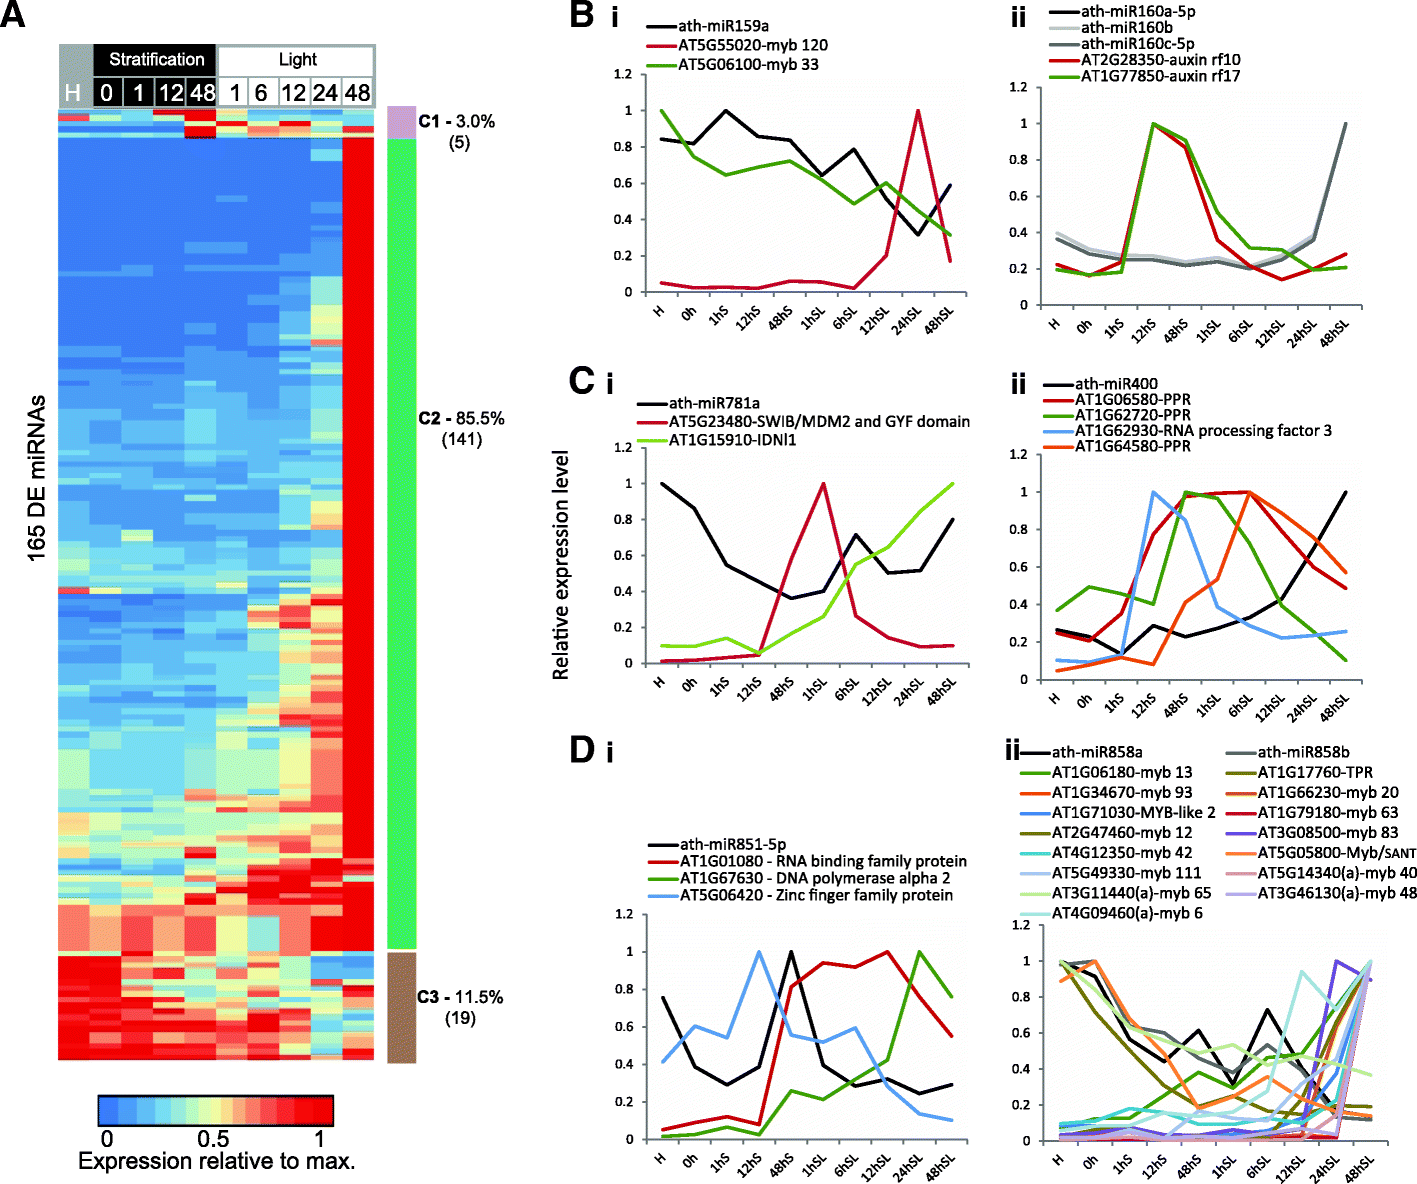
Results: We present an integrated analysis of high-resolution RNA sequencing, small RNA sequencing and MethylC sequencing over ten developmental time points in Arabidopsis thaliana seeds, finding extensive transcriptomic and epigenomic transformations associated with seed germination. We identify previously unannotated loci from which messenger RNAs are expressed transiently during germination and find widespread alternative splicing and divergent isoform abundance of genes involved in RNA processing and splicing. We generate the first dynamic transcription factor network model of germination, identifying known and novel regulatory factors. Expression of both microRNA and short interfering RNA loci changes significantly during germination, particularly between the seed and the post-germinative seedling. These are associated with changes in gene expression and large-scale demethylation observed towards the end of germination, as the epigenome transitions from an embryo-like to a vegetative seedling state.
Conclusions: This study reveals the complex dynamics and interactions of the transcriptome and epigenome during seed germination, including the extensive remodelling of the seed DNA methylome from an embryo-like to vegetative-like state during the seed-to-seedling transition. Data are available for exploration in a user-friendly browser at https://jbrowse.latrobe.edu.au/germination_epigenome .
Keywords: Alternative splicing; Arabidopsis; DNA methylation; Germination; RNA-seq; Small RNA; Transcription factor.
Conflict of interest statement
Consent for publication
Not applicable.
Competing interests
The authors declare that they have no competing interests.
Figures



Comment in
-
Development: Epigenome dynamics from seed to seedling.Nat Rev Genet. 2017 Nov;18(11):637. doi: 10.1038/nrg.2017.78. Epub 2017 Sep 25. Nat Rev Genet. 2017. PMID: 28944781 No abstract available.
Similar articles
-
Non-coding and epigenetic mechanisms in the regulation of seed germination in Arabidopsis thaliana.J Exp Bot. 2025 Jun 17;76(9):2455-2467. doi: 10.1093/jxb/eraf051. J Exp Bot. 2025. PMID: 39918256 Review.
-
In-depth temporal transcriptome profiling reveals a crucial developmental switch with roles for RNA processing and organelle metabolism that are essential for germination in Arabidopsis.Plant Physiol. 2011 Nov;157(3):1342-62. doi: 10.1104/pp.111.183129. Epub 2011 Sep 9. Plant Physiol. 2011. PMID: 21908688 Free PMC article.
-
Dynamic DNA methylation reconfiguration during seed development and germination.Genome Biol. 2017 Sep 15;18(1):171. doi: 10.1186/s13059-017-1251-x. Genome Biol. 2017. PMID: 28911331 Free PMC article.
-
Transcriptome profiles revealed molecular mechanisms of alternating temperatures in breaking the epicotyl morphophysiological dormancy of Polygonatum sibiricum seeds.BMC Plant Biol. 2021 Aug 12;21(1):370. doi: 10.1186/s12870-021-03147-7. BMC Plant Biol. 2021. PMID: 34384392 Free PMC article.
-
Heterochromatin dynamics during developmental transitions in Arabidopsis - a focus on ribosomal DNA loci.Gene. 2013 Aug 15;526(1):39-45. doi: 10.1016/j.gene.2013.01.060. Epub 2013 Feb 12. Gene. 2013. PMID: 23410919 Review.
Cited by
-
Voice from both sides: a molecular dialogue between transcriptional activators and repressors in seed-to-seedling transition and crop adaptation.Front Plant Sci. 2024 Aug 6;15:1416216. doi: 10.3389/fpls.2024.1416216. eCollection 2024. Front Plant Sci. 2024. PMID: 39166233 Free PMC article. Review.
-
Comprehensive assembly and analysis of the transcriptome of maritime pine developing embryos.BMC Plant Biol. 2018 Dec 29;18(1):379. doi: 10.1186/s12870-018-1564-2. BMC Plant Biol. 2018. PMID: 30594130 Free PMC article.
-
Dark-Induced Senescence Causes Localized Changes in DNA Methylation.Plant Physiol. 2020 Feb;182(2):949-961. doi: 10.1104/pp.19.01154. Epub 2019 Dec 2. Plant Physiol. 2020. PMID: 31792150 Free PMC article.
-
Alternative Oxidase (AOX) Senses Stress Levels to Coordinate Auxin-Induced Reprogramming From Seed Germination to Somatic Embryogenesis-A Role Relevant for Seed Vigor Prediction and Plant Robustness.Front Plant Sci. 2019 Sep 20;10:1134. doi: 10.3389/fpls.2019.01134. eCollection 2019. Front Plant Sci. 2019. PMID: 31611888 Free PMC article.
-
Subtle Perturbations of the Maize Methylome Reveal Genes and Transposons Silenced by Chromomethylase or RNA-Directed DNA Methylation Pathways.G3 (Bethesda). 2018 May 31;8(6):1921-1932. doi: 10.1534/g3.118.200284. G3 (Bethesda). 2018. PMID: 29618467 Free PMC article.
References
-
- Bewley JD, Bradford K, Hilhorst H, Nonogaki H. Seeds: Physiology of development, germination and dormancy. 3rd ed. Springer; 2013.
Publication types
MeSH terms
Substances
LinkOut - more resources
Full Text Sources
Other Literature Sources
Molecular Biology Databases

