. 2017 Dec;1862(12):1606-1617.
doi: 10.1016/j.bbalip.2017.09.004. Epub 2017 Sep 12.

Assessing the mechanisms of cholesteryl ester transfer protein inhibitors

Affiliations

Assessing the mechanisms of cholesteryl ester transfer protein inhibitors

Meng Zhang et al. Biochim Biophys Acta Mol Cell Biol Lipids. 2017 Dec.

Abstract

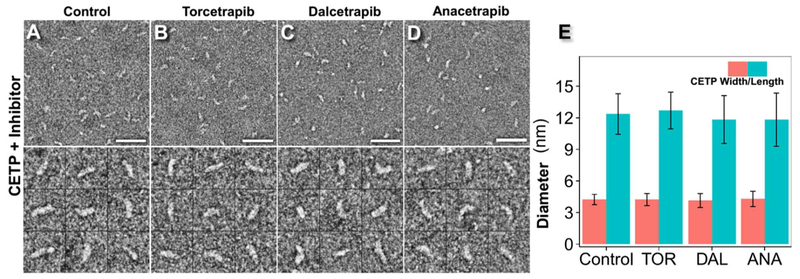
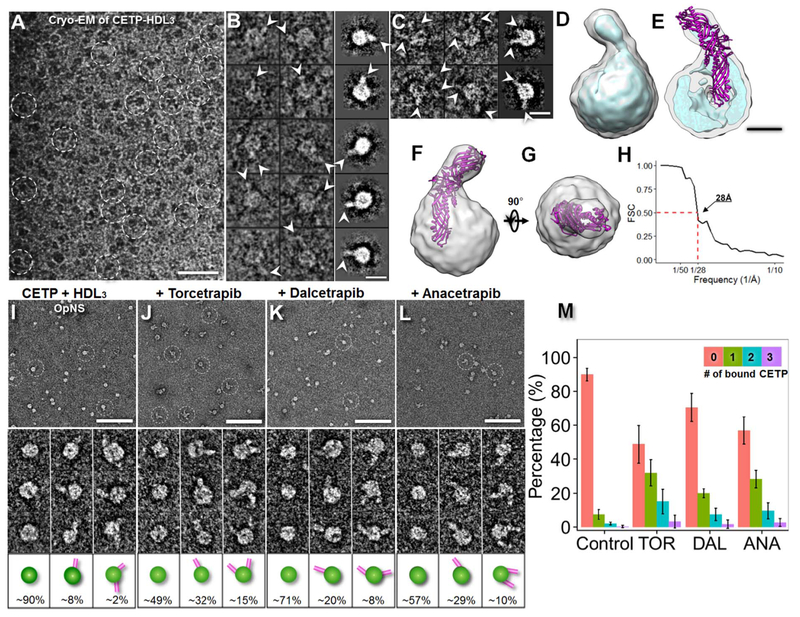
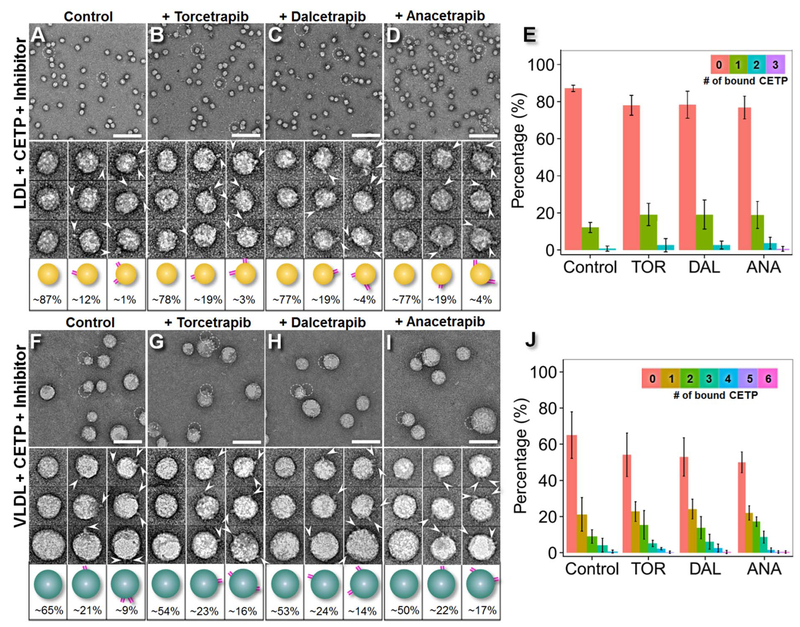
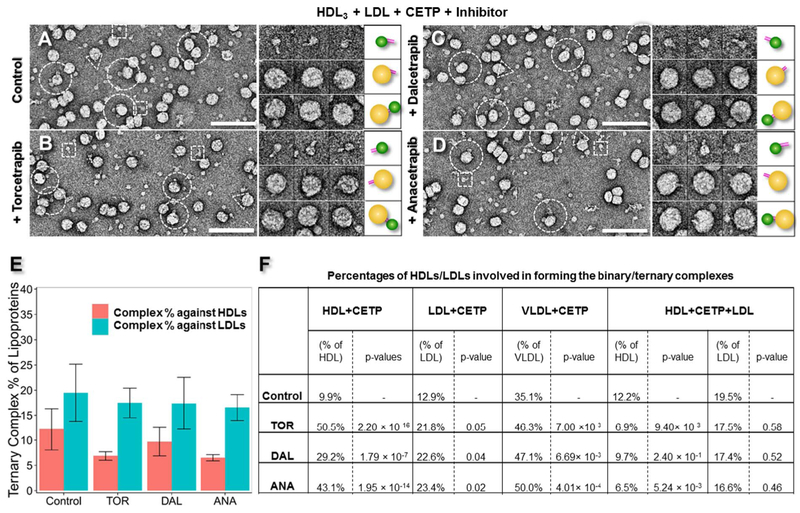
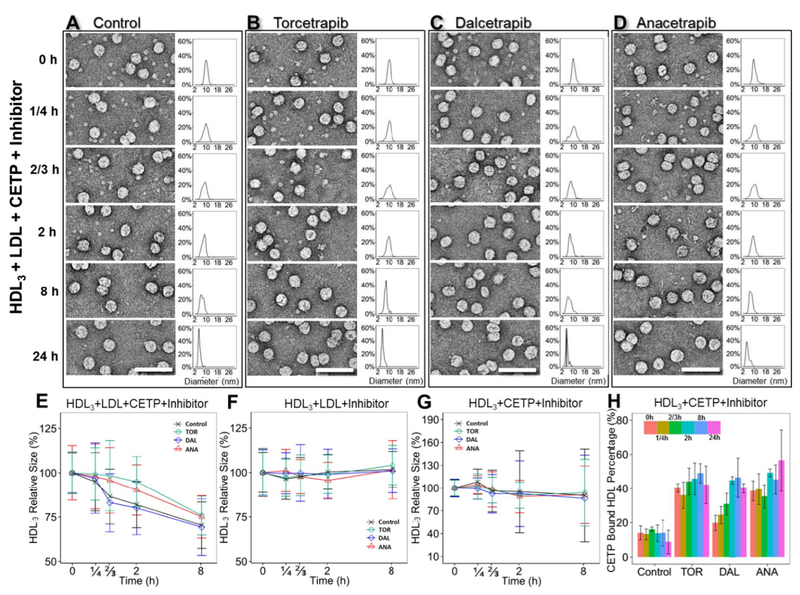
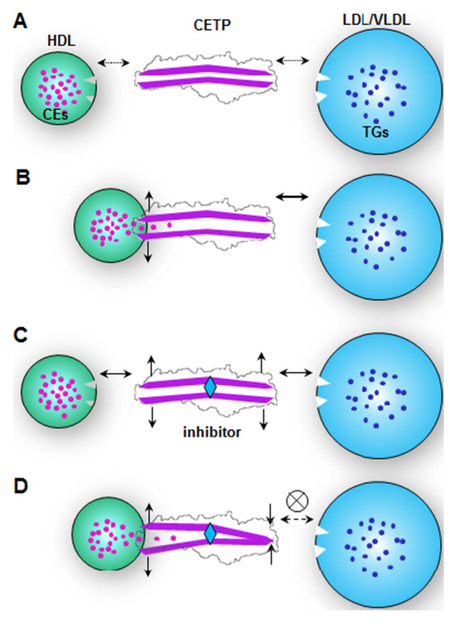
Cholesteryl ester transfer protein (CETP) inhibitors are a new class of therapeutics for dyslipidemia that simultaneously improve two major cardiovascular disease (CVD) risk factors: elevated low-density lipoprotein (LDL) cholesterol and decreased high-density lipoprotein (HDL) cholesterol. However, the detailed molecular mechanisms underlying their efficacy are poorly understood, as are any potential mechanistic differences among the drugs in this class. Herein, we used electron microscopy (EM) to investigate the effects of three of these agents (Torcetrapib, Dalcetrapib and Anacetrapib) on CETP structure, CETP-lipoprotein complex formation and CETP-mediated cholesteryl ester (CE) transfer. We found that although none of these inhibitors altered the structure of CETP or the conformation of CETP-lipoprotein binary complexes, all inhibitors, especially Torcetrapib and Anacetrapib, increased the binding ratios of the binary complexes (e.g., HDL-CETP and LDL-CETP) and decreased the binding ratios of the HDL-CETP-LDL ternary complexes. The findings of more binary complexes and fewer ternary complexes reflect a new mechanism of inhibition: one distal end of CETP bound to the first lipoprotein would trigger a conformational change at the other distal end, thus resulting in a decreased binding ratio to the second lipoprotein and a degraded CE transfer rate among lipoproteins. Thus, we suggest a new inhibitor design that should decrease the formation of both binary and ternary complexes. Decreased concentrations of the binary complex may prevent the inhibitor was induced into cell by the tight binding of binary complexes during lipoprotein metabolism in the treatment of CVD.

Keywords: Anacetrapib; CETP; CETP bound to HDL; CETP inhibitor; Cholesteryl ester transfer protein; Dalcetrapib; Electron microscopy; HDL; LDL; Torcetrapib; VLDL.


Figures

Fig. 1.
Fig. 1.
Effects of inhibitors on CETP structure by OpNS EM. A) Survey view of optimized negative-staining EM images (top panel) and representative particle images of CETP (bottom panel), B) CETP incubated with Torcetrapib, C) CETP incubated with Dalcetrapib, D) CETP incubated with Anacetrapib, each at 37 °C for up to 1 h. E) Statistical analysis of CETP dimensions before and after treatment with inhibitors. p-values of 0.13, 0.06 and 0.06 were obtained for length and 0.91, 0.24 and 0.51 for width after treatment with Torcetrapib, Dalcetrapib and Anacetrapib, respectively (Student’s t-test). Particle window size: A–D, 30 nm. Scale bars: 45 nm.
Fig. 2.
Fig. 2.
Effects of inhibitors on CETP bound to HDL, as determined by cryo-EM and OpNS EM. A) Cryo-EM survey view of the complexes of CETP bound with human plasma HDL3 embedded in vitreous ice (dashed circles). B) Representative cryo-EM images (contrast inverted, left column) and reference-free class averages (shown in the right column) of the complexes of one HDL3 bound to one CETP molecule and C) one HDL3 bound to two CETP molecules. D) Cryo-EM 3D density map of the CETP-HDL complex reconstructed by a single-particle 3D reconstruction method from a relatively homogenous population of particles (3200 complexes, approximately 13% of total particles) displayed in two contour levels (the gray contour level corresponds to the molecular volume of the complex, whereas the cyan contour level corresponds to approximately 37% of the molecular volume). E) Cutaway surface view showing that the spherical HDL has a diameter of approximately 97 Å with an approximately 20 Å thick high-density shell and an approximately 50 Å diameter inner low-density core. F) and G) Two perpendicular views of the CETP-HDL cryo-EM reconstruction showing the crystal structure of the docked CETP within the envelope of the EM density map. An approximately 55 Å-long portion of the CETP N-terminal penetrated or merged with the HDL surface. H) The FSC curve showing that the resolution of the cryo-EM single-particle 3D reconstruction is approximately 28 Å according to the 0.5 Fourier shell correlation criterion. I) OpNS EM survey images (top panel), representative particle images (middle panel) and the corresponding particle cartoons with their populations (bottom panel) of the samples of HDL3 incubated with CETP. The CETP-HDL complexes are indicated by white dashed circles. The sample was also repeated under co-incubation with J) Torcetrapib, K) Dalcetrapib or L) Anacetrapib. The percentages of HDL particles involved in binding with no CETP, binding with one CETP and binding with two CETPs are shown at the bottom of the corresponding cartoons. The percentage of HDL particles binding more than two CETPs is not shown. The percentage of HDL was calculated by dividing the total number of HDL + CETP binary complexes by the total number of HDL particles (including the particles forming into binary complexes). M) Histogram of the percentage of CETP-bound HDL over the entire HDL population. p-values of 2.20 × 10⁻¹⁶, 1.79 × 10⁻⁷ and 1.95 × 10⁻¹⁴ were obtained for Torcetrapib, Dalcetrapib and Anacetrapib, respectively, via Pearson’s chi-square test. Particle window size: I–L, 30 nm. Scale bars: A, 50 nm; B and C, 10 nm; E, 4 nm; I–L, 100 nm.
Fig. 3.
Fig. 3.
Effects of inhibitors on CETP bound to LDL/VLDL by OpNS EM. A) OpNS EM survey images (top panel), representative particle images (middle panel) and the corresponding particle cartoons with their populations (bottom panel) of human plasma LDL incubated with CETP and the sample after incubation with B) Torcetrapib, C) Dalcetrapib, or D) Anacetrapib at 37 °C. E) Histogram of the percentage of CETP-bound LDL over the entire LDL population (with corresponding p-values of 0.05, 0.04, and 0.02 for Torcetrapib, Dalcetrapib and Anacetrapib, respectively). The percentage of LDL was calculated by dividing the total number of LDL + CETP binary complexes by the total number of LDL particles (including the particles incorporated into binary complexes. F) OpNS survey images (top panel), representative particle images (middle panel) and the corresponding particle cartoons with their populations (bottom panel) of human plasma VLDL incubated with CETP and the sample after incubation with G) Torcetrapib, H) Dalcetrapib, or I) Anacetrapib at 37 °C. J) Histogram of the percentage of CETP-bound VLDL over the entire VLDL population (with corresponding p-values of 7.00 × 10⁻³, 6.69 × 10⁻³ and 4.01 × 10⁻⁴ for Torcetrapib, Dalcetrapib and Anacetrapib, respectively). Statistics were calculated with Pearson’s chi-square test. The percentages of LDL and VLDL particles involved in binding no CETP, one CETP and two or more CETPs are shown at the bottoms of the corresponding cartoons. The percentages of LDL and VLDL particles binding more than two CETPs are not shown. Particle window size: A–D, 45 nm; F–I, 60 nm. Scale bars: A–D, 140 nm; F–I, 70 nm.
Fig. 4.
Fig. 4.
Effects of inhibitors on CETP in bridging HDL and LDL by OpNS EM. A) OpNS survey EM images (left panel), representative particle images (middle panel) and corresponding particle cartoons (right panel) of the CETP incubated with human plasma HDL3 and LDL simultaneously at 37 °C. The sample was also examined in the presence of B) Torcetrapib, C) Dalcetrapib, or D) Anacetrapib. In the survey views, the CETP-HDL3, CETP-LDL and HDL-CETP-LDL complexes are indicated by white dashed squares, triangles and circles, respectively. Images of the CETP-HDL3 complexes are shown in the top panels, the CETP-LDL complexes are shown in the middle panels and the LDL-CETP-HDL3 complexes are shown in the bottom panels. E) Statistical analyses of the percentages of LDL or HDL in an HDL-CETP-LDL ternary complex with corresponding p-values for LDL (Torcetrapib: 0.58; Dalcetrapib: 0.52 and Anacetrapib: 0.46) and for HDL (Torcetrapib: 9.40 × 10⁻³; Dalcetrapib: 2.40 × 10⁻¹ and Anacetrapib: 5.24 × 10⁻³). The statistical analysis was conducted with Pearson’s chi-square test. F) A collection of all statistics of the binary and ternary complex ratios formed after CETP inhibitor treatment. The percentage of bound HDL was calculated by dividing the total number of HDL + CETP + LDL ternary complexes by the total number of HDL particles (including the particles in binary and ternary complexes). The percentage of bound LDL was calculated by dividing the total number of HDL + CETP + LDL ternary complexes by the total number of LDL particles (including the particles in binary and ternary complexes). Particle window size: A–D, 48 nm. All scale bars: 80 nm.
Fig. 5.
Fig. 5.
Effects of inhibitors on the CE transfer rate between plasma HDL3 and LDL, as shown by OpNS EM. Comparison of CETP lipid transfer activity and binding affinity during the incubation of human plasma HDL3, LDL and CETP with or without inhibitors for 0 min, 15 min, 40 min, 2 h, 8 h and 24 h at 37 °C. OpNS EM images of the samples at representative incubation times are presented in the top left columns for A) the control group, B) Torcetrapib, C) Dalcetrapib, and D) Anacetrapib. The corresponding HDL size distributions are shown in top right columns. Quantitative diameter analysis of the HDL particles at 0 min, 15 min, 40 min, 2 h and 8 h for samples of E) a mixture of HDL, LDL, CETP and inhibitors; F) a mixture of HDL, LDL and inhibitors; and G) a mixture of HDL, CETP and inhibitors are shown in the bottom panel. A total of 300–500 HDL3 particles were assessed for each category. The particle diameters were measured on the basis of the geometric mean of two diameters: the longest diameter and its perpendicular diameter. Samples treated with control buffer, Torcetrapib, Dalcetrapib and Anacetrapib are represented by black, green, blue and orange lines, respectively. H) Histogram of the percentage of CETP-bound HDL against incubation times in the sample of HDL and CETP with inhibitors. Different incubation time periods are represented by different colors. All scale bars: 75 nm. The error bars in E, F, G and H are standard deviations.
Fig. 6.
Fig. 6.
A hypothesis for the CETP inhibitor mechanism. A) Lipoproteins (including HDL, LDL and VLDL) have intermediate binding affinities to the CETP when CETP is in a near “closed” confirmation in solution. B) While one distal end of CETP interacts with one class of lipoproteins, such as HDL, the CEs of HDL are then taken up into CETP, and they produce a conformational change, increasing the binding affinity to other classes of lipoproteins, such as LDL or VLDL. C) The CETP inhibitor bound to the middle portion of the CETP triggers conformational changes at both distal ends, thereby increasing their binding affinities to both classes of lipoproteins. D) However, after neutral lipids, such as CEs, are taken up into one distal end, a conformational change is triggered at the opposite end thus decreasing the binding affinity to other classes of lipoproteins.

Similar articles

Cited by

References

    1. Barter PJ, Brewer HB Jr., Chapman MJ, Hennekens CH, Rader DJ, Tall AR, Cholesteryl ester transfer protein: a novel target for raising HDL and inhibiting atherosclerosis, Arterioscler. Thromb. Vasc. Biol 23 (2003) 160–167. - PubMed
    1. Vergeer M, Holleboom AG, Kastelein JJ, Kuivenhoven JA, The HDL hypothesis: does high-density lipoprotein protect from atherosclerosis? J. Lipid Res 51 (2010) 2058–2073. - PMC - PubMed
    1. Inazu A, Brown ML, Hesler CB, Agellon LB, Koizumi J, Takata K, Maruhama Y, Mabuchi H, Tall AR, Increased high-density lipoprotein levels caused by a common cholesteryl-ester transfer protein gene mutation, N. Engl. J. Med 323 (1990) 1234–1238. - PubMed
    1. Brown ML, Inazu A, Hesler CB, Agellon LB, Mann C, Whitlock ME, Marcel YL, Milne RW, Koizumi J, Mabuchi H, et al., Molecular basis of lipid transfer protein deficiency in a family with increased high-density lipoproteins, Nature 342 (1989) 448–451. - PubMed
    1. Barter PJ, Caulfield M, Eriksson M, Grundy SM, Kastelein JJ, Komajda M, Lopez-Sendon J, Mosca L, Tardif JC, Waters DD, Shear CL, Revkin JH, Buhr KA, Fisher MR, Tall AR, Brewer B, Investigators I, Effects of torcetrapib in patients at high risk for coronary events, N. Engl. J. Med 357 (2007) 2109–2122. - PubMed

Publication types

MeSH terms