. 2017 Nov 15;23(22):7059-7071.
doi: 10.1158/1078-0432.CCR-17-0249. Epub 2017 Sep 14.

Macropinocytosis of Bevacizumab by Glioblastoma Cells in the Perivascular Niche Affects their Survival

Affiliations

Macropinocytosis of Bevacizumab by Glioblastoma Cells in the Perivascular Niche Affects their Survival

Gaëlle Müller-Greven et al. Clin Cancer Res. .

Abstract

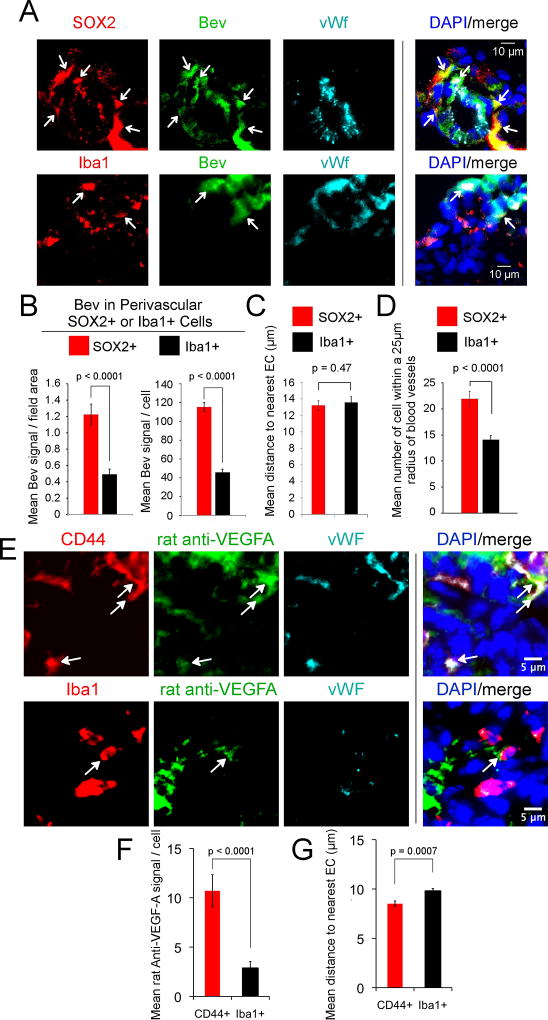
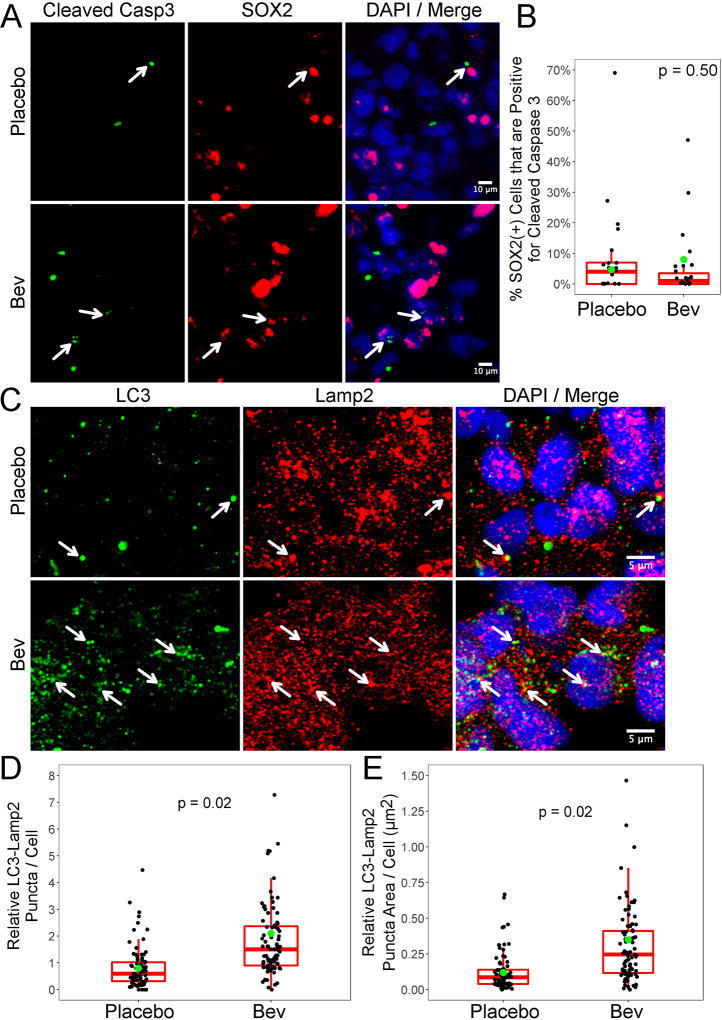
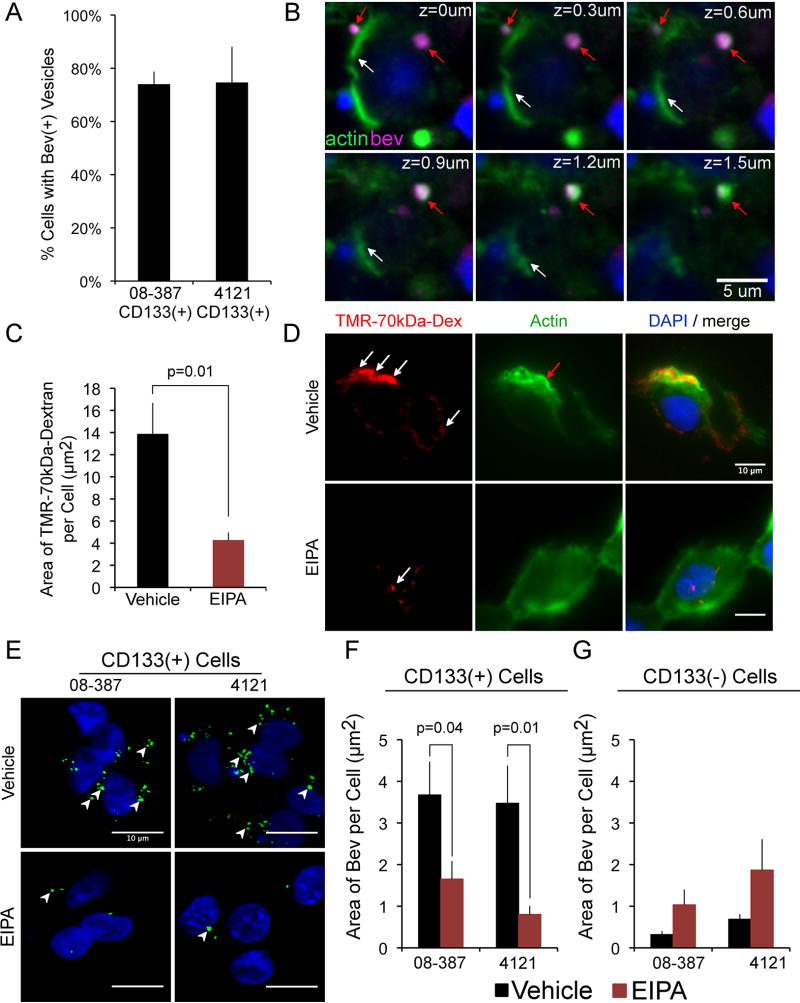
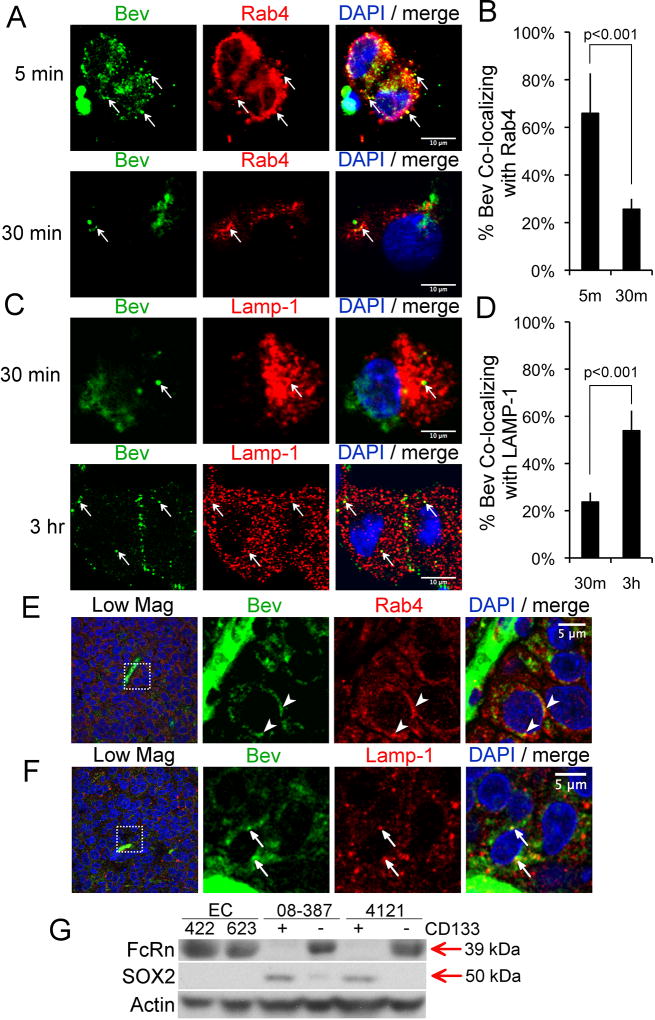
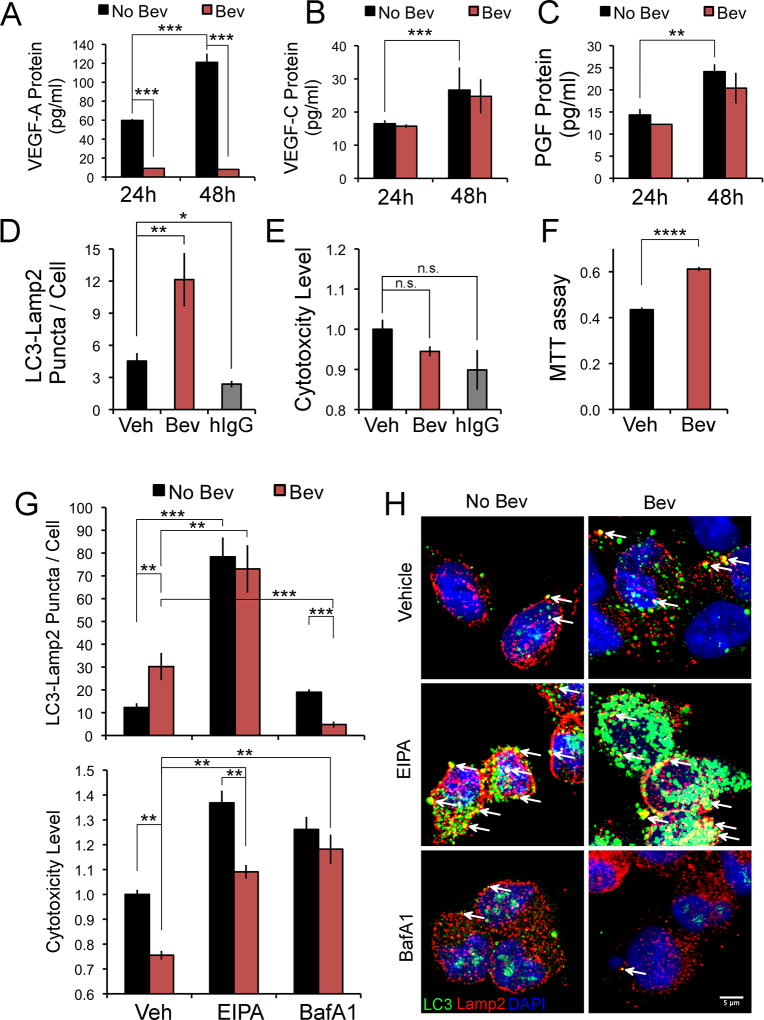
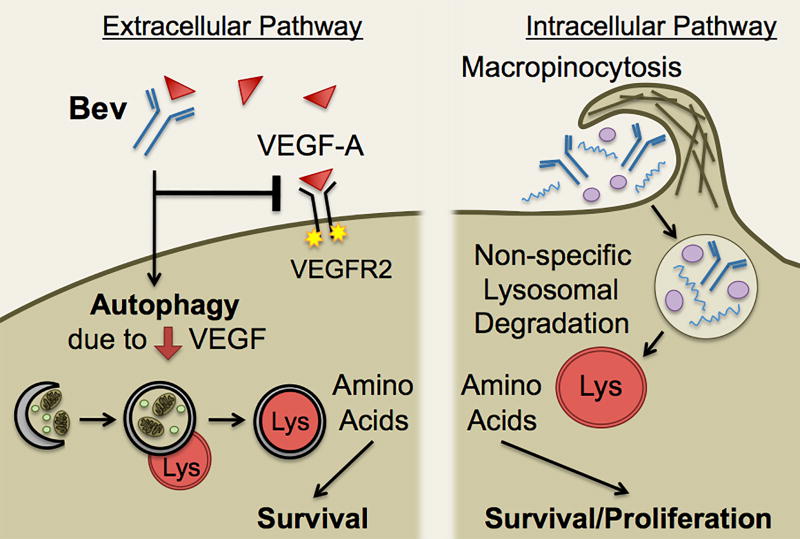
Purpose: Bevacizumab, a humanized monoclonal antibody to VEGF, is used routinely in the treatment of patients with recurrent glioblastoma (GBM). However, very little is known regarding the effects of bevacizumab on the cells in the perivascular space in tumors.Experimental Design: Established orthotopic xenograft and syngeneic models of GBM were used to determine entry of monoclonal anti-VEGF-A into, and uptake by cells in, the perivascular space. Based on the results, we examined CD133+ cells derived from GBM tumors in vitro Bevacizumab internalization, trafficking, and effects on cell survival were analyzed using multilabel confocal microscopy, immunoblotting, and cytotoxicity assays in the presence/absence of inhibitors.Results: In the GBM mouse models, administered anti-mouse-VEGF-A entered the perivascular tumor niche and was internalized by Sox2+/CD44+ tumor cells. In the perivascular tumor cells, bevacizumab was detected in the recycling compartment or the lysosomes, and increased autophagy was found. Bevacizumab was internalized rapidly by CD133+/Sox2+-GBM cells in vitro through macropinocytosis with a fraction being trafficked to a recycling compartment, independent of FcRn, and a fraction to lysosomes. Bevacizumab treatment of CD133+ GBM cells depleted VEGF-A and induced autophagy thereby improving cell survival. An inhibitor of lysosomal acidification decreased bevacizumab-induced autophagy and increased cell death. Inhibition of macropinocytosis increased cell death, suggesting macropinocytosis of bevacizumab promotes CD133+ cell survival.Conclusions: We demonstrate that bevacizumab is internalized by Sox2+/CD44+-GBM tumor cells residing in the perivascular tumor niche. Macropinocytosis of bevacizumab and trafficking to the lysosomes promotes CD133+ cell survival, as does the autophagy induced by bevacizumab depletion of VEGF-A. Clin Cancer Res; 23(22); 7059-71. ©2017 AACR.


Figures

Figure 1
Figure 1
Bevacizumab gains access to the perivascular tumor space and is internalized predominantly by perivascular Sox2+/CD44+ tumor cells in PDX xenograft and syngeneic mouse models of GBM. A–D, PDX GBM tumors (G39 or G59) were injected intracerebrally into the nude mouse (300,000 cells), and treatment with bevacizumab (5 mg/kg, i.p., 2X/week) or placebo initiated on day 13 (G39) or day 28 (G59). Treatment was continued until the development of neurologic signs at day 23 (G39) or day 50–77 (G59), followed by euthanasia, brain harvest, freezing in OCT media, and storage at −80°C. Sections from three mouse tumors from each of the two GBM xenografts treated with bevacizumab were reacted with Alexa-488-anti-hIgG (green) and anti-Sox2 (2.5 µg/ml) or anti-Iba1 (0.5 µg/ml) antibody (red), and rabbit or mouse anti-vWf (5 µg/ml or 2 µg/ml, respectively) antibody (blue), followed by Alexa-594-conjuated- and Alexa-647-conjugated secondary antibodies and DAPI nuclear stain (A). Area of tumor from mouse administered bevacizumab shown. Arrows denote bevacizumab in Sox2+ tumor cells or in Iba1+ activated microglia/macrophages (A). Scale bars denote 10-µm (A). Bevacizumab fluorescent intensity in Sox2+ or in Iba1+ perivascular cells was quantitated as the mean signal intensity/field area and as the mean signal/cell using ImageJ in the six bevacizumab-treated G39 and G59 GBM xenograft tumors (B). The mean distance of bevacizumab-positive Sox2+ or Iba1+ perivascular cell from the nearest EC was quantitated using ImageJ on the same six xenograft tumors (C). The mean number of Sox2+ or Iba1+ cells within a 25-µm radius of vWf-positive blood vessels was quantitated on the same six xenograft tumors (D). E-G, The syngeneic somatic gene transfer model of GBM was generated by intracerebral injection of four 6- to −8-week-old Ntv-a/ink4a–arf−/− mice with RCAS-PDGF-B-HA. After four weeks, treatment with rat anti-mouse VEGF-A IgG (5 mg/kg, i.p., 2X/week) was initiated and continued for 2 weeks, followed by euthanasia, brain harvest, fixation in 4% paraformaldehyde, immersion in sucrose and freezing (−80°C). Tumor bearing sections (5-µm) were reacted with Alexa-488-anti-rat IgG (green), sheep anti-mouse CD44 (5 µg/ml) or rabbit anti-Iba1 (red), and rabbit or mouse anti-vWf, respectively (as above) (blue), followed by Alexa-594 and Alexa-647-conjugated secondary antibodies, and DAPI nuclear stain (E). Rat anti-mouse-VEGF-A fluorescent intensity in CD44+ or in Iba1+ perivascular cells was quantitated as the mean signal intensity/cell using ImageJ in the four mice (F). The mean distance of rat anti-mouse-VEGF-A-positive CD44+ or Iba1+ perivascular cell from the nearest EC was quantitated using ImageJ on the same four tumors (G). Statistical analyses in panels B–D, F&G: linear mixed model.
Figure 2
Figure 2
Bevacizumab treatment of an orthotopic xenograft model of GBM induces autophagy. A&B, Sections of xenograft GBM tumor from the G39 and G59 PDX tumors treated with bevacizumab or placebo were reacted with rabbit anti-cleaved caspase-3 (0.2 µg/ml) (green) and mAb anti-Sox2 (2.5 µg/ml) (red) antibodies, followed by Alexa-488 and Alexa-594-conjugated secondary antibodies, DAPI nuclear stain and confocal microscopy. Representative photographs of tumor are shown (A). Quantitation of the number of double-labeled cleaved caspase-3 and Sox2+ cells in five representative fields/tumor (B). Data are graphed as Box and Whisker plots. C–E, Sections of xenograft GBM tumor from the G39, G59 and G44 PDX tumors treated with bevacizumab or placebo were reacted with anti-LC3 (2ug/ml) and anti-LAMP2 (4ug/ml) antibodies, followed by Alexa-488 and Alexa-594-conjugated secondary antibodies, DAPI nuclear stain and confocal microscopy. Representative photographs of tumor are shown (C). Quantitation of the number of LC3-LAMP2-positive puncta/cell in 10 representative fields/tumor (D); the adjusted means are 2.1 versus 0.8 for bevacizumab-treated versus placebo-treated tumors, respectively (p=0.02). Quantitation of the area of LC3-LAMP2-positive puncta/cell in10 representative fields/tumor (E); the adjusted means are 0.35 versus 0.12 for bevacizumab-treated versus placebo-treated tumors, respectively (p=0.02). Data are graphed as Box and Whisker plots; the green dots represent the adjusted means. In panel D, two data points in the bevacizumab-treated group (10.36 and 14.73) were removed for graphing purposes, but were included in the statistical analysis. In panel E, one data point in the bevacizumab-treated group (3.23) was removed for graphing purposes, but was included in the statistical analysis. Statistical analyses panels B, D and E: linear mixed model.
Figure 3
Figure 3
Bevacizumab is internalized by CD133+ cells into membrane ruffles in a mechanism consistent with macropinocytosis. A&B, CD133+ cells were plated onto laminin in NBM without bFGF or EGF for 18 h (37°C, 5% CO2), followed by the addition of bevacizumab (250 µg/ml) for 5 min, the cells washed, fixed, reacted with Alexa-647-anti-human IgG (5ug/ml) and Alexa-488-phalloidin (5 units/ml), followed by DAPI nuclear stain, cover slipping, and confocal microscopy. Percent of CD133+ cells from two different tumor isolates (08–387 and 4121) containing bevacizumab-positive vesicles (A). A z-stack of the double-labeling is shown (CD133+ 08–387 cells) (B). White arrows denote phalloidin-stained cell membrane (green), and red arrows denote bevacizumab-positive vesicle (magenta) surrounded by actin. Scale bar denotes 5-µm. C&D, CD133+ cells (08–387) treated with 50 µM EIPA or vehicle for 30 min (37°C, 5% CO2), followed by addition of TMR-70-kDa-Dextran (1mg/ml) (red) for 5 min, were washed, reacted with Alexa-488-Phalloidin (green), nuclei stained with DAPI, cover slipped and microscopy performed. In cells treated with vehicle, TMR-70-kDa-Dextran is found in membrane ruffles (white arrows), containing polymerized actin (red arrows) (D). In cells treated with EIPA, reduced amounts of TMR-70-kDa-Dextran are internalized (C&D). The area (µm2) of TMR-70-kDa-Dextran/cell is plotted as the mean±SEM from >100 cells/condition (C). E–G, CD133+ GBM cells (08–387 and 4121) were plated on laminin in NBM as in panels A–D, and paired non-stem tumor cells (CD133-negative 08–387 and 4121) were plated in DMEM with 10% FBS for 18 h. CD133+ cells or the paired CD133-negative tumor cells were treated with vehicle or 50 µM EIPA for 30 min as above, followed by addition of bevacizumab (5 min), and the cells washed, fixed, reacted with Alexa-488-anti-human IgG, followed by DAPI nuclear stain, cover slipping and microscopy. Arrowheads denote bevacizumab-positive vesicles which are reduced in CD133+ cells treated with EIPA (E&F) but are not reduced in CD133-negative tumor cells treated with EIPA (G). The area (µm2) of bevacizumab/cell is plotted as the mean±SEM from >100 cells/condition (F&G). Scale bars denote 10-µm. Statistical analyses: exact two-sided Wilcoxon rank-sum tests.
Figure 4
Figure 4
Co-localization of a fraction of bevacizumab with Rab4 and a fraction with LAMP1 in CD133+ cells in vitro and in Sox2+ perivascular tumor cells in vivo A–D, CD133+ GBM cells (08–387) were plated for 18 h as in Figure 3, followed by addition of bevacizumab (250 µg/ml) for 5 min, the cells washed and fixed or the media replaced and the cells washed and fixed at the indicated times. The cells were reacted with Alexa-488-anti-human IgG and anti-Rab4 (1:33 dilution of lot#OL196003) or anti-LAMP1 (3.3 ug/ml) antibody, Alexa-594-conjugated secondary antibody, and DAPI nuclear stain, followed by confocal microscopy. Arrows denote co-localization of bevacizumab (green) with Rab4 or LAMP1 (red) (A&C). The percent bevacizumab co-localized with Rab4 or LAMP1 is plotted as the mean±SEM at the indicated times based on the Mander’s coefficient (B&D). Statistical analyses: Panels B&D, two-sided exact Wilcoxon rank-sum tests. Scale bars denotes 10-µm. E–F, Sections of xenograft GBM tumor from mice that were treated with bevacizumab as in SFig. 1A&B were reacted with Alexa-488-anti-human IgG and anti-Rab4 or anti-LAMP1 antibody, and Alexa-594-conjugated-secondary antibody, followed by DAPI nuclear stain and confocal microscopy. Arrowheads or arrows denote co-localization of bevacizumab (green) with Rab4 (red) (E) or with LAMP1 (red) (F). The box in the far-left image in panels E and F is magnified in the subsequent images. Scale bar denotes 5-µm. G, CD133+ cells (08–387 and 4121) were detergent lysed from cells in suspension culture in NBM without addition of EGF and bFGF; CD133-negative non-stem tumor cells cultured in DMEM with 10% FBS were washed and lysed; and primary brain ECs (isolate #422 or 623) plated on collagen in the recommended media with 10% FBS were washed and detergent lysed. Lysates (50 µg per sample) were electrophoresed on SDS-PAGE, and western blotted with the indicated antibodies.
Figure 5
Figure 5
Bevacizumab trafficking in CD133+ cells affects two survival pathways. CD133+ cells were plated as in Figure 3 in NBM without addition of EGF and bFGF, treated with bevacizumab or hIgG for 24 or 48 h (1 mg/ml), and the media removed for ELISA assay (A–C), or the cells washed, fixed and reacted with anti-LC3 antibody (2 µg/ml) (green) and anti-LAMP2 antibody (4 µg/ml) (red), followed by Alexa-488 and Alexa-594-conjugated secondary antibodies, DAPI nuclear stain and confocal microscopy (D, G&H), or the cells subjected to a cytotoxicity/death assay (E&G) or an MTT assay (F). A–C, Levels of VEGF-A or VEGF-C or PGF protein in the media of CD133+ cells treated with bevacizumab or vehicle are graphed as the mean±SEM at the time points shown. The levels of VEGF-A with bevacizumab treatment at 24 and 48 h were 9.18+0.32 pg/ml and 8.04+0.34 pg/ml (mean±SEM), respectively. D, Colocalization of LC3-LAMP2 puncta/cell in CD133+ cells treated with bevacizumab, hIgG or vehicle for 24 h. Quantitation of the area of colocalization (ImageJ) from ten fields/condition is graphed as the mean±SEM. E, Quantitation of cell cytotoxicity/death (relative to vehicle) after bevacizumab, hIgG or vehicle treatment for 24 h, and graphed as the mean±SEM. F, Quantitation of viability/proliferation in CD133+ cells treated with bevacizumab or vehicle for 48 h. G&H, Colocalization (ImageJ) of LC3 puncta with LAMP2 (10 fields/condition) or quantitation of cell cytotoxicity/death (relative to vehicle) is shown in CD133+ cells treated with bevacizumab or vehicle for 48 h, with or without inhibitors, and is graphed as the mean+SEM (G). Representative images of the colocalization of the LC3-LAMP2 puncta in the same six conditions is shown (H). Arrows denote co-localization (yellow) (H). Statistical analyses: Panels A–C, and F, two-sided exact Wilcoxon rank-sum tests; D and E, the Steel Method; and G, Wilcoxon rank-sum tests. *Denotes p value < 0.05; **denotes p value < 0.01; ***denotes p value < 0.001; and ****denotes p value <0.0001. n.s., denotes not significant.
Figure 6
Figure 6
Schematic depicting the effect of bevacizumab trafficking on two survival pathways in CD133+ cells from GBM. Bevacizumab gains access to the perivascular tumor tissue by leakage across an altered BBB, followed by macropinocytosis by CD133+ cells and trafficking to a Rab4 recycling compartment (not shown) or a LAMP1 lysosomal compartment, as well as bevacizumab neutralization of VEGF-A in the perivascular space inducing autophagy. Macropinocytosis of bevacizumab results in partial trafficking to the lysosome where non-specific degradation occurs, and this generates amino acids (basic building blocks) for the cell that promotes survival/proliferation. The depletion of VEGF in the extracellular environment by bevacizumab results in growth factor starvation-induced autophagy that also promotes survival.

References

    1. Gilbertson RJ, Rich JN. Making a tumour’s bed: glioblastoma stem cells and the vascular niche. Nat Rev Cancer. 2007;7(10):733–6. - PubMed
    1. Lu-Emerson C, Duda DG, Emblem KE, Taylor JW, Gerstner ER, Loeffler JS, et al. Lessons from anti-vascular endothelial growth factor and anti-vascular endothelial growth factor receptor trials in patients with glioblastoma. J Clin Oncol. 2015;33(10):1197–213. - PMC - PubMed
    1. Friedman HS, Prados MD, Wen PY, Mikkelsen T, Schiff D, Abrey LE, et al. Bevacizumab alone and in combination with irinotecan in recurrent glioblastoma. J Clin Oncol. 2009;27(28):4733–40. - PubMed
    1. Vredenburgh JJ, Desjardins A, Herndon JE, 2nd, Marcello J, Reardon DA, Quinn JA, et al. Bevacizumab plus irinotecan in recurrent glioblastoma multiforme. J Clin Oncol. 2007;25(30):4722–9. - PubMed
    1. Nowosielski M, Wiestler B, Goebel G, Hutterer M, Schlemmer HP, Stockhammer G, et al. Progression types after antiangiogenic therapy are related to outcome in recurrent glioblastoma. Neurology. 2014;82(19):1684–92. - PubMed

MeSH terms