. 2017 Oct 25;37(43):10258-10277.
doi: 10.1523/JNEUROSCI.2085-17.2017. Epub 2017 Sep 14.

Neutrophils Are Critical for Myelin Removal in a Peripheral Nerve Injury Model of Wallerian Degeneration

Affiliations

Neutrophils Are Critical for Myelin Removal in a Peripheral Nerve Injury Model of Wallerian Degeneration

Jane A Lindborg et al. J Neurosci. .

Abstract

Wallerian degeneration (WD) is considered an essential preparatory stage to the process of axonal regeneration. In the peripheral nervous system, infiltrating monocyte-derived macrophages, which use the chemokine receptor CCR2 to gain entry to injured tissues from the bloodstream, are purportedly necessary for efficient WD. However, our laboratory has previously reported that myelin clearance in the injured sciatic nerve proceeds unhindered in the Ccr2-/- mouse model. Here, we extensively characterize WD in male Ccr2-/- mice and identify a compensatory mechanism of WD that is facilitated primarily by neutrophils. In response to the loss of CCR2, injured Ccr2-/- sciatic nerves demonstrate prolonged expression of neutrophil chemokines, a concomitant extended increase in the accumulation of neutrophils in the nerve, and elevated phagocytosis by neutrophils. Neutrophil depletion substantially inhibits myelin clearance after nerve injury in both male WT and Ccr2-/- mice, highlighting a novel role for these cells in peripheral nerve degeneration that spans genotypes.SIGNIFICANCE STATEMENT The accepted view in the basic and clinical neurosciences is that the clearance of axonal and myelin debris after a nerve injury is directed primarily by inflammatory CCR2+ macrophages. However, we demonstrate that this clearance is nearly identical in WT and Ccr2-/- mice, and that neutrophils replace CCR2+ macrophages as the primary phagocytic cell. We find that neutrophils play a major role in myelin clearance not only in Ccr2-/- mice but also in WT mice, highlighting their necessity during nerve degeneration in the peripheral nervous system. These degeneration studies may propel improvements in nerve regeneration and draw critical parallels to mechanisms of nerve degeneration and regeneration in the CNS and in the context of peripheral neuropathies.

Keywords: Wallerian degeneration; axotomy; macrophages; neutrophils; phagocytosis; sciatic nerve.


Figures

Figure 1.
Figure 1.
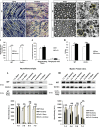
Time course of myelin clearance shows significantly more myelin removal in Ccr2−/− nerves than in WT nerves at 3 d after axotomy. A, Luxol fast blue staining represented as a percentage area stained for WT nerves. n = 4 or 5 mice per genotype per time point. Between injury: F(1,34) = 149.76. **p < 0.001 (ANOVA). Between time points: F(3,32) = 18.05. **p < 0.001 (ANOVA). B, Luxol fast blue staining represented as a percentage area stained for Ccr2−/− nerves. n = 4 or 5 mice per genotype per time point. Between injury: F(1,40) = 182.07. **p < 0.001 (ANOVA). Between time points: F(3,38) = 20.41. *p = 0.006 (ANOVA). **p < 0.001 (ANOVA). C, Luxol fast blue staining represented as a percentage decrease over sham-operated nerves. Data are represented as the average of two separate experiments wherein each time point has n = 4 or 5 mice per genotype. t(2) = 4.46, *p = 0.046 (two-tailed t test). D–M, Representative micrographs of axotomized nerves comparing myelin clearance between WT (D, F, H, J, L) and Ccr2−/− (E, G, I, K, M) mice at 0 d (D, E), 1 d (F, G), 3 d (H, I), 5 d (J, K), and 7 d (L, M) after injury. Scale bar, 20 μm.
Figure 2.
Figure 2.
Axonal and myelin degeneration is comparable between WT and Ccr2−/− mice. A–D, Longitudinal sciatic nerve semithin sections of contralateral (A, B) and 7 d axotomized (C, D) nerves of WT (A, C) and Ccr2−/− (B, D) mice were stained with toluidine blue to visualize myelinated nerve fibers. Representative images of contralateral nerves show myelinated and intact individual axons (yellow A), and Schmidt-Lanterman clefts (asterisk). Injured nerves display a large number of nuclei (arrow) and phagocytic cells containing degenerating myelin profiles and lipid vacuoles (dotted line). Scale bar, 10 μm. E–H, Representative images of cross sections of contralateral (E, F) and axotomized (G, H) nerves of WT (E, G) and Ccr2−/− (F, H) mice. Solid lines outline degenerating fibers. Dotted lines indicate phagocytic cells containing degenerating myelin profiles and lipid vacuoles. Scale bar, 10 μm. I–K, No significant differences in number of myelinated fibers per nerve (I), number of degenerating fibers and phagocytic cells (J), or g-ratios (K) were observed between injured 7 d WT and Ccr2−/− nerves. I, n = 4 or 5 mice per genotype per time point. F(1,17) = 486.65, **p < 0.001 (ANOVA). J, No statistical significance. K, F(1,17) = 25.53, *p = 0.039, **p < 0.001 (ANOVA). L, M, Western blot analyses of neurofilament-light (L) and myelin protein zero (M) in sciatic nerves with time after injury also show no significant differences between genotypes in the removal of axonal and myelin proteins, respectively. L, n = 3 mice per genotype per time point. For 3 d, F(1,9) = 395.61, **p < 0.001 (ANOVA); for 5 d, F(1,10) = 397.86, **p < 0.001 (ANOVA); for 7 d, F(1,10) = 179.22, **p < 0.001 (ANOVA). M, n = 3 mice per genotype per time point. For 3 d, F(1,10) = 17.59, *p = 0.014 for WT, *p = 0.024 for Ccr2−/− (ANOVA); for 5 d, F(1,10) = 120.84, **p < 0.001 (ANOVA); for 7 d, F(1,10) = 130.61, **p < 0.001 (ANOVA). Differences in neurofilament-light and myelin protein zero in axotomized nerves between genotypes at individual time points were not statistically significant. Separate gels were run for each genotype, and both proteins were run on the same gel.
Figure 3.
Figure 3.
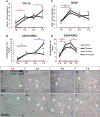
Ccr2−/− nerves boast more phagocytic Schwann cells than WT nerves. A–D, Injury time course shows CD11b+ macrophages (A), phagocytic macrophages (B), GFAP+ Schwann cells (C), and phagocytic Schwann cells (D). Phagocytic cells were determined based on the colocalization of ORO (black) with either CD11b (red) or GFAP (green). Ccr2−/− mice show increased uptake of degenerated myelin by Schwann cells at 3 and 5 d after sciatic nerve transection compared with WT mice. CD11b+ populations are comparable between genotypes at 1, 3, and 5 d after injury but increase significantly between 5 and 7 d in WT nerves alone. A, n = 4 or 5 mice per genotype per time point. Between injury at individual time points: at 1 d, F(1,16) = 8.38, *p = 0.015 for WT (ANOVA); at 3 d, F(1,18) = 106.8, **p < 0.001 for WT and Ccr2−/− (ANOVA); at 5 d, F(1,16) = 214.79, **p < 0.001 for WT and Ccr2−/− (ANOVA); at 7 d, F(1,18) = 54.55, *p = 0.001 for Ccr2−/−, **p < 0.001 for WT (ANOVA). Between genotypes at individual time points: at 1 d, F(1,16) = 3.48, +p = 0.045 (ANOVA); at 5 d, F(1,16) = 2.03, +p = 0.047 (ANOVA); at 7 d, F(1,18) = 3.05, +p = 0.022 (ANOVA). Between time points: 1 and 3 d, F(3,34) = 12.08, *p = 0.043 for Ccr2−/− (ANOVA); 5 and 7 d, F(3,34) = 12.08, *p = 0.043 for WT (ANOVA). B, Between injury at individual time points: at 1 d, F(1,16) = 8.03, *p = 0.039 for WT (ANOVA); at 3 d, F(1,18) = 111.26, **p < 0.001 for WT and Ccr2−/− (ANOVA); at 5 d, F(1,16) = 422.7, **p < 0.001 for WT and Ccr2−/− (ANOVA); at 7 d, F(1,18) = 97.2, *p = 0.002 for Ccr2−/−, **p < 0.001 for WT (ANOVA). Between genotypes at individual time points: at 7 d, F(1,18) = 19.23, ++p < 0.001 (ANOVA). Between time points: 1 and 3 d, F(3,34) = 26.58, *p = 0.031 for WT, *p = 0.005 for Ccr2−/−; 5 and 7 d, F(3,34) = 26.58, **p < 0.001 for WT. C, Between injury at individual time points: at 1 d, F(1,16) = 76.83, **p < 0.001 for WT and Ccr2−/− (ANOVA); at 3 d, F(1,18) = 298.0, **p < 0.001 for WT and Ccr2−/− (ANOVA); at 5 d, F(1,16) = 48.66, **p < 0.001 for WT and Ccr2−/− (ANOVA); at 7 d, F(1,18) = 50.68, **p < 0.001 for WT and Ccr2−/− (ANOVA). Between time points: 1 and 3 d, F(3,34) = 10.61, *p = 0.010 for WT, **p < 0.001 for Ccr2−/− (ANOVA). D, Between injury at individual time points: at 1 d, F(1,16) = 33.93, *p = 0.002 for Ccr2−/−, **p < 0.001 for WT (ANOVA); at 3 d, F(1,18) = 267.49, **p < 0.001 for WT and Ccr2−/− (ANOVA); at 5 d, F(1,16) = 196.0, **p < 0.001 for WT and Ccr2−/− (ANOVA); at 7 d, F(1,18) = 493.39, **p < 0.001 for WT and Ccr2−/− (ANOVA). Between genotypes at individual time points: at 3 d, F(1,18) = 2.75, +p = 0.029 (ANOVA); at 5 d, F(1,16) = 3.01, +p = 0.028 (ANOVA); at 7 d, F(1,18) = 2.03, p = 0.052, not significant. Between time points: 1 and 3 d, F(3,34) = 30.05, *p = 0.002 for WT, **p < 0.001 for Ccr2−/−; 5 and 7 d, F(3,34) = 30.03, *p = 0.002 for Ccr2−/−. E–L, Representative micrographs of CD11b, GFAP and ORO at 1 d (E, F), 3 d (G, H), 5 d (I, J), and 7 d (K, L) after injury in WT (E, G, I, K) and Ccr2−/− (F, H, J, L) nerves. Arrows indicate CD11b/ORO (red/black) overlap and GFAP/ORO (green/black) overlap. Scale bar, 20 μm.
Figure 4.
Figure 4.
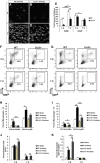
Macrophage accumulation is significantly diminished and neutrophil accumulation is significantly increased in the injured sciatic nerves of Ccr2−/− mice, compared with WT mice. Three and 7 d after transection, the distal nerve segments were dissected and examined using IHC or flow cytometry. A–D, Representative images show that accumulation of CD68+ macrophages is significantly reduced in axotomized Ccr2−/− nerves at 3 and 7 d after injury (B, D) compared with WT nerves (A, C). Scale bar, 10 μm. E, Quantification of total CD68+ and GFAP+ cell counts indicates that macrophage numbers are significantly reduced in Ccr2−/− nerves compared with WT nerves at both time points after injury, whereas Schwann cell numbers are comparable between genotypes at both time points. n = 5 mice per genotype per time point. For CD68 between genotypes: F(1,18) = 29.71, *p = 0.006, **p < 0.001 (ANOVA). For CD68 between time points: F(1,18) = 37.39, *p = 0.002, **p < 0.001 (ANOVA). For GFAP between time points: F(1,18) = 16.8, *p = 0.002 (ANOVA). F–K, Flow cytometric analysis of macrophage populations (F) in injured nerves confirms the significant attenuation of CD11b+F4/80+ and CD11b+Ly6G cells in Ccr2−/− mice at both 3 d (H) and 7 d (I) after injury. H, For CD11b+F4/80+: between injury: n = 3 mice per genotype, F(1,10) = 19.82, **p < 0.001; between genotypes: F(1,10) = 16.31, **p < 0.001 (ANOVA). For CD11b+Ly6G: between injury: F(1,10) = 18.2, *p = 0.004 (ANOVA). I, For CD11b+F4/80+: between injury: n = 3 mice per genotype, F(1,10) = 30.03, *p = 0.002 for WT, *p = 0.012 for Ccr2−/− (ANOVA); between genotypes: F(1,10) = 9.55, *p = 0.023 (ANOVA). For CD11b+Ly6G: between injury: F(1,10) = 62.9, **p < 0.001 for WT, *p = 0.021 for Ccr2−/− (ANOVA); between genotypes: F(1,10) = 37.27, **p < 0.001 (ANOVA). J, Similar to IHC results, p75+ Schwann cells were comparable between genotypes at both time points. For 3 d, F(1,10) = 7.82, *p = 0.014 (ANOVA); for 7 d, F(1,10) = 61.14, *p = 0.001 for WT, **p < 0.001 for Ccr2−/− (ANOVA). G, K, Strikingly, CD11b+Ly6G+ neutrophils were more prevalent in Ccr2−/− nerves 3 d after axotomy compared with WT nerves. Between injury: F(1,10) = 49.54, *p = 0.011 for WT, **p < 0.001 for Ccr2−/− (ANOVA). Between genotypes: F(1,10) = 4.56, *p = 0.013 (ANOVA).
Figure 5.
Figure 5.
Neutrophils accumulate along the length of the injured distal sciatic nerve, not just at the injury site. A, B, Flow cytometric analysis of neutrophil populations (CD11b+Ly6G+) in 3 d injured nerves that include the injury site (A) and exclude the injury site (B) indicates that neutrophils accumulate within the entire distal stump and not merely at the site of injury. Similar to nerves that include the injury site, significantly more neutrophils accumulate in injured Ccr2−/− nerves compared with WT nerves when the injury site is excluded. “Distal Stump-Injury Site (2 mm)” indicates that a 2 mm segment of nerve that included the injury site was removed before processing for flow cytometry. A, n = 3 mice per genotype. Between injury: F(1,10) = 49.54, *p = 0.011 for WT, **p < 0.001 for Ccr2−/− (ANOVA). Between genotypes: F(1,10) = 4.56, *p = 0.013 (ANOVA). B, n = 4 mice per genotype. Between injury: F(1,14) = 91.31, **p < 0.001 (ANOVA). Between genotypes: F(1,14) = 4.66, *p = 0.004 (ANOVA).
Figure 6.
Figure 6.
mRNA expression of neutrophil chemokines is maintained at significantly higher levels after injury in Ccr2−/− nerves compared with WT nerves. A, B, Relative expression of Cxcl1 and Cxcl2 at 6 h (A) and 48 h (B) after sciatic nerve transection was quantified using the comparative Ct method (ΔΔCt) normalized to the housekeeping gene Gapdh. Comparable expression between genotypes was observed 6 h after injury; however, expression was maintained only in Ccr2−/− nerves at 48 h. n = 4 samples per genotype (two nerves pooled per sample), t(6) = −3.51, *p = 0.0126 for Cxcl1 (two-tailed t test), t(6) = −3.46, *p = 0.0134 for Cxcl2 (two-tailed t test). C, D, Gene expression of the macrophage chemokines Ccl2 and Cx3cl1 was also quantified at 6 h (C) and 48 h (D) after injury in WT and Ccr2−/− nerves. t(6) = 2.46, *p = 0.0485 (two-tailed t test).
Figure 7.
Figure 7.
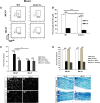
Conditional inhibition of CCR2 displays comparable neutrophil and macrophage accumulation in the distal sciatic nerve, and myelin clearance, compared with nerves of global Ccr2−/− mice. A, WT mice were treated with the anti-CCR2 depletion antibody MC-21 every day after injury for 4 d, and analysis was performed on the fifth day. B–E, MC-21 treatment significantly reduced the total Ly6C+ monocyte population (B, C) in the blood. n = 3 mice per condition, t(4) = 4.19, *p = 0.0137 (two-tailed t test). D, Inflammatory Ly6Chi monocytes were specifically depleted with MC-21 treatment. t(4) = 9.46, *p < 0.001 (two-tailed t test). No differences were observed in CD11b+Ly6G+ blood neutrophils (E). F, Accumulation of macrophages in sciatic nerves is represented as a percentage of the section area that was stained. n = 5 mice per condition per genotype. Between injury: F(1,28) = 130.12, **p < 0.001 (ANOVA). Between conditions: F(2,27) = 10.13, **p < 0.001 (ANOVA). G–I, Representative images of conditional inhibition of CCR2 (H) and a global knock-out of Ccr2 (I) showed comparable reductions in CD68+ macrophage accumulation in injured nerves compared with MC-67 isotype control nerves (G). Scale bar, 20 μm. J–M, Quantification of myelin clearance using Luxol fast blue (J) in MC-67-treated (K), MC-21-treated (L), or global Ccr2−/− mice (M) showed comparable removal of debris between all conditions 5 d after injury. n = 4 or 5 mice per condition per genotype. Between injury: F(1,26) = 1453.59, **p < 0.001 (ANOVA). Scale bar, 20 μm. N, O, Similar to global Ccr2−/− nerves (in Fig. 4), conditional inhibition of CCR2 produced significantly more CD11b+Ly6G+ neutrophils in the injured nerve compared with injured control nerves at 3 d after injury. n = 3 mice per condition. Between injury: F(1,10) = 131.05, **p < 0.001 (ANOVA). Between conditions, F(1,10) = 21.75, **p < 0.001 (ANOVA).
Figure 8.
Figure 8.
Significantly more neutrophils in Ccr2−/− nerves phagocytose polystyrene beads compared with WT nerves. A, Fluorescent polystyrene beads were injected into sciatic nerves before injury, and phagocytic cells were sorted based on their ingestion of beads. Quantification of the percentage of total phagocytic cells shows differences between genotypes and time points in the phagocytosis of beads by CD68+ macrophages, GFAP+ Schwann cells, Ly6G+ neutrophils, and CD11c+ dendritic cells, whereas no differences were observed in fibroblasts or endothelial cells. Significantly more phagocytic neutrophils are identified in the Ccr2−/− mouse at 3 d after injury compared with WT. This compensatory mechanism is also supplemented by an increase in phagocytosis by Schwann cells in Ccr2−/− mice at 7 d after injury compared with its 3 d time point. Data are represented as an average of two or three independent experiments. n = 9–664 phagocytic cells per cellular marker per experiment. For macrophages, between genotypes: F(1,10) = 21.54, *p = 0.018 at 3 d, *p = 0.007 at 7 d (ANOVA); between time points: F(1,10) = 8.9, *p = 0.043 (ANOVA). For Schwann cells, F(1,10) = 8.23, *p = 0.010 (ANOVA). For neutrophils, between genotypes: F(1,6) = 11.01, *p = 0.007 (ANOVA); between time points: F(1,6) = 57.67, *p = 0.001 (ANOVA). For dendritic cells, between genotypes: F(1,6) = 9.93, *p = 0.02 (ANOVA); between time points: F(1,6) = 16.04, *p = 0.012 (ANOVA). B, Cell counts were normalized to 200 cells per coverslip to allow for comparison of total number of phagocytic cells. Data are represented as an average of two or three independent experiments. n = 9–664 phagocytic cells per cellular marker per experiment. For macrophages, between genotypes: F(1,10) = 40.18, *p = 0.003 at 3 d, *p = 0.002 at 7 d (ANOVA); between time points: F(1,10) = 15.45, *p = 0.017 for WT, *p = 0.035 for Ccr2−/− (ANOVA). For Schwann cells, F(1,10) = 8.54, *p = 0.009 (ANOVA). For neutrophils, between genotypes: F(1,6) = 7.21, *p = 0.009 (ANOVA); between time points: F(1,6) = 60.76, *p = 0.001 (ANOVA). For dendritic cells, between genotypes: F(1,6) = 9.93, *p = 0.02 (ANOVA); between time points: F(1,6) = 16.04, *p = 0.012 (ANOVA). C–K, Changes in cell phagocytic index are not responsible for the compensatory mechanism of nerve debris clearance in the Ccr2−/− mouse. C–H, Representative micrographs of phagocytic CD68+ macrophages (C, D), GFAP+ Schwann cells (E, F), and Ly6G+ neutrophils (G, H) in WT (C, E, G) and Ccr2−/− (D, F, H) nerves 7 d (C–F) or 3 d (G, H) after injury. All original images were cropped to the same size. Scale bar, 20 μm. I–K, Phagocytic indices of macrophages and dendritic cells (I), neutrophils, fibroblasts, and endothelial cells (J), and Schwann cells (K) are not different between WT and Ccr2−/− nerves. Phagocytic indices of macrophages and Schwann cells are significantly increased for both genotypes between 3 and 7 d after injury. I, n = 1 experiment, n = 593 phagocytic CD68+ macrophages, F(1,591) = 17.53, *p = 0.007, **p < 0.001 (ANOVA). J, No statistical significance. K, n = 1 experiment, n = 351 phagocytic GFAP+ Schwann cells, F(1,349) = 14.81, *p = 0.024 for WT, *p = 0.002 for Ccr2−/− (ANOVA).
Figure 9.
Figure 9.
Significantly more macrophages phagocytose myelin in WT nerves 7 d after injury, whereas significantly more neutrophils phagocytose myelin in Ccr2−/− nerves 3 d after axotomy. A, B, The percentage (A) and number (B) of phagocytic cells per cell type were quantified per genotype per time point. A, For macrophages, n = 5 mice per genotype per time point: between genotypes: F(1,18) = 10.57, *p = 0.001 (ANOVA); between time points: F(1,18) = 18.93, **p < 0.001 (ANOVA). For Schwann cells, n = 5 mice per genotype per time point, no statistical significance. For neutrophils, n = 5 or 6 mice per genotype per time point: between genotypes: F(1,19) = 2.05, *p = 0.026 (ANOVA); between time points: F(1,19) = 4.11, *p = 0.011 (ANOVA). B, For macrophages, n = 5 mice per genotype per time point: between genotypes: F(1,18) = 14.17, **p < 0.001 (ANOVA); between time points: F(1,18) = 15.6, **p < 0.001 (ANOVA). For Schwann cells, n = 5 mice per genotype per time point, no statistical significance. For neutrophils, n = 5 or 6 mice per genotype per time point: between genotypes: F(1,19) = 4.12, *p = 0.016 (ANOVA); between time points: F(1,19) = 14.92, *p = 0.001 (ANOVA). C–N, Representative images showing MBP and CD68 (C, D, I, J), MBP and p75 (E, F, K, L), and MBP and Ly6G (G, H, M, N) double labeling in the sciatic nerve 3 d (C–H) or 7 d (I–N) after a transection injury in WT (C, E, G, I, K, M) and Ccr2−/− (D, F, H, J, L, N) mice. Phagocytosis was determined by the colocalization of MBP (red) with CD68, p75, or Ly6G (green) to label macrophages, Schwann cells, or neutrophils, respectively, in sciatic nerve tissue sections. Arrows indicate phagocytic cells. Dashed arrows indicate higher-magnification inset images. MBP immunofluorescence intensity (C–H) and p75 immunofluorescence intensity (E, F) were altered after acquisition to allow for better visualization of the myelin stain. Any adjustments were applied comparably to each image. Scale bar, 10 μm.
Figure 10.
Figure 10.
Double inhibition of CCR2 and CX3CR1 neither reduces macrophage accumulation in the nerve relative to the single knock-outs nor obstructs myelin clearance. A, B, Five days after injury, Cx3cr1−/− mice treated with MC-67 exhibited a slightly reduced Ly6C+CD11b+Ly6G blood population compared with WT mice, whereas MC-21 treatment substantially reduced the total Ly6C+ monocyte population in both genotypes. n = 3 mice per treatment. Between treatment: F(1,10) = 1543.16, **p < 0.001 (ANOVA); between genotypes: F(1,10) = 42.07, *p = 0.005, **p < 0.001 (ANOVA). C, Accumulation of macrophages in sciatic nerves is represented as a percentage of the section area that was stained. n = 4 or 5 mice per genotype per treatment. For MC-67, between injury: F(1,16) = 77.57, **p < 0.001 (ANOVA); between genotypes: F(1,16) = 4.73, *p = 0.010 (ANOVA). For MC-21, F(1,16) = 91.27, **p < 0.001 (ANOVA). Between treatment: F(1,34) = 2.23, *p = 0.001 (ANOVA). D–G, Axotomized Cx3cr1−/− nerves demonstrate reduced CD68+ macrophage accumulation 5 d after injury compared with axotomized WT nerves treated with MC-67 (D, E). Double inhibition of CCR2 (MC-21) and CX3CR1 did not further attenuate the macrophage response in injured nerves (F, G). H–L, Quantification of myelin clearance using Luxol fast blue (H) in MC-67-treated (I, J) or MC-21-treated (K, L) mice showed comparable removal of debris between all conditions 5 d after injury. n = 4 mice per genotype per treatment. For MC-67, between injury: F(1,16) = 1121.35, **p < 0.001 (ANOVA). For MC-21, F(1,14) = 1510.77, **p < 0.001 (ANOVA). Scale bar, 20 μm.
Figure 11.
Figure 11.
Neutrophil depletion significantly inhibits myelin clearance in Ccr2−/− and WT nerves 7 d after injury. A–E, Mice were injected with an anti-Ly6G or isotype-matched control antibody according to the schematic (A), and representative flow analyses of blood 3 d after axotomy in WT and Ccr2−/− mice confirmed neutrophil depletion after treatment with anti-Ly6G antibody by gating on CD11b+SSChi cells (B, D) and CD11b+Ly6G+ cells (C, E). D, n = 4 mice per genotype per treatment. Between genotypes: F(1,14) = 10.59, **p < 0.001 (ANOVA); between treatments: F(1,14) = 281.31, **p < 0.001 (ANOVA). E, Between genotypes: F(1,14) = 30.65, **p < 0.001 (ANOVA); between treatments: F(1,14) = 618.39, **p < 0.001 (ANOVA). F, G, A significant reduction in the accumulation of neutrophils in the nerve was also confirmed 3 d after injury. n = 4 mice per genotype per treatment. Between genotypes: F(1,10) = 6.27, *p = 0.006 (ANOVA); between treatments: F(1,10) = 11.7, *p = 0.003 (ANOVA). H, I, Quantification of myelin between groups 7 d after injury indicates that the loss of neutrophils significantly impedes clearance in both WT and Ccr2−/− nerves compared with isotype-matched controls. n = 5 mice per genotype per treatment. For WT isotype control, t(8) = 16.06; for WT anti-Ly6G, t(8) = 9.57; for Ccr2−/− isotype control, t(8) = 27.44; for Ccr2−/− anti-Ly6G, t(8) = 5.28, **p < 0.001 (two-tailed t test). I, This clearance defect has a greater effect on clearance in Ccr2−/− nerves. Between genotypes: F(1,18) = 5.97, *p = 0.019 (ANOVA); between treatments: F(1,18) = 33.97, *p = 0.005 for WT, **p < 0.001 for Ccr2−/− (ANOVA). J–M, Representative micrographs of isotype-treated axotomized (J, K) and Ly6G-treated axotomized (L, M), WT (J, L), and Ccr2−/− (K, M) nerves. Scale bar, 20 μm.
Figure 12.
Figure 12.
Clearance of MBP is inhibited in neutrophil-depleted nerves 7 d after sciatic nerve transection. A, MBP and myelin protein zero-labeled axotomized sciatic nerve sections from isotype control or Ly6G-treated WT and Ccr2−/− nerves are represented as percentage area stained. n = 5–7 mice per genotype per treatment. F(1,20) = 9.16. *p = 0.042 for Ccr2−/−. p = 0.051 for WT (not significant). B–E, Representative images show that removal of MBP after axotomy is inhibited in Ly6G-treated Ccr2−/− nerves (E) compared with isotype control-treated nerves (D), with Ly6G-treated WT nerves (C) showing a trend toward significance compared with isotype control-treated nerves (B). F–I, No effect is observed between treatments with myelin protein zero. Scale bar, 20 μm. No mice were excluded. However, quantification of percentage area stained described that for each mouse, three images per nerve were captured (quantification excluded the injury site and ∼1 mm distal to the injury site). For MBP (4 of 22 mice) and for myelin protein zero (1 of 22 mice), one of three of those images were excluded due to the values being outside the range of mean ± (2 × SD).

References

    1. Ajami B, Bennett JL, Krieger C, McNagny KM, Rossi FM (2011) Infiltrating monocytes trigger EAE progression, but do not contribute to the resident microglia pool. Nat Neurosci 14:1142–1149. 10.1038/nn.2887 - DOI - PubMed
    1. Ajuebor MN, Hogaboam CM, Kunkel SL, Proudfoot AE, Wallace JL (2001) The chemokine RANTES is a crucial mediator of the progression from acute to chronic colitis in the rat. J Immunol 166:552–558. 10.4049/jimmunol.166.1.552 - DOI - PubMed
    1. Amulic B, Cazalet C, Hayes GL, Metzler KD, Zychlinsky A (2012) Neutrophil function: from mechanisms to disease. Annu Rev Immunol 30:459–489. 10.1146/annurev-immunol-020711-074942 - DOI - PubMed
    1. Auffray C, Fogg D, Garfa M, Elain G, Join-Lambert O, Kayal S, Sarnacki S, Cumano A, Lauvau G, Geissmann F (2007) Monitoring of blood vessels and tissues by a population of monocytes with patrolling behavior. Science 317:666–670. 10.1126/science.1142883 - DOI - PubMed
    1. Auffray C, Fogg DK, Narni-Mancinelli E, Senechal B, Trouillet C, Saederup N, Leemput J, Bigot K, Campisi L, Abitbol M, Molina T, Charo I, Hume DA, Cumano A, Lauvau G, Geissmann F (2009) CX3CR1+ CD115+ CD135+ common macrophage/DC precursors and the role of CX3CR1 in their response to inflammation. J Exp Med 206:595–606. 10.1084/jem.20081385 - DOI - PMC - PubMed

Publication types

MeSH terms

LinkOut - more resources